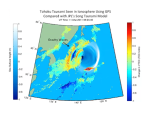
Scientists at the U.S. National Aeronautics and Space Administration (NASA) are testing a novel approach to detect tsunamis by the rumble they make in the atmosphere.The new hazard-monitoring technology, called GUARDIAN (GNSS Upper Atmospheric Real-time Disaster Information and Alert Network), uses GPS signals to go wave-hunting in the Pacific Ring of Fire.
UNOOSA's Annual Reports describe the Office's work in promoting international cooperation for the peaceful use and exploration of space, and in the use of space science and technology for sustainable economic and social development. They also illustrate statistics and provide key facts about UNOOSA.
The Annual Reports function not only as an activities report to the members of the United Nations Committee on the Peaceful Uses of Outer Space, but also as an awareness-raising tool for UN member states and the public.
This is event is available for participation on an ongoing basis
The 6th World Landslide Forum “Landslides Science for sustainable development” will be held in Florence at the Palazzo dei Congressi from 14 to 17 November 2023.
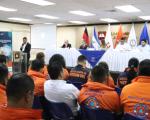
Like many other countries of the world, El Salvador faces the frequent impact of floods triggered by tropical storms and hurricanes. Since 2014, UN-SPIDER has been providing advisory support to the Directorate of Civil Protection of El Salvador and other government agencies on the use of space technologies and space-based information to confront the challenges of floods and other natural training courses.
This is event is available for participation on an ongoing basis
The role of information technology (IT) in disaster situations is becoming more critical in this recent years, especially in mitigating and reducing the risks associated with the disaster effects. Modern information and communication technologies can significantly facilitate the decision-making processes from the point of view of disaster risk reduction.
This is event is available for participation on an ongoing basis
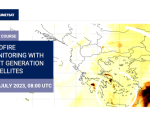
Recently launched and upcoming satellites, such as the Meteosat Third Generation (MTG) satellite and the Metop - Second Generation (Metop-SG) will provide advanced capabilities and valuable data for monitoring fires and their impacts. This online course by EUMETSAT showcases a series of case studies and associated workflows in Jupyter notebooks for fire applications using proxy data from MTG and Metop-SG. The webinar will explore case studies focusing on fires affecting the area of Gironde, France, during the summer of 2022.
This is event is available for participation on an ongoing basis
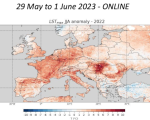
In the week from May 29 to June 1, EUMeTrain will hold an online Event Week on Heatwaves and Droughts. During the event week there will be a number of presentations which will cover different aspects of heatwaves and droughts, mainly focusing on satellite observations that can be used to study their impacts and causes. There will be a total of 15 presentations between the four days.
This is event is available for participation on an ongoing basis
This advanced-level training will focus on using remote sensing observations for monitoring post-fire impacts on watershed health. Specifically, this training will highlight uses of NASA Earth observations (EO) for pre-fire land cover mapping, watershed delineation and stream mapping, post-fire burn severity mapping, and pre- and post-fire riverine and freshwater water quality. This three-part training will highlight case studies that use remote sensing data for assessing the impacts of fires on watersheds.
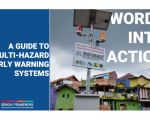
The United Nations Office for Disaster Risk Reduction (UNDRR) launched on 15 May 2023 the flagship Words into Action guide on Multi-Hazard Early Warning Systems (MHEWS). The aim of the guide is to provide guidance for governments, and partners on how to institutionalize, operate, monitor, and strengthen people-centered inclusive approaches for effective multi-hazard early warning systems that enable early action. The guide includes content on several topics such as:
This is event is available for participation on an ongoing basis
This advanced-level training will focus on using remote sensing observations for monitoring post-fire impacts on watershed health, building off the ARSET training offered in 2021: Satellite Observations and Tools for Fire Risk, Detection, and Analysis. Specifically, this training will highlight uses of NASA Earth observations (EO) for pre-fire land cover mapping, watershed delineation and stream mapping, post-fire burn severity mapping, and pre- and post-fire riverine and freshwater water quality.
The primary audience for this training consists of local, regional, state, federal, and international organizations involved in resource and ecosystem management and disaster response. The secondary audience for this training are those with an interest in applying remote sensing data toward fire science.