Hydrological
Definition
UN-SPIDER Regional Support Offices with hazard-specific expertise
Related content on the Knowledge Portal
- read more
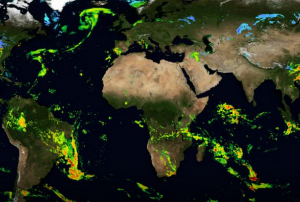
This three-part webinar series hosted by the International Precipitation Working Group (IPWG) and Global Precipitation Measurement (GPM) Applications Program will focus on the use of GPM data products for applications. Specifically, the participant will learn more about how to access GPM data and will be provided demonstrations on precipitation data access and analysis using NASA's Giovanni tool and Google Earth Engine.
To receive a certificate of completion, the participant will need to attend all three sessions of this training program.
Topics Covered:
- Review the TRMM / GPM Missions
- Become familiar with GPM data access and…
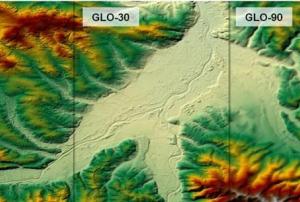
- The Copernicus DEM is a Digital Surface Model (DSM) which represents the surface of the Earth including buildings, infrastructure, and vegetation. The Copernicus DEM is provided in 3 different instances. Two worldwide coverages at 90m (GLO-90) and 30m (GLO-30) resolution are openly available to the public for download via the PANDA Catalogue and FTP. A further European coverage (EEA-10) is provided at 10m resolution, but data is restricted to eligible users who meet required access rights.Publishing institution:
- The Copernicus DEM is a Digital Surface Model (DSM) which represents the surface of the Earth including buildings, infrastructure, and vegetation. The Copernicus DEM is provided in 3 different instances. Two worldwide coverages at 90m (GLO-90) and 30m (GLO-30) resolution are openly available to the public for download via the PANDA Catalogue and FTP. A further European coverage (EEA-10) is provided at 10m resolution, but data is restricted to eligible users who meet required access rights.Publishing institution:
- Publishing institution:
According to the latest issue of an annual disaster statistics report, floods were the deadliest type of disasters in 2019, followed by extreme temperature, while storms affected the highest number of people. Published by the Centre for Research on the Epidemiology of Disasters (CRED), “Natural disasters 2019 - Now is the time to not give up” draws on data recorded in the Emergency Events Database (EM-DAT), which saw the addition of 396 disasters that affected a total of 95 million and caused $103 billion in economic losses around the world.
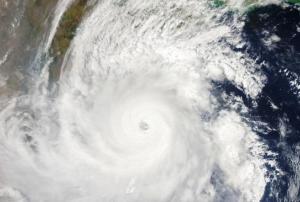
Accounting for 40 per cent of disaster events, Asia suffered the highest impact with 45 per cent of deaths and 74 per cent of total affected. India, which saw cyclone Fani cause destruction in 2019, was the country most…
read more20/08/2020- read moreNepalese Space Research Association (NESRA) is organizing a webinar “Space Technologies for Efficient Disaster Management”, which will be led by distinguished people who have worked to mitigate the effects of disasters using space technologies.The seminar is concerned with how space technologies contribute to efficient disaster management, especially in the wake of the recent flood and landslide risks in Nepal. The benefits of space…
World Congress on Disaster Management (WCDM) is a unique initiative of DMICS to bring researchers, policy makers and practitioners from around the world in the same platform to discuss various challenging issues of disaster risk management. The mission of WCDM is to promote interaction of science, policy and practices to enhance understanding of risks and advance actions for reducing risks and building resilience to disasters.
The Conference will discuss various topics, including:
read more- Remote Sensing, GIS and Drones for Disaster Risk Management
- Early Warning of Hydro-Meteorological Disasters: Tasks Ahead
- Early Warning of Earthquakes: How Far, How Near
- Operationalising Early Warning of Landslides
- Application of Artificial Intelligence for Managing Risks of Disasters
- Emerging Technologies for Climate & Disaster Resistant Agriculture
The Conference will provide in-depth analysis of the…- read moreThe major thrives of this congress will be discuss and develop an integrated Climate Resilience Ecosystem that will address Future Disaster Risk Reduction and Capacity Development of Vulnerable Communities for Sustainable & Inclusive Growth and Subsequently publish a White Paper that will be submitted to the Government of India and the State Government.The Conference will discuss different topics, including:
- Application of GIS & Remote Sensing for Integrated Disaster Risk Reduction
- Costal Vulnerability and Adaption strategies
- Water Security and Risk Management
- Management of Solid Waste for Sustainable Development
- Climate and Carbon Financing
- Sustainability and Inclusive Growth
- Extreme weather Events
- Global Warming and Coastal Risks
- Multi hazard Early Warning Systems
- Water Resource Sustainability and Security
- Application of GIS& RS for…
The training date is in the past. However, videos and resources of the training can be accessed here.
The European Space Agency’s Earth Observation for Sustainable Development (EO4SD) Climate Resilience Cluster is hosting a free webinar to provide insight about the potential of Earth Observation (EO) to support climate-resilient decision making at the regional and national scale.
Earth Observation (EO) data and services are vital tools for the water sector, supporting flood events, and conducting wetland inventory status in rural and urban areas. EO provides valuable information (Flood extent, historical flood events etc.) with the aim to assist authorities to prepare the most effective actions to manage flood risk and develop plans to tackle disasters. The fourth webinar of series will present in detail how…
read more


