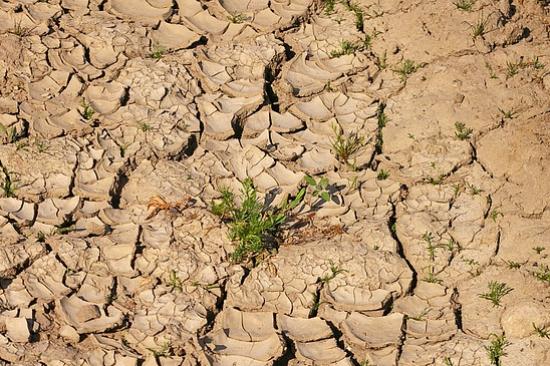
A break in the heat wave that hit Europe in the summer of 2018 is giving a reprieve to many people who had been suffering from the heat. However, great damages to the vegetation and harvest remain. In Germany, the Association of Farmers has reported damages from the dry spell of over EUR 1 billion. Vegetation growth in various regions and whether there is a long-term trend in vegetation development can be assessed using satellite imagery. Identifying regions that are susceptible to drought are important for drought early warning systems and disaster preparedness. In general, the analysis of satellite imagery is based on the spectral reflectance of the surface of the Earth which differs for different surface types such as soil and vegetation. For detecting water stressed areas, the spectral reflectance of vegetation is of special interest as it varies depending on the vegetation's condition.
Plants under water stress absorb less visible red light (thus appearing more red or brown) and emit less infra-red than healthy plants (Figure 1). This difference between the visible red and the invisible near infrared (NIR) is a good indicator of plant water stress. Indices quantifying plant health and density in an area are called vegetation indices. One example is the Enhanced Vegetation Index (EVI) shown in the image below for the year 2011. The development of the EVI over multiple years is determined to see whether an area is becoming drier with increasingly sparser vegetation.
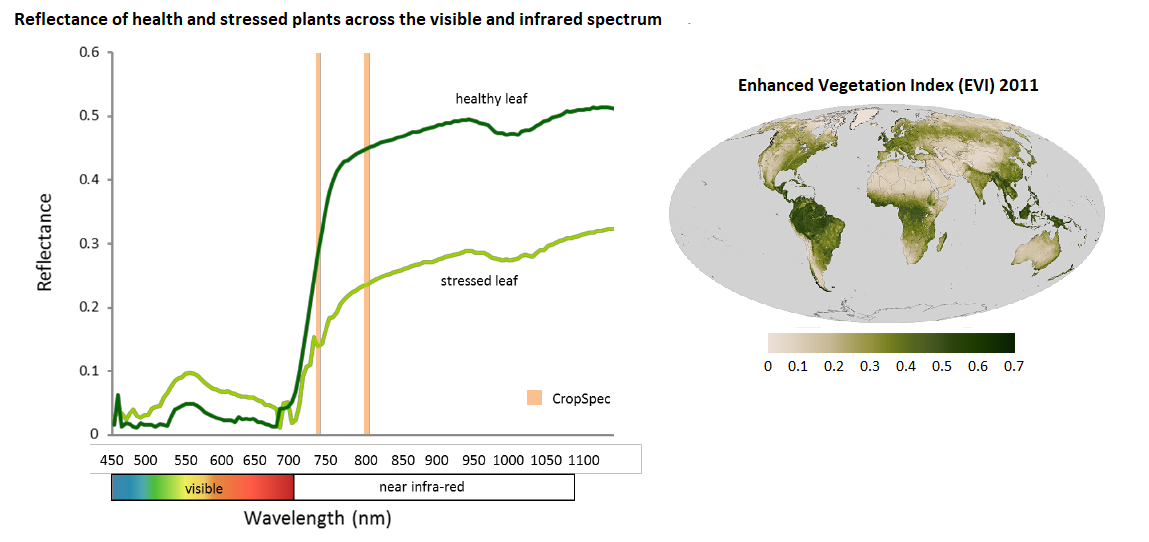 Figure 1. Reflectance of healthy and stressed plants across the visible and near-infrared (McVeagh et al. 2012) and illustration of the Enhanced Vegetation Index (EVI) in 2011. The EVI shows regions with dense and healthy vegetation such as undisturbed rainforests in dark green on the map, while deserts and sparsely vegetated areas appear in lighter colors. More infographics on the changes in plant absorption are provided by the University of Bonn and can be found here.
Vegetation trends, and in particular drought, can be monitored by processing satellite data. The Recommended Practice, developed by experts from the Federal University of Santa Maria in Brazil, applies the Standard Vegetation Index (SVI) - which illustrates changes in the Enhanced Vegetation Index (EVI) from one time point to the next - with respect to the average pixel EVI using freely available MODIS EVI data.
The SVI values represent how many standard deviations the present state of vegetation differs from the mean in a specific pixel. At values close to zero, the vegetation is in the state it is most likely to have in July. Values within one standard deviation are those that are only slightly above or below this expected value. Values above one standard deviation indicate that the state of vegetation is better or worse than average.
Limitations and possibilities of Vegetation Monitoring
Different methods for monitoring vegetation exist for different purposes and with different limitations. The Standard Vegetation Index (SVI) is used to assess trends, but does not allow a quantification of agricultural damages. Certain limitations must also be considered. For example, when crop rotation is applied in agricultural areas, a cyclical movement of years with low vegetation and high vegetation will occur. This will be detected as a respective change in the SVI, but is not caused by meteorological factors. This is why for damage assessments, ground samples need to be taken.
Integrated methods, for example using high resolution imagery from satellites or drones with knowledge of the situation in a specific area offer great possibilities. These detailed images can detect differences before water scarcity has made an irreversible impact on plants. Satellite image analysis is therefore being applied more frequently at high tech farms to monitor which specific crop areas require more water.