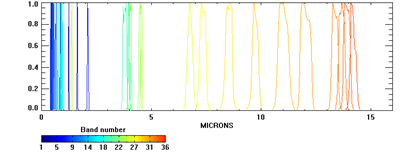
The MODIS sensor onboard the Aqua and Terra satellites acquires data in 36 spectral bands: two bands at 250 meters, five bands at 500 meters, and twenty-nine bands at 1000 meters spatial resolution.
MODIS data is useful to track changes in the landscape over time due to its high temporal resolution, which allows for the monitoring of vegetation health by means of time-series analyses with vegetation indices.
Figure 1 shows MODIS spectral bands and their bandwidth. MODIS data is available free of charge and can be downloaded from USGS (https://earthexplorer.usgs.gov/) or AppEEARS (https://lpdaacsvc.cr.usgs.gov/appeears/) once the user is registered.
In this recommended practice the data will be loaded directly in the Google Earth Engine environment and does not need to be downloaded.
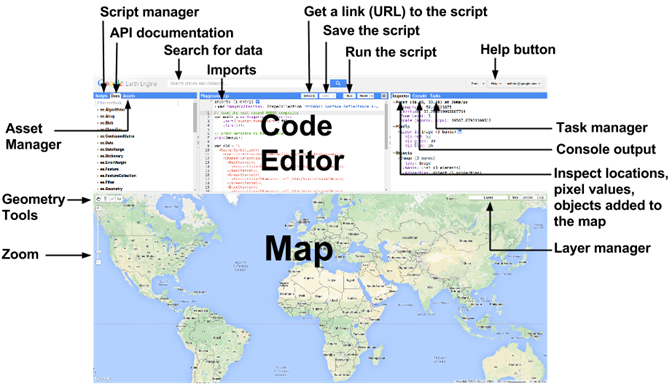
This Recommended Practice will utilize Google Earth Engine for the preparation of the NDVI, VCI, TCI, and VHI for the assessment of drought conditions using MODIS data. Initial access to Google Earth Engine can be requested by using one’s Gmail credential. The Google Earth Engine editor can then be accessed via the following URL: https://code.earthengine.google.com/. The interface of Google Earth Engine is shown in figure 2.
The step-by-step methodology for the calculation of the VCI, TCI, and VHI indices is given below.
Step 1. To calculate the VCI, TCI & VHI using Google Earth Engine, copy the code from annex 1 (TCI), annex 2 (VCI) or annex 3 (VHI), and paste it into the Code Editor window. The codes can also be imported by clicking these links:TCI, VCI and VHI. Each index and its output is calculated in an individual script.
Step 2. This script can be saved by clicking the save option shown in figure 2. The saved script will appear in the left window under the Script Manager and owner option.
Please note: In order to be able to save the script, you will need to make a change to it. E.g.: Add a line or a comment.
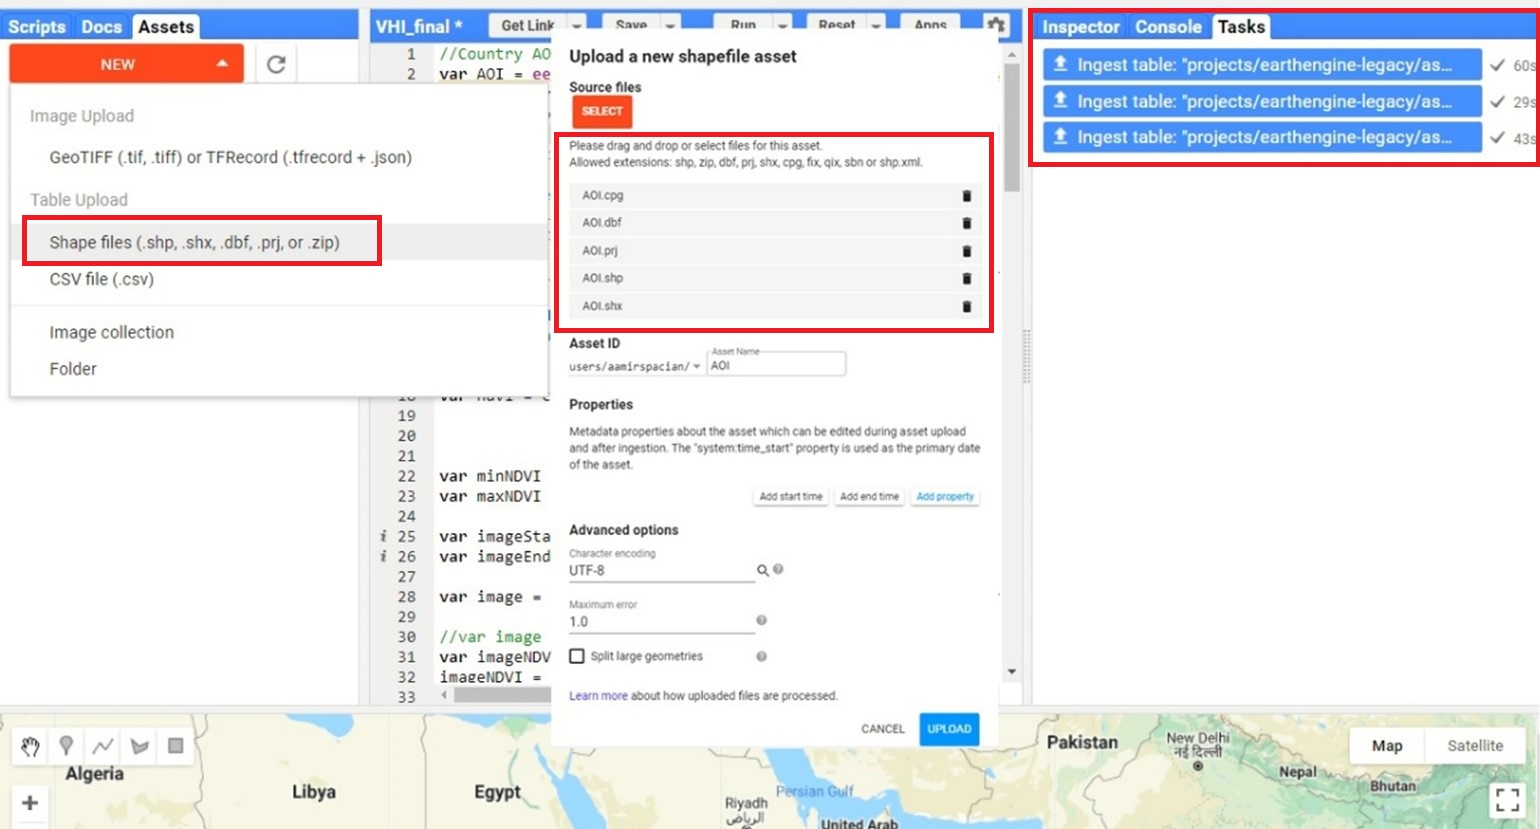
Step 3. The study area can be added manually or uploaded as a shapefile (see description in the code). However, it is recommended that the study area may be defined by importing a shapefile as shown in figure 3. For adding a shapefile, click the Assets menu (located in the left corner), then click NEW and select Shape files from the drop-down menu to upload desired Area of Interest (AOI). A popup window (Upload a new shapefile Asset) will appear to upload the desired shapefile. Now select all components of shapefile i.e. .shp, .prj, .dbf, .cpg, and shp.xml and click upload. The upload process will take a few seconds and can be seen under the Task menu as shown in figure 3. A shapefile for demonstration purposes is provided at the bottom of this page (annex 4), which consists of the adminstrative unit of the Sindh Province, Pakistan.
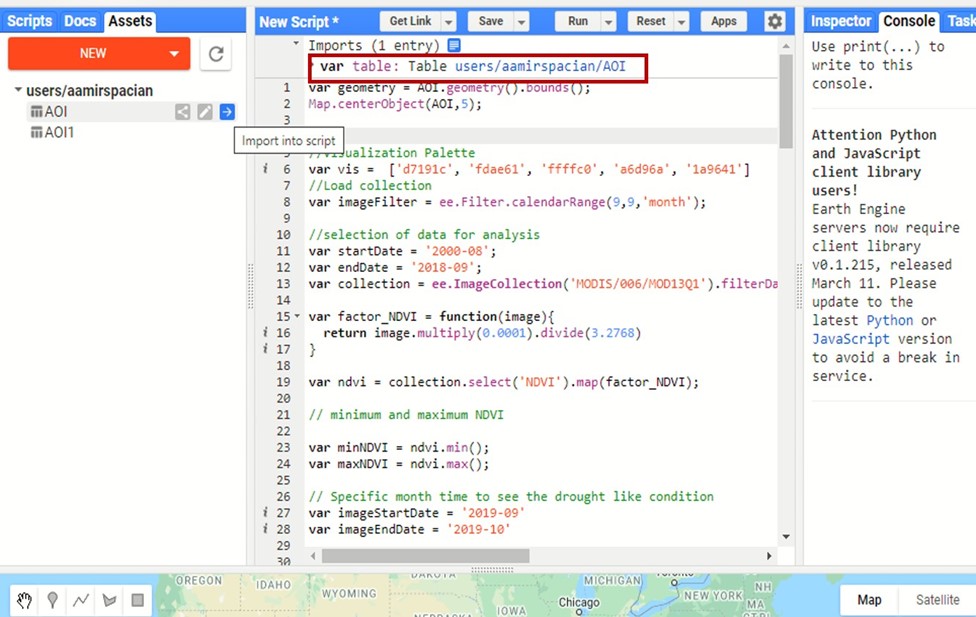
Step 4. Now click on the AOI in the left panel and import the shapefile into the Code Editor. Then change the variable name “table” to “AOI” in the Code Editor (Red Box) to run the script as shown in figure 4. Finally, click Run to execute the code.
Note: In case of the variable name was not changed, the script will end up with an error.
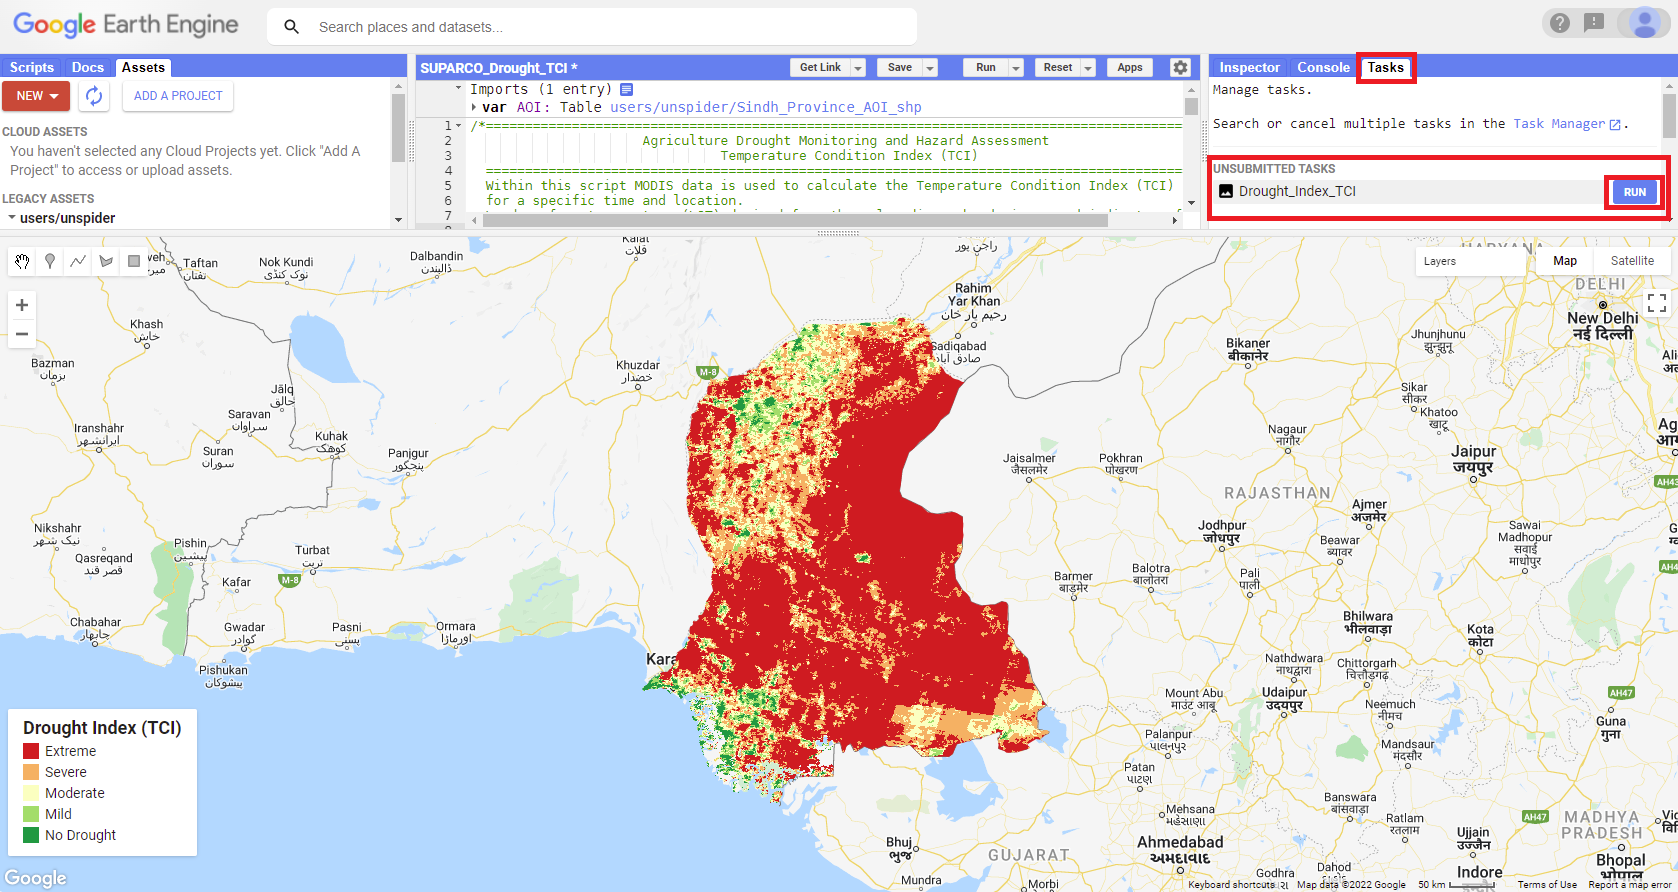
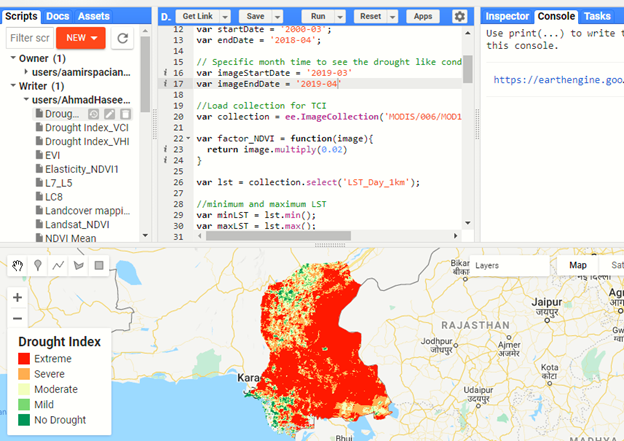
Step 5. The VCI, TCI and VHI is calculated for the month of March 2019 to assess the vegetation condition in the region. The calculations are based on the entire MODIS operation period (2000-today or selected end time). The output is available in the map window.
The output can be exported to the user’s Google Drive account, by running the task for the creation of the output file in the "Tasks" tab, as shown in figure 5. Afterwards, the output file can be used or downloaded from the user’s Google Drive.
Step 6. The output raster of the previous steps needs to be categorized into the drought severity zones so that the extent of drought can be analyzed in the affected region. VHI values vary between 0 and +1(100) and the raster image was classified as per the criteria mentioned in table 1 and implemented in the code.
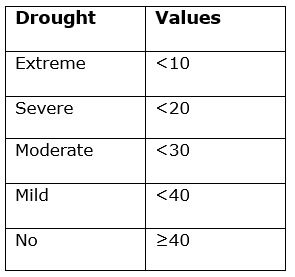
The classified image (tiff) is shown in figure 5. Subsequently, the classified image was recoded as per the criteria placed in table 2.
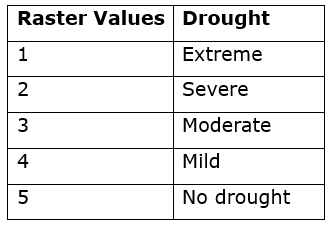
Final products can be used for further analysis of agriculture drought assessment and monitoring in a GIS environment along with other datasets.
Step 7. Users can also prepare maps based on VCI and TCI indices by repeating the procedure mentioned in Step 6. VCI and TCI outputs are shown in figures 6 and 7 respectively.

Conclusion
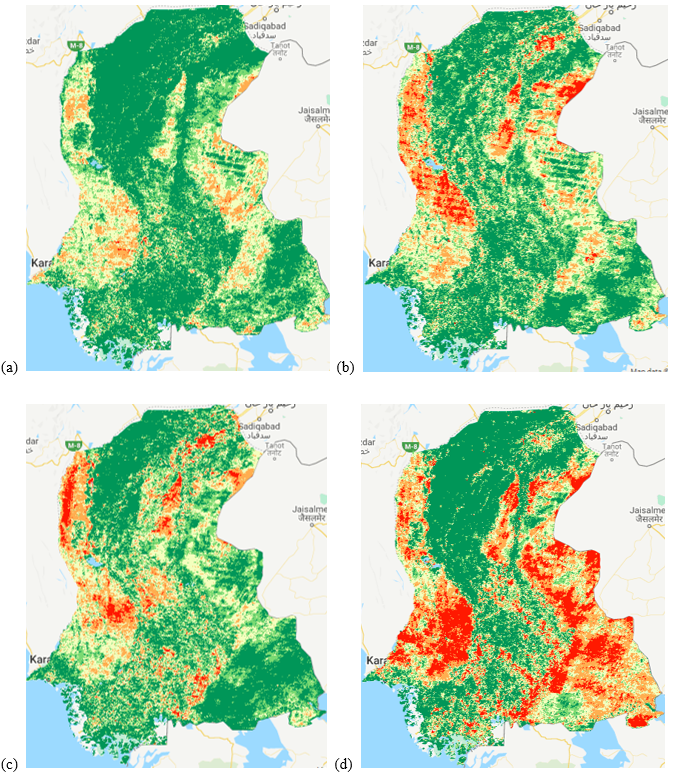
The scientific community uses VCI and VHI to analyze the greenness effect in agriculture to assess drought. While TCI is utilized to assess vegetation stress due to the temperature. Hence, VCI and VHI can be used for drought monitoring and assessment. However, VHI is more robust and effective due to its good representation of drought occurrence phenomena. VHI time series products pertaining to the study area are placed in Figure 9. This figure clearly shows the evolution of a drought-like situation, which evolved gradually from 2016 to 2019 respectively.