As stated in the Hyogo Framework for Action, "the starting point for reducing disaster risk and for promoting a culture of disaster resilience lies in the knowledge of the hazards and the physical, social, economic and environmental vulnerabilities to disasters that most societies face, and of the ways in which hazards and vulnerabilities are changing in the short and long term, followed by action taken on the basis of that knowledge."
Learning from the Past
Information on hazards is generated using catalogues of historic events and scientific models that describe the spatial and temporal dynamics of such hazards. It is used to elaborate land-use norms that aim to prevent people from settling in areas exposed to such hazards. In a similar fashion, information compiled regarding damages to infrastructure in case of earthquakes, floods, tornadoes, strong winds, tsunamis and other similar hazards is used to improve building codes and aim to reduce the physical vulnerability of infrastructure with respect to such events. Furthermore, information on places that may congregate vast amounts of people, including vulnerable groups such as children and the elderly, is used to improve early warning evacuation procedures and to establish evacuation routes in case of events that can trigger disasters.
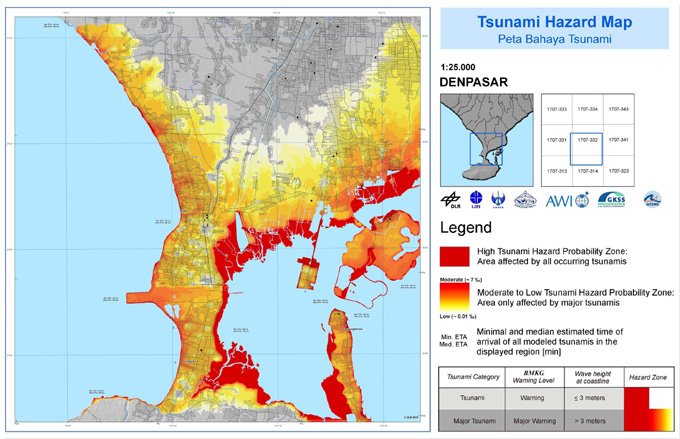
Hazard Maps
Hazard maps are elaborated combining specific parameters. They are generated in coarse resolution when used at the national level and at a high resolution when used in urban areas. As expected, the parameters to be used vary from hazard to hazard. Typically, hazards can be represented through maps. In many developed nations, flood hazard maps represent areas which could be flooded once every one hundred years. In the case of earthquakes, seismic hazard is represented on maps depicting the geographic areas which could be impacted by earthquakes with periods of return of 500 years and using contours presenting the expected values of the peak-ground acceleration (PGA). In other cases where the historic catalogue is not complete or is not yet elaborated, hazard maps usually depict the areas which could be exposed to such hazards but without referencing to a period of return.
Information on Vulnerability
Information on vulnerability is more difficult to compile given its social and economic nature. In some cases detailed assessments of vulnerability are conducted using specific surveys at the level of individual houses or communities. Such approaches provide more precise information on the different dimensions or components of vulnerability and are better tailored to capture information on the vulnerability of various sectors of development. In other cases, proxies are used to estimate the vulnerability of communities using demographic data and other data derived from national censuses, as well as economic data such as the Gross Domestic Product (GDP). However, such estimates may only capture a fraction of the vulnerability.
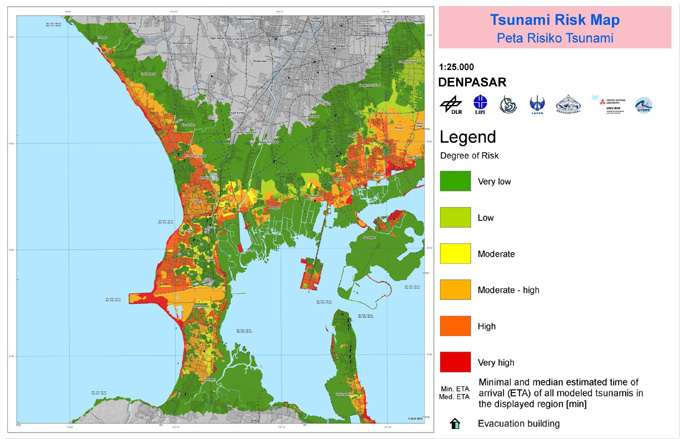
Risk Maps
A risk map is produced combining the information on hazard and vulnerability. Once the map is elaborated, it will be easy to detect which vulnerable elements or assets are exposed to hazards. In addition, it can be used by decision makers to identify the types of measures that need to be implemented to minimize the risks and to improve disaster preparedness efforts.
Communicating disaster risks
The communication of information regarding hazard, vulnerability and risk needs to be handled carefully. The aim should be to inform the public, but minimizing the negative consequences regarding the interpretation of such information. In some countries, the dissemination of hazard maps has led to a reduction in the price of land in areas exposed to such hazards. Nevertheless, experts recognize the need to make communities aware of the level of risk they are facing, in particular to make them aware of the notion of vulnerability so as to generate greater acceptance of government measures to reduce it.