 |  |  |  |
Vegetation indices use various combinations of multi-spectral satellite data to produce a single image representing vegetative vigor/stress/drought. Crops have a characteristic spectral response pattern in which visible blue and red energy is absorbed strongly, visible green light is reflected weakly (thus a green color) and near infrared energy is very strongly reflected. Because of this characteristic spectral response pattern, many of the vegetation index models use only the red and near-infrared imagery bands. In the past remote sensing based drought indices relied on few optical bands as provided by NOAA AVHRR or Landsat TM sensors, a newer generation tries to use multi band capabilities e.g the MODIS sensor on board terra/aqua satellites an example of which is normalized multi band Drought index NMDI (Wang and Qu 2007).
The Simple Ratio
Numerous vegetation Indices have been formulated, most of which are relate to the simple ratio index first described by Jordan (1969).
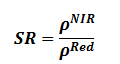
Typical ranges are a little more than 1 for bare soil to more than 20 for dense vegetation. However, the index is more susceptible to division by zero errors and the resulting scale is not linear thus making it difficult to apply statistical procedures.
The Normalized vegetation index - NDVI
It’s a universally acceptable index for drought assessment because of its simplicity in calculation, easy to interpret and its ability to partially compensate for the effects of atmosphere, illumination geometry. The severity of drought situation is assessed by the extent of NDVI deviation from its long term mean.
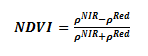
ρNIR and ρRed are reflectance values of Red and Near Infrared bands. The index contrasts the absorption features of chlorophyll in the red region of the electromagnetic spectrum and the strong reflectance of the near infra-red region The resulting index value is sensitive to the presence of vegetation and can be used to address issues of vegetation type, amount, and condition. The measurement scale has a desirable characteristics of producing values in the range of -1.0 to 1.0, where vegetated areas will typically have values greater than zero and negative values indicate non-vegetated surface features such as water, barren, ice, snow, or clouds, while the RVI ranges from 0 to infinity. In addition to the above divisions by zero are significantly reduced. This index is sensitive at low levels of vegetative cover, as compared to SR that is more sensitive to variations in dense canopies.
Enhanced Vegetation Index - EVI
This was meant to improve the quality of NDVI since it corrects for some distortions in the reflected light caused by the particles in the air as well as the ground cover below the vegetation.
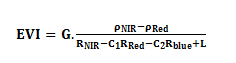
ρNIR and ρRed and ρblue are reflectance values of Red , Near Infrared and blue bands whereas; C1 and C2 are atmosphere resistance red and blue coefficients respectively L is the canopy background brightness correction factor and G is gain factor Neither the NDVI nor the EVI product will eliminate all obstacles. Clouds and aerosols can often block the satellites’ view of the surface entirely, glare from the sun can saturate certain pixels, and temporary malfunctions in the satellite instruments themselves can distort an image. Longer term averages of vegetation data help remove errors caused by clouds, but removes detail, especially at high spatial resolutions Kogan (1990).
Vegetation Condition Index - VCI
This index was first suggested by Kogan (1995 and 1997). It shows, effectively, how close the current month’s NDVI is to the minimum NDVI calculated from the long-term record of remote sensing images.
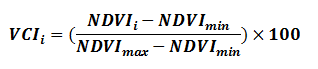
The VCI values between 50 to 100 % indicate optimal or above-normal conditions. At the VCI value of 100% the NDVI value for this month (or week) is equal to NDVImax. Different degrees of a drought severity are indicated by VCI values below 50%.
FAO’s Agricultural Stress Index System
FAO makes use of the Vegetation Health Index (VHI) that combines two indexes: the Vegetation Condition Index (VCI) and the Temperature Condition Index (TCI). The VCI is derived from the NDVI using the equation, which can be seen in the paragraph above
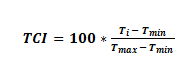
The TCI is similar to the VCI, but it is derived from Temperature measurements estimated by the infrared band of the AVHRR sensor (channel 4). Kogan (1995) proposed this temperature index to remove the distorting effect of clouds on satellite assessment of vegetation, since channel 4 is less sensitive to water vapour content in the atmosphere than the visible light channels. The mathematical formulation of the TCI is:.
The VHI is represented as a linear combination of the VCI and the TCI.

The parameters “a” and “b” have different weights depending on the crop being analysed. Under near normal conditions, vegetation is more sensitive to humidity during canopy formation and to temperature during flowering.
Remote sensing drought applications for agriculture
Drought is a regional phenomenon and as such sensors like (MODIS, Landsat, NOAA AVHRR etc) of low spatial resolution have been used for drought monitoring. To determine how much or what crops have been affected then there is need to use higher resolution imagery to extract up-to-date Landuse information (at small scale). This information is used together with the drought hazard map. Long et al state that the key social and physical factors that define agricultural drought are indentified and corresponding thematic maps are prepared. Risk is calculated by the integration of hazard and vulnerability. Important to note is that high resolution imagery is expensive to obtain and for this reason
References
Jordan, C.F. 1969. Derivation of leaf Area Index from Quality of Light on the Forest Floor. Ecology, 50: 663-666.
Kogan F.N. 1990. Remote Sensing of Weather Impacts on Vegetation in Homogeneous Areas. Int. J. Remote sensing, 11:1405-1419
Kogan F.N. 1995. Application of Vegetation Index and Brightness Temperature for Drought Detection. Adv. Space Research, 11:91-100.
Kogan F.N. 1997. Global Drought Watch Space. Bull Am.soc.met., 78:621-636.
LONG X., ZHEN L. ,CHENG S. et al. 2011 Quantitative Assessment and Spatial Characteristics of Agricultural Drought Risk in the Jinghe Watershed, Northwestern China[J]. Journal of Resources and Ecology, 2(4): 338-344.
Rouse, J., Hass, R., Schell, J. 1973. Deering, D. Monitoring Vegetation Systems in the Great Plains with ERTS. Third ERTS Symposium, NASA, SP-351 I, 309-317.
Wang, L. and Qu, J.J. 2007. NMDI: A Normalized Multi Band Drought Index for Monitoring Soil and Vegetation Moisture with Satellite Remote Sensing. Geophys. Res. Left., 34, L20405