• English
  • Español
  • Français

United
Nations


Office for Outer Space Affairs
UN-SPIDER Knowledge Portal

  • Home
  • About Us
    • What is UN-SPIDER?
    • About UNOOSA
    • Publications
    • Jobs
    • Meet the Team
    • Contact
  • Space Application
    • Satellite Technology
    • Emergency Mechanisms
    • Recovery Mechanisms
    • International Asteroid Warning Network
    • Space Mission Planning Advisory Group
    • International Space Weather Initiative
    • Space Technologies in the UN
    • User Stories
  • Links & Resources
    • Data Applications
      • Disaster Recovery
    • Data Sources
    • GIS and Remote Sensing Software
    • Online Learning Resources
    • Institutions
  • Risks & Disasters
    • Disaster Risk Management
    • Early Warning Systems
    • Emergency and Disaster Management
    • Natural Hazards
    • Sendai Framework
    • The UN and Disaster Risk Management
    • The UN and Early Warning
    • The UN and Disaster Management
  • Advisory Support
    • Advisory Missions
    • Emergency Support
    • Virtual Advisory Support
    • Recommended Practices
    • Training Activities
    • Practical Uses
  • Network
    • Regional Support Offices
    • GP-STAR
    • MHEWS
    • IWG-SEM
  • Projects
    • SPEAR
    • SEWS-D
    • EvIDENz
    • Flood GUIDE
  • News & Events
    • News
    • Events Calendar
    • UN-SPIDER Events Archive

Breadcrumb

  • Home
  • News and Events
  • View Active News
  • NASA Satellites Capture Effects of US Drought
  • NASA satellites capture effects of US drought

NASA satellites capture effects of US drought

US droughts 2012

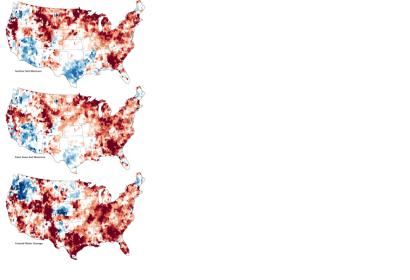
A deep and persistent drought struck vast portions of the continental United States in 2012. Though there has been some relief in the late summer, a pair of satellites operated by NASA shows that the drought lingers in the underground water supplies that are often tapped for drinking water and farming. The maps combine data from the twin satellites of the Gravity Recovery and Climate Experiment (GRACE) with ground-based measurements to map the relative amount of water stored near the surface and underground as of September 17, 2012. The top map shows moisture content in the top 2 centimeters (0.8 inches) of surface soil; the middle map depicts moisture in the “root zone,” or the top meter (39 inches) of soil; and the third map shows groundwater in aquifers.
NASA
Wed, 26 Sep 2012 - 08:37

Footer menu

  • Contact
  • Terms of Use

User account menu

  • Log in