
How are population and settlement data used in disaster risk reduction and response efforts?
Human population data is essential for disaster management efforts to assess how many people are potentially exposed to a hazard or reside within an already affected area. An exposure map shows this assessment. They are generated by merging geospatial population data with hazard related data and interpreting the overlaps. Information on the number/density of people exposed aids preparedness efforts in anticipation of a major event such as a hurricane, as high exposure areas can be prioritized for evacuation efforts in order to potentially save a significant number of lives. Exposure maps can also be used to investigate the likely impact caused by a natural hazard, as estimations can be made regarding the extent of the damage and casualties if population data and disaster magnitude are known.
While census data conveys how many people are living in an administrative unit, Earth Observation (EO) satellite data shows where people live and provides information about population dynamics. For exposure maps to be optimally useful, data sets need to be up-to-date, of high quality, and easily accessible. Satellite-based population data can contribute to monitor target 2 of the Sendai framework for Disaster Risk Reduction 2015-2030, i.e. to aim for "...a substantial reduction in numbers of affected people" with respect to disasters. In addition, population and settlement data can contribute to monitor some of the Sustainable Development Goals and targets, for example target 11.3: "By 2030, enhance inclusive and sustainable urbanization and capacity for participatory, integrated and sustainable human settlement planning and management in all countries."
Satellite-based population and settlement data provides useful information for exposure and risk mapping. It can also contribute to monitor some of the indicators of the Sendai Framework for Disaster Risk Reduction, as well as those related to the Sustainable Development Goals. A key advantage regarding satellite imagery is that it is monitored on a daily basis in contrast to census data, which is only updated every decade or less depending on funding or interest. Satellite imagery is capable of monitoring changes in population and settlement dynamics on a more frequent basis.
How are urban settlements mapped from space and how does satellite imagery contribute to the estimation of population data?
There are many ways to map the human population. An urban settlement map shows where people live and the dynamic of the built environment. Census data can be converted geospatially for a view of how many people actually live in a certain area.
A new data set called the Global Urban Footprint (GUF) has recently drawn attention. It is a global map of the location, size, and shape of the built environment now in an unprecedented spatial resolution of 0.4 arc seconds (~12m). It is the most detailed and consistent map of the built environment so far. The map encompasses both large urban conglomerates as well as dispersed small-scale built areas in rural regions. Its availability will be essential for a myriad of urban and disaster management initiatives.
The radar satellites TerraSAR-X and TanDEM-X are responsible for providing information for GUF data. The German Aerospace Center (DLR) launched these satellites in 2007 and 2010. Post-mission processing of the satellite imagery is what ultimately produced the GUF. Using Synthetic Aperture Radar (SAR), human settlement areas can be delineated because they show a characteristic small-scale heterogeneity of local wave backscatter. Essentially, settlements display double bounce effects and direct backscattering associated with certain structural or geometric features, particularly from vertical walls (buildings, bridges, traffic signs, etc.). SAR is advantageous for mapping buildings because it works on an all-weather basis. Moreover, the structural properties of urban settlements that produce unique backscatter are similar all over the globe because nearly an man-made structure shows vertical walls.
It is important to note that roads, parking lots, or airport runways are impervious man-made features that are not included in GUF because they do not have a vertical component. False positives were most common in rugged terrain: large rocks en masse, steep embankments, etc. False omission occurred when buildings were very close together or surrounded by high trees that caused the vertical walls to not be illuminated by the radar beam. These errors were fixed by including additional reference layers derived from multispectral satellite data; this leads to a corrected final GUF product (cf. Figure 1).

Figure 1: This is an example of a correction workflow for the final GUF product. The image on the top shows initial identification, the images in the middle show thematic reference layers, and the image on the bottom shows a final GUF map with false positives/omissions corrected. (https://arxiv.org/pdf/1706.04862.pdf).
It is also important to estimate how many people are residing in an area. Population census data is originally collected as detailed data at the household level, then spatially aggregated to the level of administrative units such as a municipal district (cf. top image of Figure 2). This means that each pixel within an administrative boundary is assigned the same population value, no matter where it is an urban area or a forest. It is obvious that this is not representative of real world population congregation. Therefore, to create a meaningful exposure map within an administrative boundary, it is necessary to disaggregate the census data. The disaggregation is possible using satellite imagery.

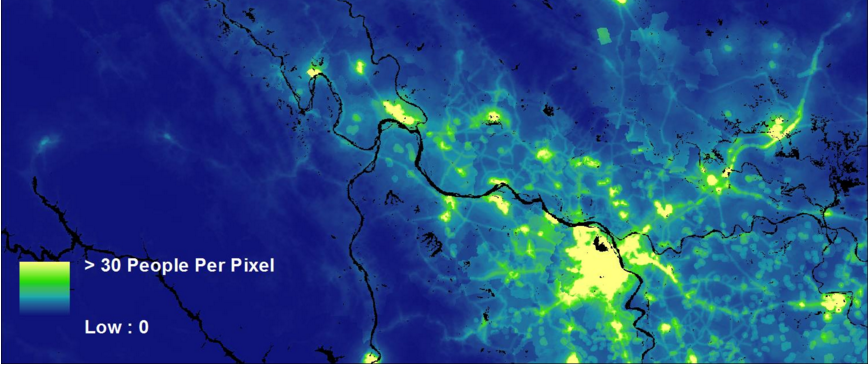
Figure 2: Census data that are aggregated by administrative unit (top image) can be spatially disaggregated with the help of satellite-based land cover map and satellite-based lights at night map. The bottom image shows the result of the random forest modelling approach by WorldPop. The maps are located in Northern Vietnam. (http://www.worldpop.org.uk/about_our_work/case_studies).
LandScan hosts the finest resolution of global population distribution data available at approximately 1 km resolution. The LandScan algorithm uses spatial data and a multi-variable dasymetric modeling approach to disaggragate census data within an administrative boundary. Based on the spatial data and the socioeconomic and cultural understanding of an area, cells are preferentially weighted for the possible occurrence of population during the day. Whithin each conutry, the population distribution model calculates a "likelihood" coefficient for each cell and applies the coefficients to the corresponding census data. The total population for any given area is then allocated proportionally to each cell. Since no single population distribution model can account for the differences in spatial data availability, quality, scale, and accuracy as well as the differences in cultural settlement practices, LandScan population distribution models are tailored to match the data conditions and geographical nature of each individual country and region.
Figure 3: LandScan population distribution dataset (http://web.ornl.gov/sci/landscan/index.shtml).
The above examples provide estimates on how many people are residing where. Using archived satellite imagery it is also possible to provide estimates regarding when people have resided where. Understanding and measuring settlement dynamics is important to update exposure and risk maps, especially when urban fringes with vulnerable peoples expand into hazard-prone areas.
An innovative approach to map population dynamics even during day and night can be carried out through the use of mobile phone data as shown in the video below. For this approach, a dense network of cell towers is necessary, i.e. the approach is not applicable in all regions of the world. Even though this is not a space-based application, we include this approach here since it is showing what is possible to monitor this extremely important data.
Video 1: Dynamic population mapping using mobile phone data. For more information read the paper by Deville et al. (2014).
How can I access population and settlement data?
There are several datasets based on remote sensing that can be used to assess population. Below are links to population estimates, urban extent, urban land use, human settlement layers, socioeconomic data, and urban hazards.
Population Data
- The Global Urban Footprint (DLR)
- Gridded Population of the World (NASA)
- LandScan Global Population Distribution Dataset (ORNL)
- WorldPop
- Socioeconomic Data and Applications (NASA)
- Data Discovery Portal (WASCAL)
- Cartographic Section of the United Nations
- Urban Atlas (EEA)
- Global Human Settlement Layer (GHSL-JRC)
How are the datasets used for disaster risk management and emergency response?
An operational example of using satellite-based population data for emergency response can be found in the Copernicus Emergency Mapping Service (EMS). The Copernicus EMS portfolio for rapid mapping includes reference maps and delineation maps. Reference maps provide a quick updated information on the territory and existing assets using data collected before the disaster. By combining the reference information with population data, Copernicus provides an estimate of people exposed within the area of interest (AOI). Exposure is an integral part of any disaster risk profile. Delineation maps provide an assessment of the geographical extent of the disaster event. Combining the geographical extent polygon with population data, Copernicus estimates the number of people affected.
This was put into practice during the floods in Malawi in January 2015. Heavy rains during several weeks lead to severe flooding across the country. The floods caused the displacement of thousands of people, extensive damage to crops, livestock, and infrastructure. Some areas were inaccessible, impeding on the ground conduction of assessments regarding damages and losses. Copernicus EMS was activated by the European Commission's Humanitarian and Civil Protection Department on 25 January 2015 (activation website). The first reference delineation maps were published (cf. Figure 4), giving a more precise estimate of the number of people affected within the flooded area (cf. Table 2).
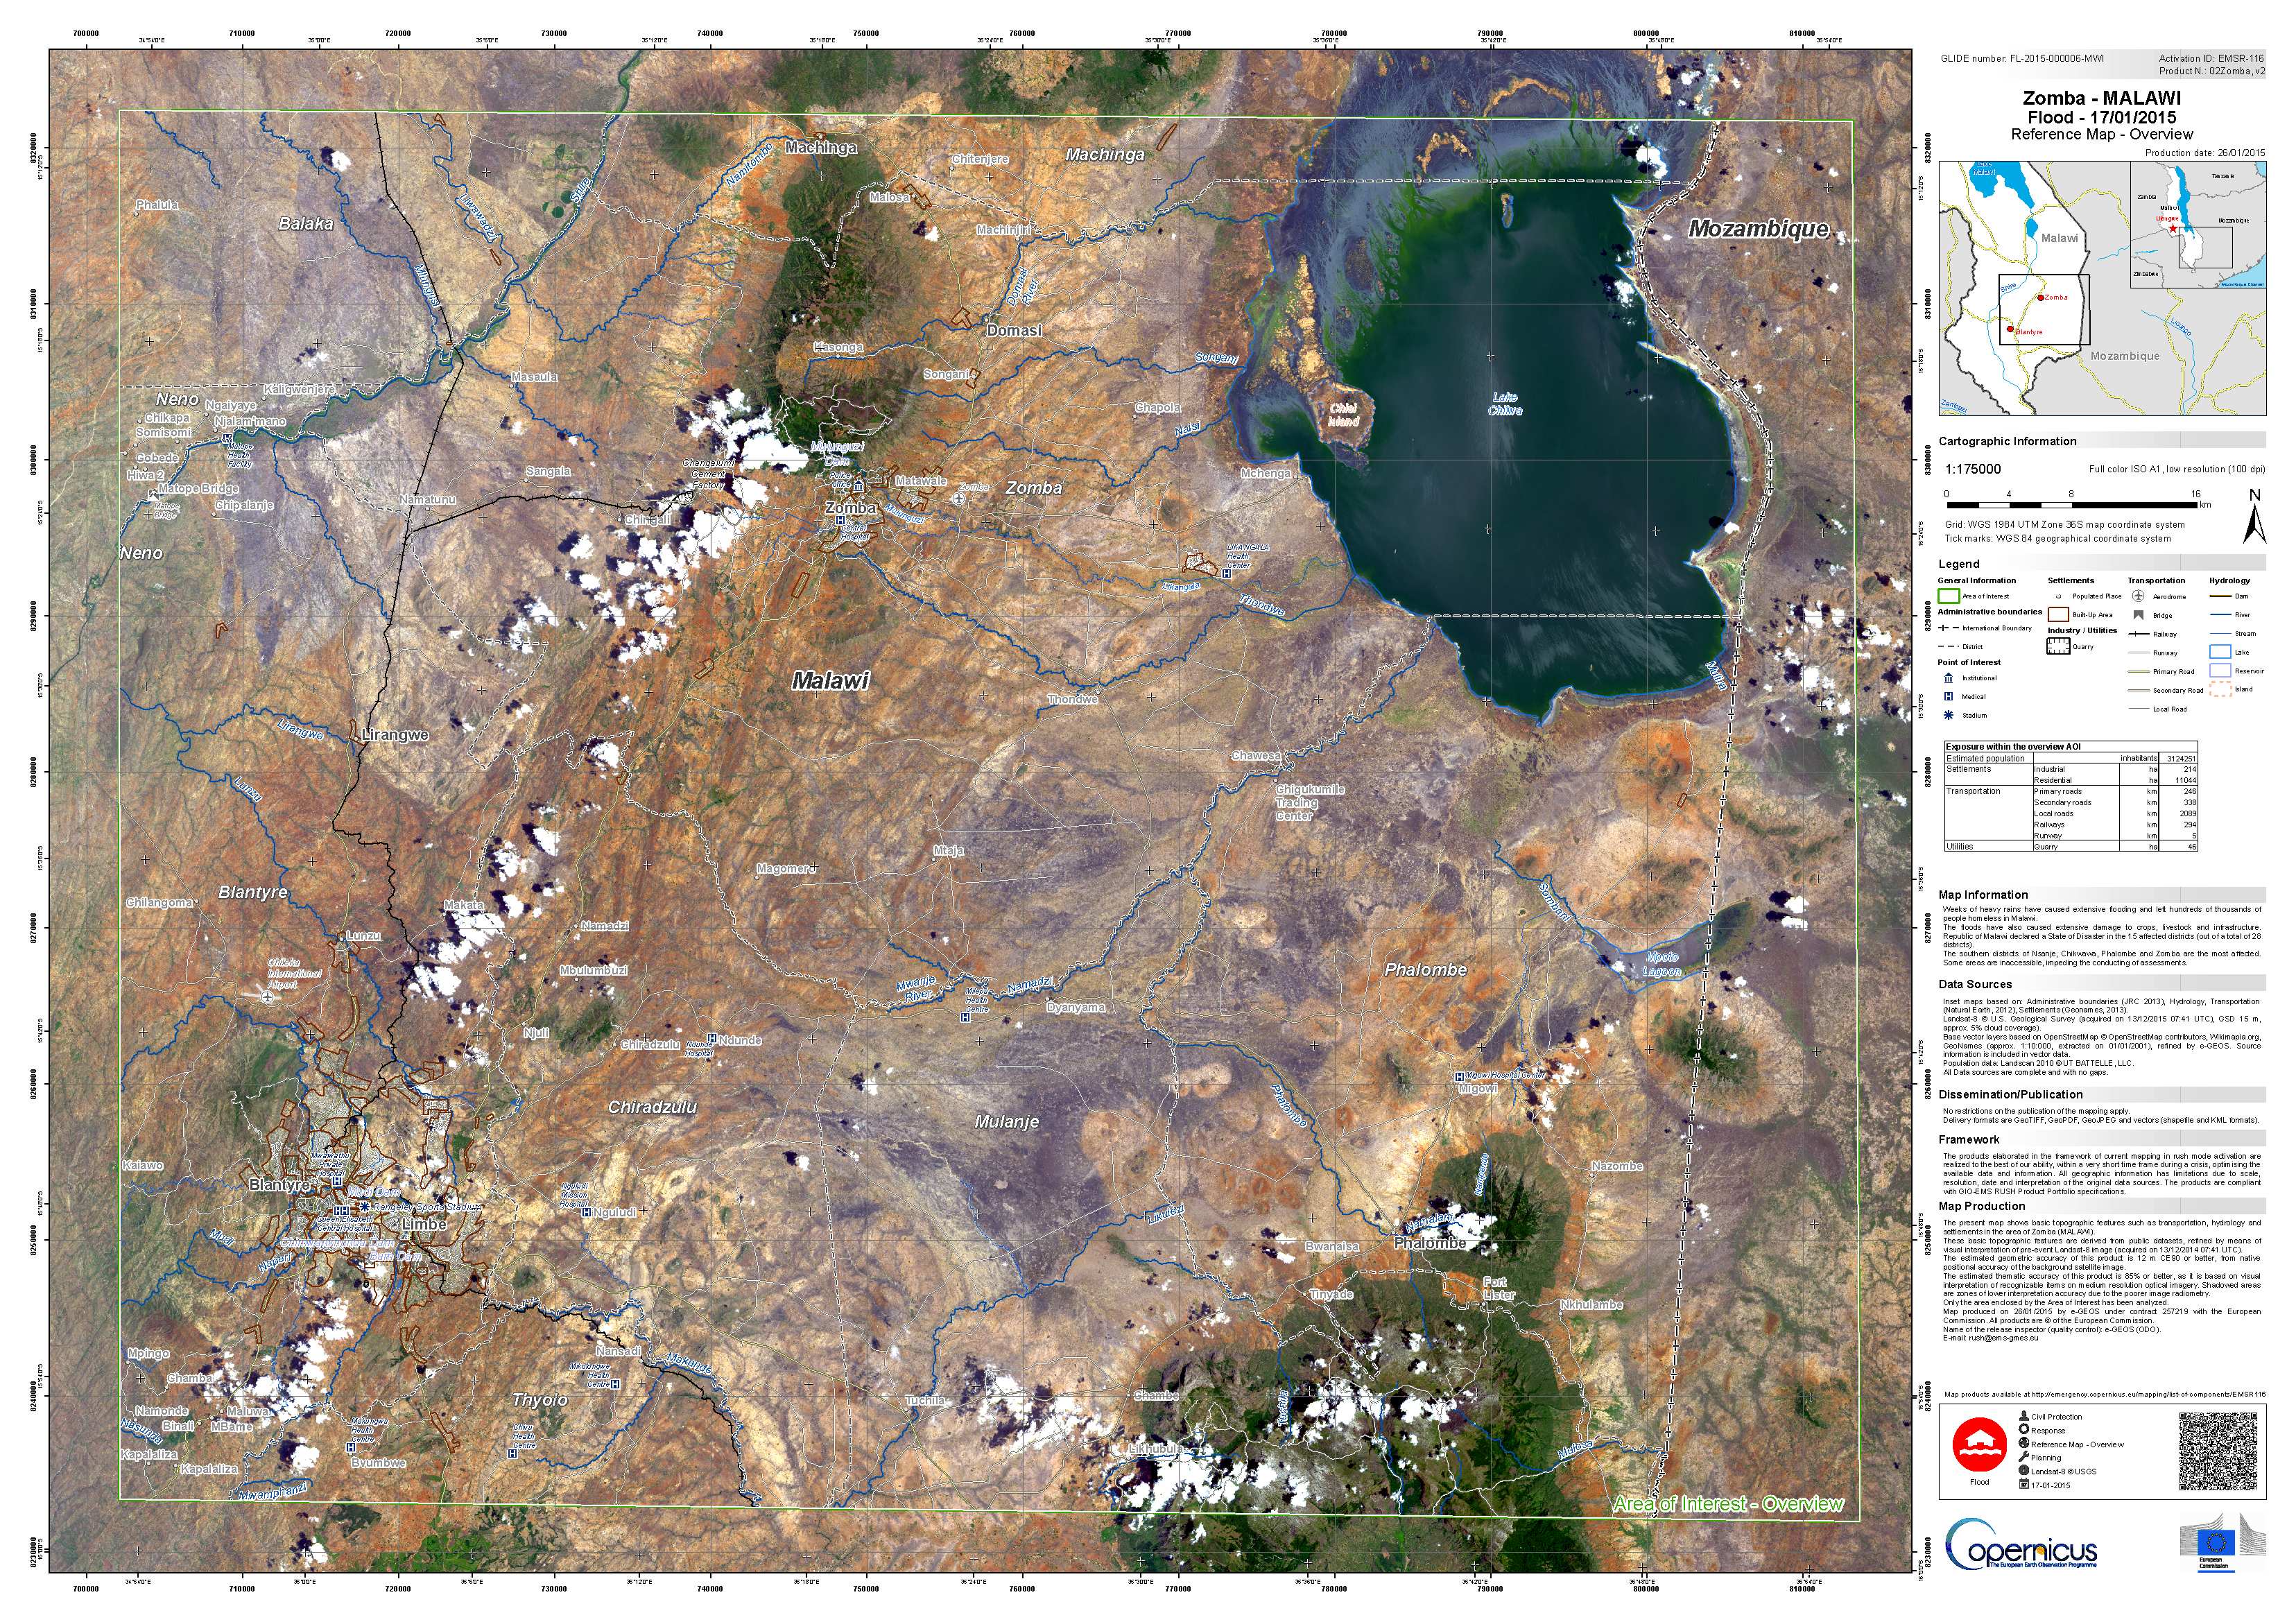
Figure 4: Reference map. (Source: Copernicus)
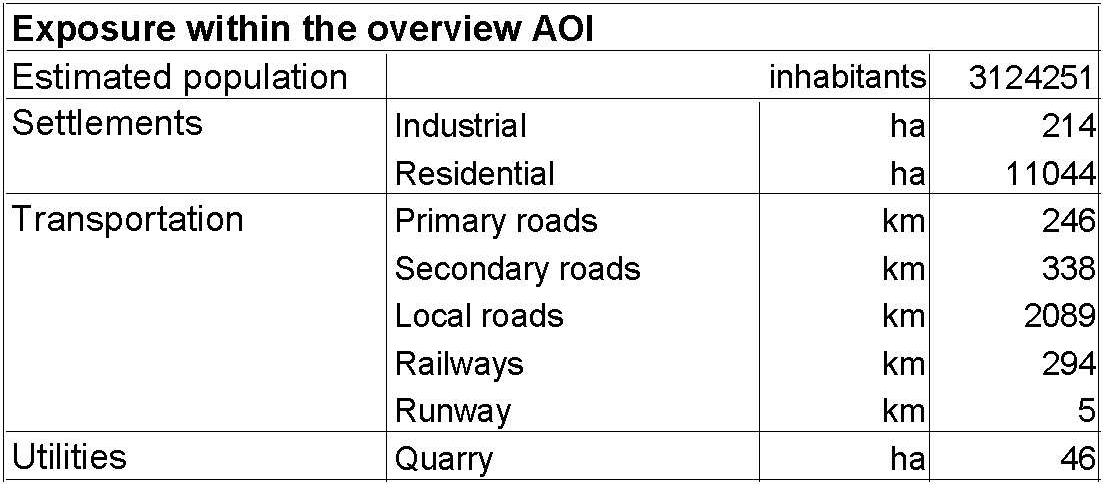
Table 1: Exposure table of reference map (zoom). The estimated number of exposed population within the area of interest (AOI) is estimated using Landscan data. (Source: Copernicus)
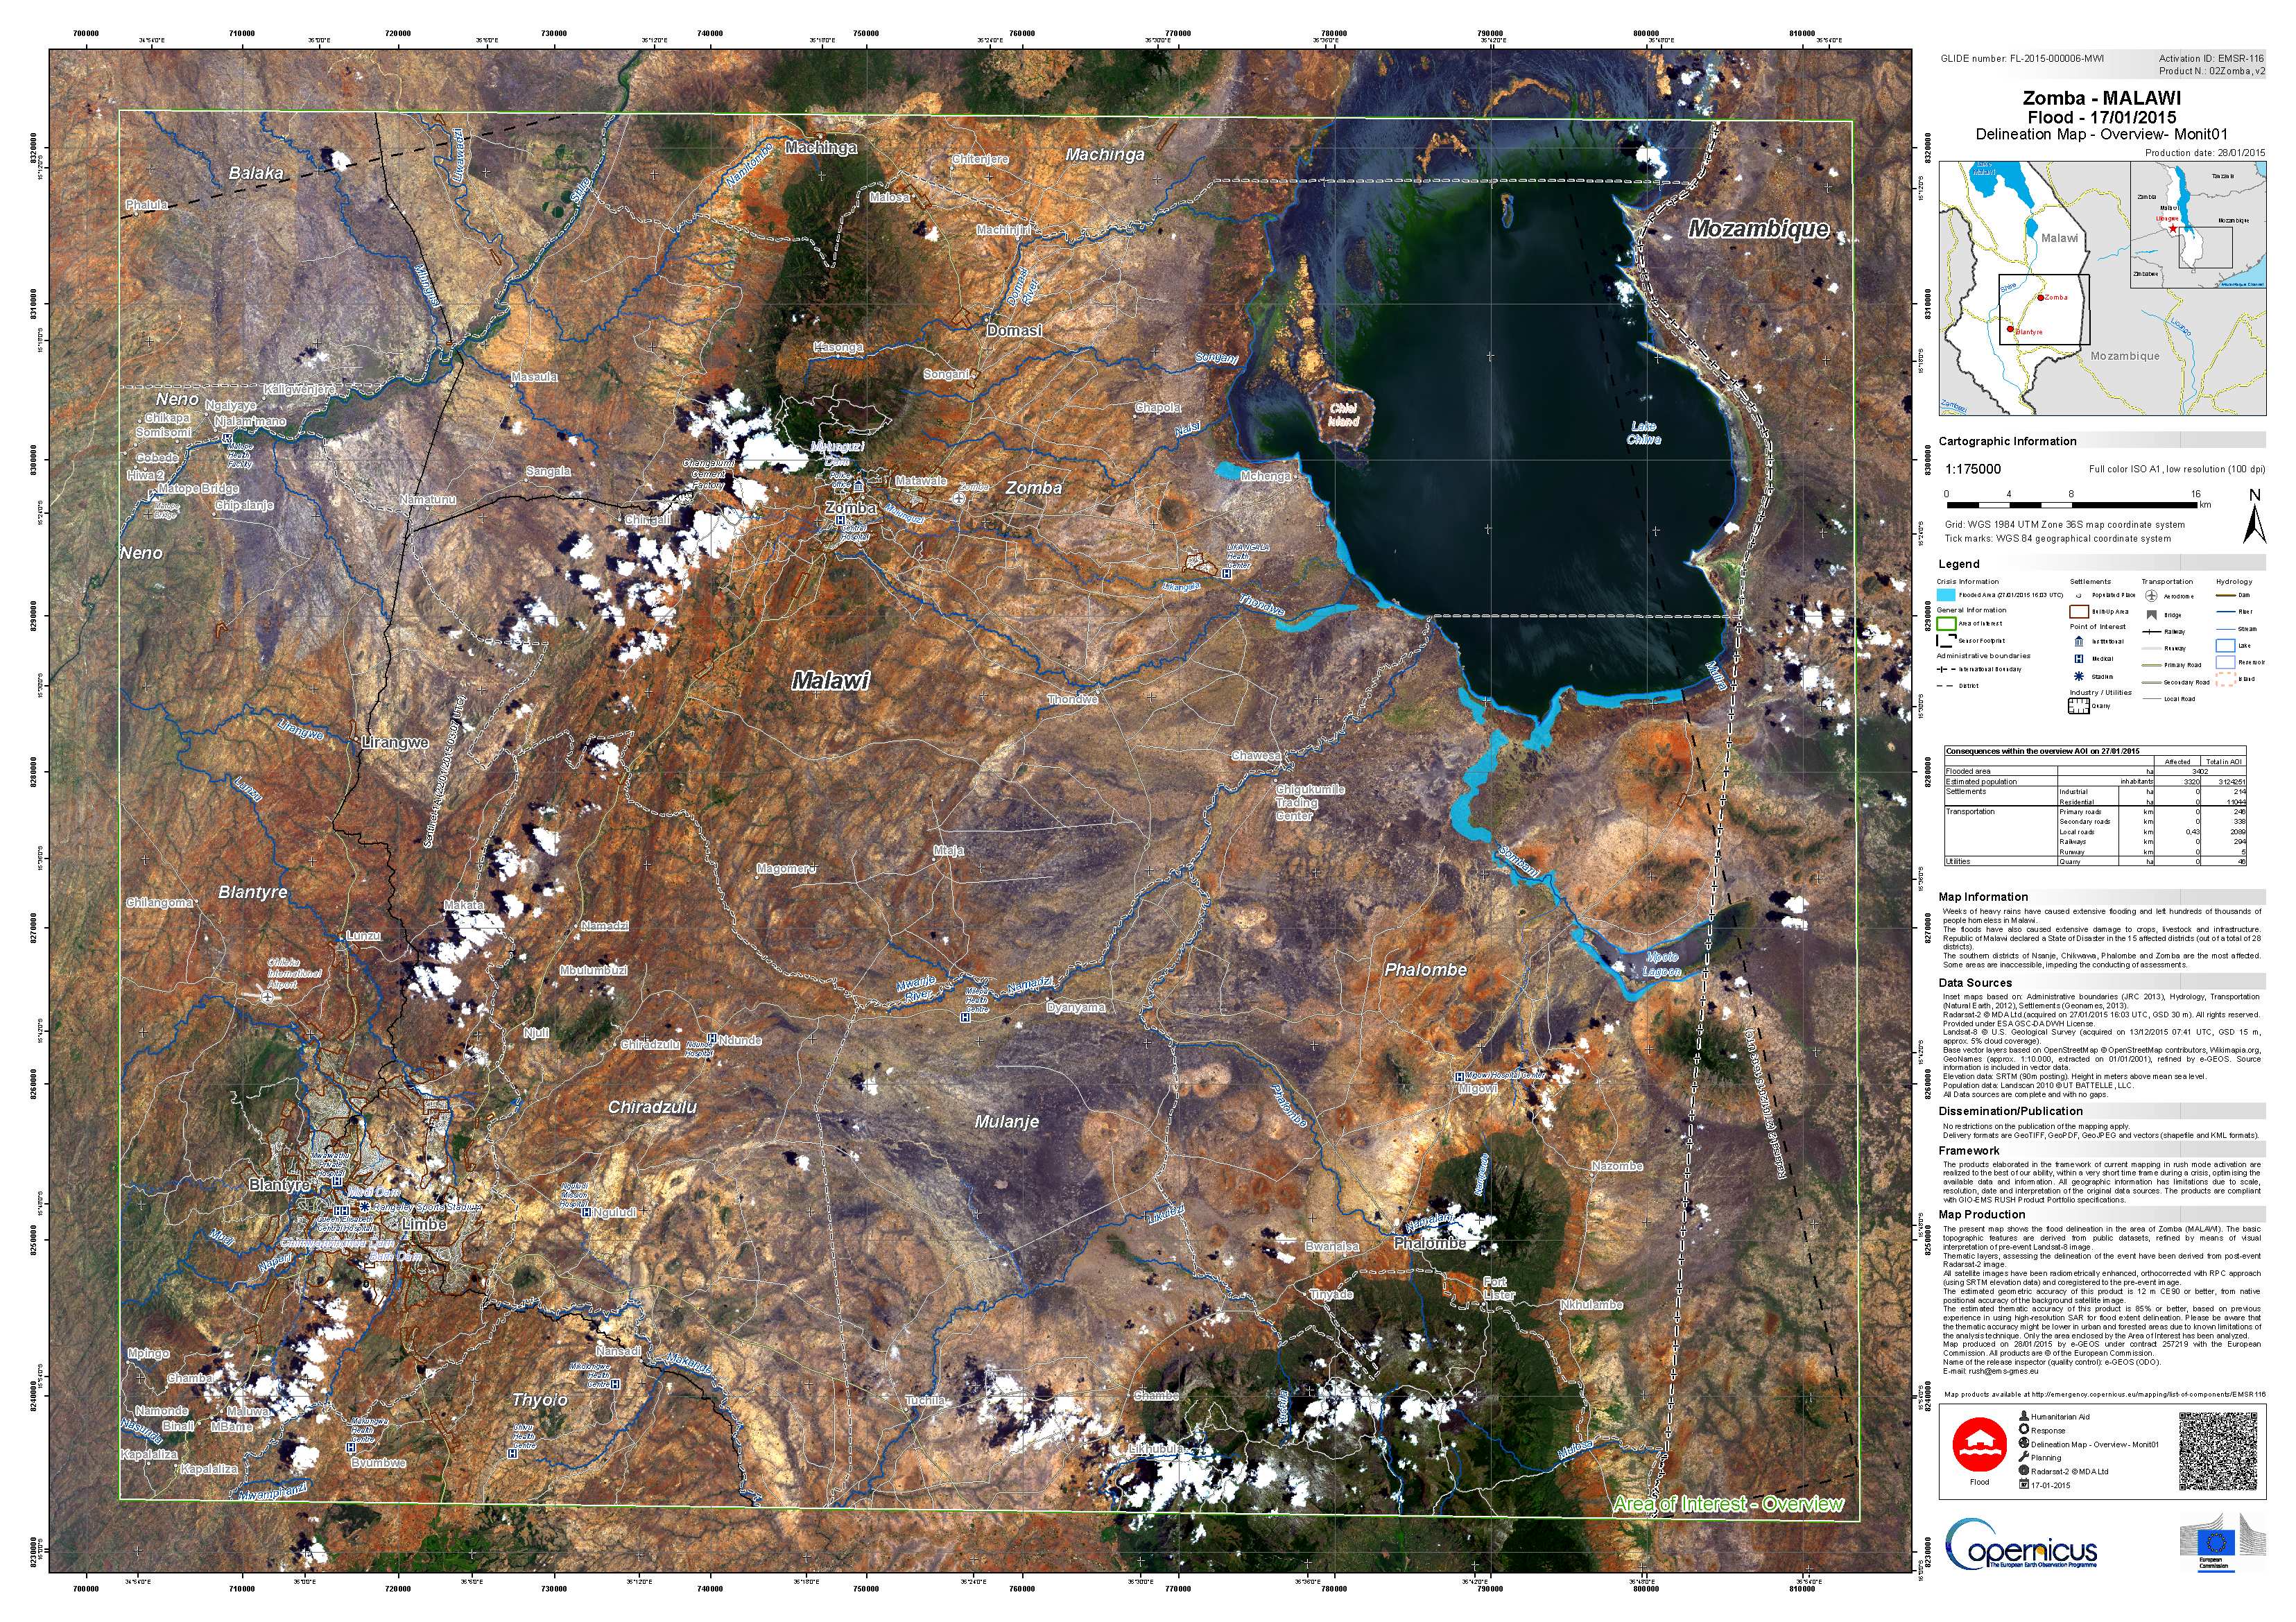
Figure 5: Delineation map. (Source: Copernicus)
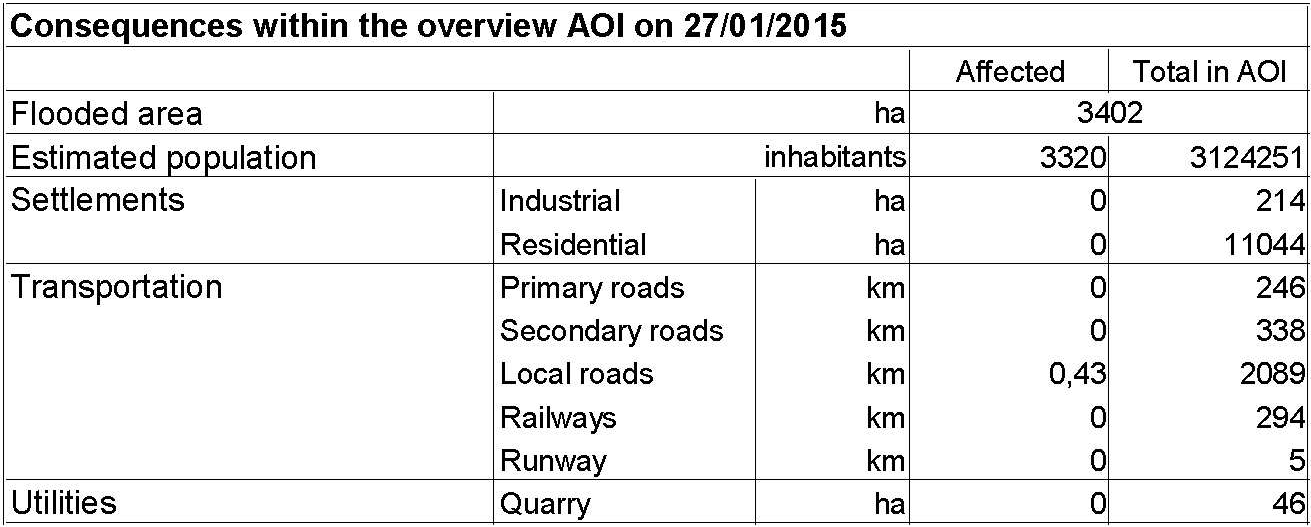
Table 2: Affected population, settlements, and road infrastructure. The estimate of the number of affected population within the flooded area is based on Landscan data. (Source: Copernicus)