Olaf Neussner, Chief Advisor for Disaster Risk Management, German Technical Cooperation (GTZ), Philippines
Katharina Wilkin, cand. Dipl. Ing., Technical University Dortmund, Faculty of Spatial Planning
Introduction and background
Due to its geographic location the Philippines is highly prone to the occurrence of natural hazard events, such as earthquakes, volcanic eruptions, tropical cyclones and floods, making it one of the most disaster prone countries in the world. 2009 demonstrated this again with consecutive tropical cyclones hitting the country and causing almost a thousand casualties as well as economic damage estimated to about 2.7 percent of the GDP (1).
An average of one person in 100,000 inhabitants dies from natural disaster per year (2). Next to the loss of human life, the frequently occurring damages are an enormous burden to the country’s economy. On average, the costs of disasters are annually as much as approximately 0.5% of the GDP (3). Disasters do not only obstruct development efforts and industrial growth but have severe effects especially on the livelihood of vulnerable rural communities that have to face these hazards on a regular basis.
Global warming and the resulting climate change will particularly affect the Philippines, especially with regard to weather induced disasters. There are indications that rain patterns are changing and are becoming more irregular. This would increase the occurrence of droughts and floods. In addition, the predicted rise of sea level will increase wave action induced erosion and damages to coastal habitats and settlements.
The exposure to hazards alone does not necessarily result in severe disasters. It depends on the vulnerability of communities and assets. The vulnerability is to a large extent determined by the stage of development of a society. For example, a typhoon of the same strength would have a 17 times stronger impact on the Philippines than on Japan (2). The combination of an insufficient prepared country and high exposure results in disasters with an avoidable high death toll and significant losses of assets affecting the development of the country.
Vulnerabilities are specific to hazards. A rice field may be very vulnerable to floods but not to an earthquake while a building can collapse under the forces of an earthquake ground shaking but withstand a flood with only very minor damages. Therefore, typical assets or land uses have to be assessed locally and their vulnerability to likely hazards determined in order to adapt the land uses to the existing hazards.
Most important for such assessments is the knowledge of regional/local disaster risks, in particular the exposure to hazards and the conditions of vulnerability. Both need to be examined to arrive at reliable information suitable for decision making. Resources for such assessments, particularly for ground surveys in remote areas, are limited. Hence, space-based technologies are gaining ground to close these information gaps.
Given the above mentioned needs and available technological means, German Technical Cooperation (GTZ) used satellite-based land use maps to produce natural disaster risk maps in Leyte Island, Philippines. In the following, the different steps in developing these maps are explained in more detail.
Vulnerability assessment
Land use map as basis for the assessment
The determination of vulnerabilities requires detailed knowledge of land use. Therefore a land use map had to be produced (Fig. 1). GTZ acquired satellite images with high resolution. Since one part of Leyte Island could not be covered a lower resolution image had to be utilized.
Preprocessing involved georeferencing to correct the spatial reference of the satellite images (SPOT 5 Level 2A, ASTER Level 1B, and LANDSAT ETM+). The process involved a one-by-one registration with the acquired satellite images. The registration was done in ENVI 4.2 with the 2nd degree polynomial nearest neighbor method.
As a next step, the raw data format was loaded (for SPOT the DIMAP, for ASTER the HDF, and for LANDSAT the GeoTiff). ASTER Images were first oriented to the North before the image-to-image registration could take place. Bands number 1, 2, and 3N were used as these bands comprise the Visible and Near Infrared (VNIR) bands and are also equivalent to the SPOT bands.
LANDSAT Images were first loaded as different bands and were later stacked. Bands 1 to 5 were used since these have the same spatial resolution (30 meters). Then an image-to-image registration was done.
Clearly visible Ground Control Points (GCP) were employed during the registration. With image-to-image registration, visible structures on both of the images were examined and were used as GCPs. The Root Mean Square (RMS) error was kept to 0.8 for all images. All satellite images were saved to an ENVI native file and also as a GeoTiff file.
Before the actual classification, the sea, settlement areas, fishponds, roads, clouds and shadows, and rivers were manually masked as these are easily distinguishable on the images. A mask was created specifically for each image. The mask was saved in ENVI native file format to be used later in the classification.
Images were loaded to ENVI and training areas were identified using the ROI (Regions of Interest) tool. At least 20 polygons of training and test areas were selected per class per image to obtain a result in an acceptable error frame.
GPS ground truthing data were also loaded as vector files to facilitate recognition of land cover in a certain area. Two sets of ROIs were prepared: one for the training set and one for the test set for the later classification accuracy testing. Statistics were calculated in the process of choosing ROIs in order to note the number of pixels per class over the different image bands. A minimum of 20 polygons per class was made for each training and test ROIs. ROI separability was also made to assess the separability of each class; a value of 1.8 to 2.0 per class denoted that each class is properly separated (with minor exceptions) from each other.
A supervised classification with the maximum likelihood method was used, and the pre-processed mask per image was applied as a mask band in the classification process. The Land cover classification and definitions used were derived from the Philippines National Forest Inventory Manual (4).
The classes were converted to vector files and further processed with ArcGIS and Manifold 8.0.
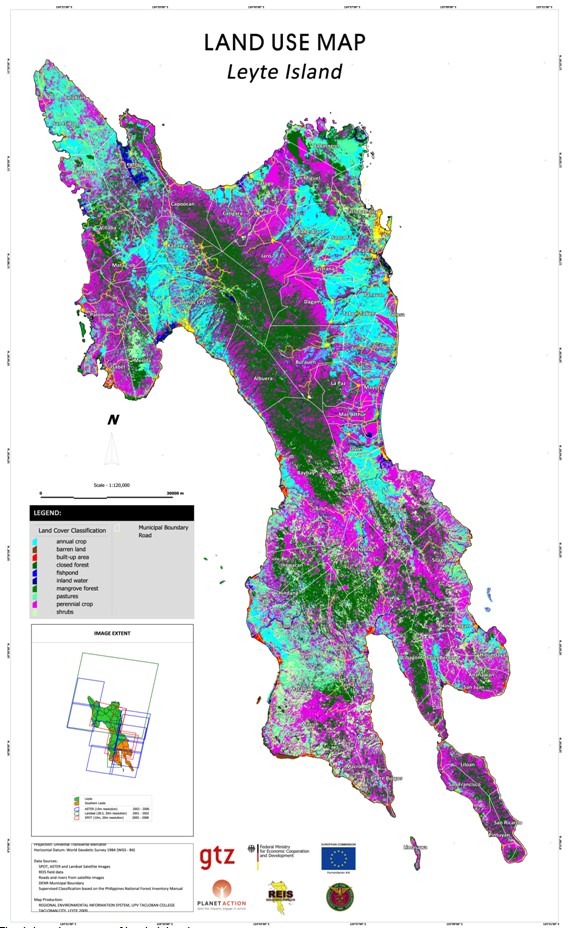
Fig. 1: Land use map of Leyte Island
In order to demonstrate further steps a small area in Leyte Island was selected. It covers part of the city of Tacloban and the municipality of Palo. For better orientation roads and rivers are included.
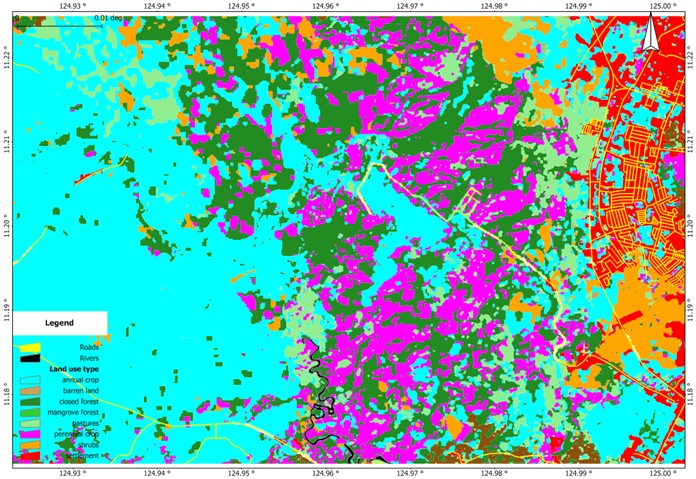
Fig. 2: Land use map of Tacloban City and the municipality of Palo, Leyte Island
Vulnerabilities
According to ISDR, vulnerability is defined as “the characteristics and circumstances of a community, system or asset that make it susceptible to the damaging effects of a hazard” (5). Usually the direct physical susceptibility to the impact of a hazard event is distinguished from secondary effects, which might be social, economic or environmental factors. In this paper only the direct physical vulnerability is addressed.
Vulnerabilities are specific to type and strength of hazards and the characteristics of the exposed assets. This is described in vulnerability curves displaying a function of damage and increasing strength of the hazard. With a few exceptions no vulnerability curves exist on a local level in the Philippines. The authors relied on interviews with local experts, mostly from government institutions in Leyte Island, to collect data on vulnerabilities. Table 1 shows an example of the impact of typical local floods on wooden buildings in Leyte.
| Flood Damage in % | Flood characteristics | Impact inside buildings | Impact on buildings |
|---|---|---|---|
| 5 (very low) | 0.3m, 4hours, very little current | People had to move objects to higher elevation, mop and clean. | No damage, wall paint deteriorated. |
| 5-10 (low) | 1m, 2-4days, slow current | Minor losses, particularly kitchen cupboards, clothes, shoes and mattresses. Mop and clean. | No structural damage, wall plaster may need repair and painting. Wooden frames need to be treated. |
| 10-50 (moderate) | 2m, 5days, medium current | Almost total loss of the furnishings, esp. furniture equipment, kitchen cupboard, etc. People had to remove dirt and mud from inside. | Considerable structural damage to wooden doors and frames, plaster and painted walls. |
| 50-80 (high) | 3m, 7 days, strong current | Total loss of furnishings. | Partial destruction of foundation, wall and doors. |
| 80-100 (very high) | not experienced | Total loss of furnishings. | Total destruction of the dwelling. |
Table 1: Vulnerability of Wooden Buildings to Floods
The same type of data were collected for major land use forms, but some were regarded to be almost not susceptible to natural hazards (pastures, barren land and to a lesser degree bushes). Vulnerability includes both factors, the replacement costs as well as the susceptibility of the particular land use form.
In a second step the economic value of different forms of land use was gathered from local experts. The current replacement costs (Table 2) are taken as a basis for further calculations. They are expressed in Philippine Pesos (1 US$ approximately 43 Philippine Pesos).
| Land use | Replacement cost per hectare in Philippine Pesos |
|---|---|
| Annual crops | |
| Rice | 30,000-40,000 |
| Corn | 18,000-24,000 |
| Perennial crops | |
| Coconut | 27,000 |
| Banana | 36,300 |
| Natural sites | |
| Mangroves | 15,700 |
| Closed forest | 51,200 |
| Settlements | |
| High quality houses | 9,900,000 |
| Low quality houses | 3,850,000 |
Table 2: Replacement costs
Different crops within a land use class were weighed according to their percentage in agricultural areas (data from the Department of Agriculture). Different housing quality was weighed according to municipal statistics of the distribution of houses. The basis for the value of houses was floor area. As only 11% of settlements are actually buildings in Leyte (based on a sample from Palo, Leyte) the replacement costs per hectare were adjusted accordingly. Figure 3 shows an example of a small area of Leyte.
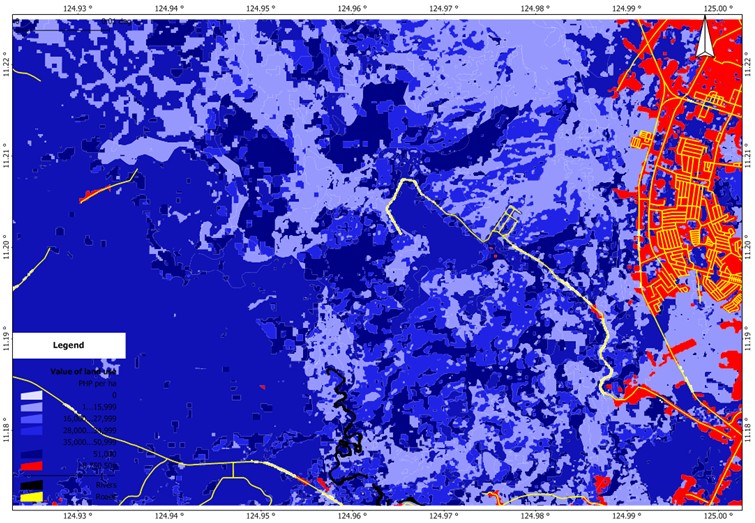
Fig. 3: Map of land value (replacement cost of land use)
The physical vulnerability of different forms of land use to a hazard (here floods) are displayed in Fig 4. Rice paddies are the most vulnerable form of land use because a whole harvest may be lost due to the flood. It may be noteworthy that the map illustrates that vulnerabilities are not limited to hazard-prone areas.
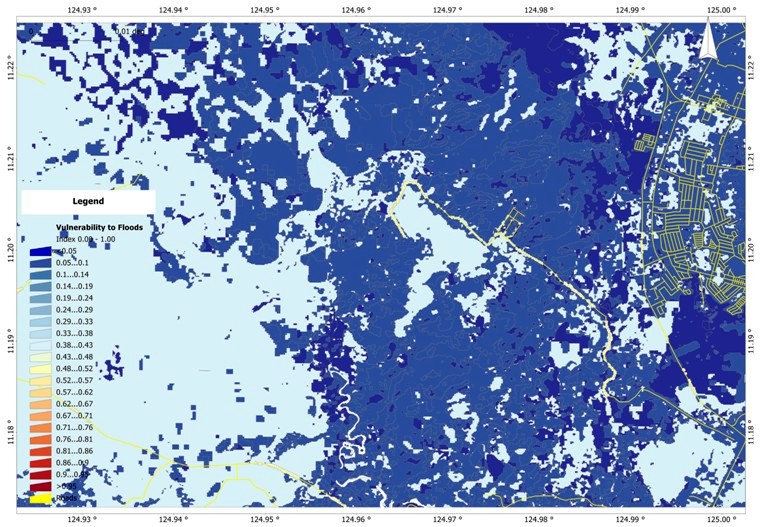
Fig. 4: Map of vulnerability to landslide
Hazard assessment
Determining vulnerabilities alone is of little value without considering the hazards threatening an area. ISDR defines a hazard as “a dangerous phenomenon, substance, human activity or condition that may cause loss of life, injury or other health impacts, property damage, loss of livelihoods and services, social and economic disruption, or environmental damage” (5). Natural hazards are characterized by three features: spatial distribution, strength or magnitude, and probability of occurrence.
For Leyte Island different sources and qualities of information are available for the different hazards. Typhoon hazards are described in terms of affected area, severity and probability by the reinsurance company Munich Re (6). Floods, liquefaction from earthquakes, and storm surges are described only regarding their spatial distribution (susceptibility) by the Mines and Geoscience Bureau (MGB) and the Philippine Institute of Volcanology and Seismology (PHIVOLCS) of the Philippine Government. MGB and PHIVOLCS describe other hazards (rain-induced and earthquake-induced landslides, ground shaking from earthquakes) with three different classes of susceptibility (high, medium, low) apart from the potentially affected area and in the tsunami hazard map some maximum wave heights are indicated.
The available data rarely cover strength and probability. Therefore local investigations had to be conducted. It appeared to be difficult and cumbersome to gather reliable data on strength and probability. Further research will refine initial findings.
For the Tacloban/Palo area in Leyte a return period of 1.2 per year was derived from interviews with a maximum height of 1m and a duration of 2-4 days (Figure 5).
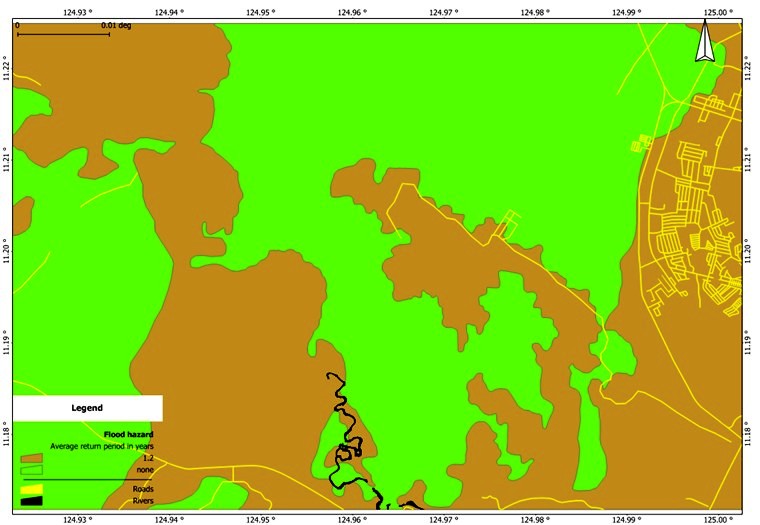
Fig. 5: Map of flood hazard for a flood with a maximum height of 1m and duration of 2-4 days
Landslides proofed to be more difficult to quantify in terms of probability. MGB estimates approximately 30% of Leyte Island as highly susceptible to rain-induced landslides (RIL), while approximately 20% are categorized as moderate and low susceptible respectively. This equals 2,200km2 for high, 1,400km2 for moderate and 1,400km2 for low susceptible areas. Landslides are not recorded systematically on the Island. A derivation from known landslides suggests that 0.8km2 of highly susceptible area are moving as landslides every year. This means a return period of 2.25 years.
The National Economic Development Authority (NEDA) describes the probability of the moderate RIL susceptible area as one fifth of the highly susceptible area and the low susceptible area as one quarter of the moderate area (3). This results in 11.25 and 45 years, respectively, as a return period for RIL in moderate and low susceptible areas (Figure 6).
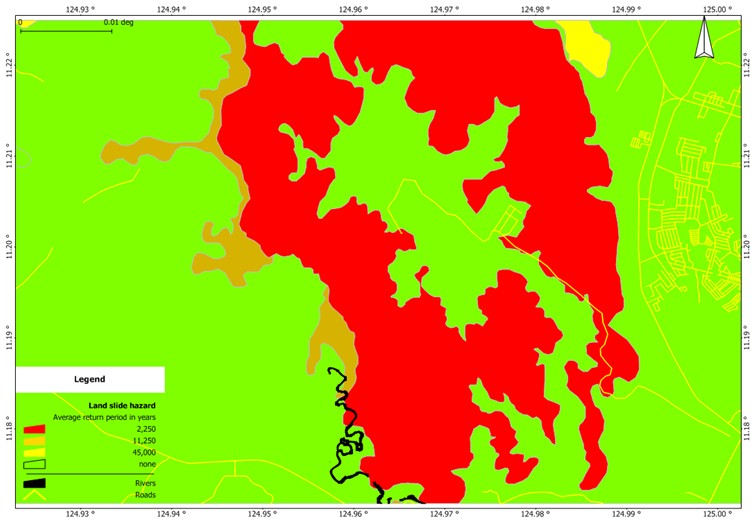
Fig. 6: Map of rain-induced landslide hazard
There are relatively small overlaps of the two hazard areas, which is to be expected because landslides happen on steep slopes while floods occur in plains.
Risk assessment
Risk is defined as “the combination of the probability of an event and its negative consequences” (5). It is calculated by multiplying the vulnerability of an exposed element with the probability of a hazard of a certain severity. In order to get an encompassing risk assessment, different categories of a hazard (different severities and responding probabilities) have to be compiled to arrive at the total risk of a particular hazard. Risks of different hazard types have to be calculated one by one and then added to arrive at a total risk estimate of all hazards.
Figure 7 shows the expected average damage per hectare and year caused by rain-induced landslides. As the return period for low susceptible areas is assumed to be 45 years, the resulting cost per year is very low and only significant for settlements because of their high value per hectare.
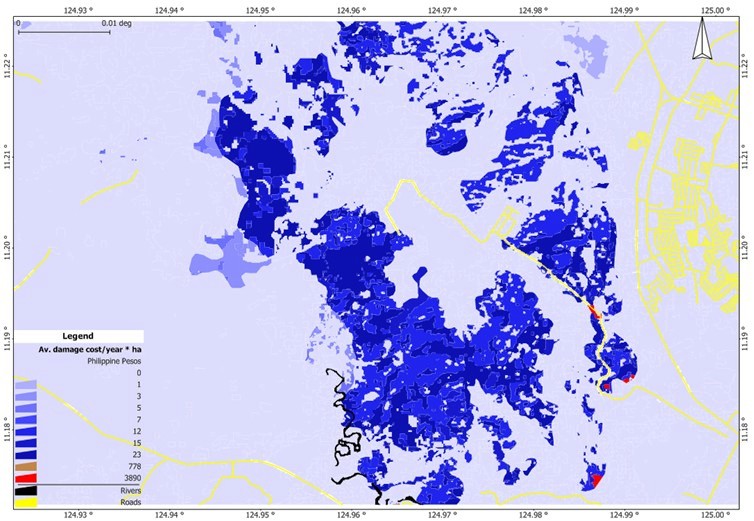
Fig. 7: Map of expected average damage per hectare and year caused by rain-induced landslides
The same kind of calculations was used for other hazards (floods, wind/storm, and earthquake). Adding these four risks (damages in Pesos/year/ha) resulted in a multi-hazard map (Fig. 8). The map shows that a considerable part of the area has no risk of financially significant damages because there is either no hazard or the value of the land use is negligible. The high calculated costs of damage in the flood-prone settlement area do not necessarily mean that this amount of money has to be raised every year. For example, many inhabitants who experience floods do not repaint walls after they were affected by flood waters and damaged furniture might lose value but can still be used.
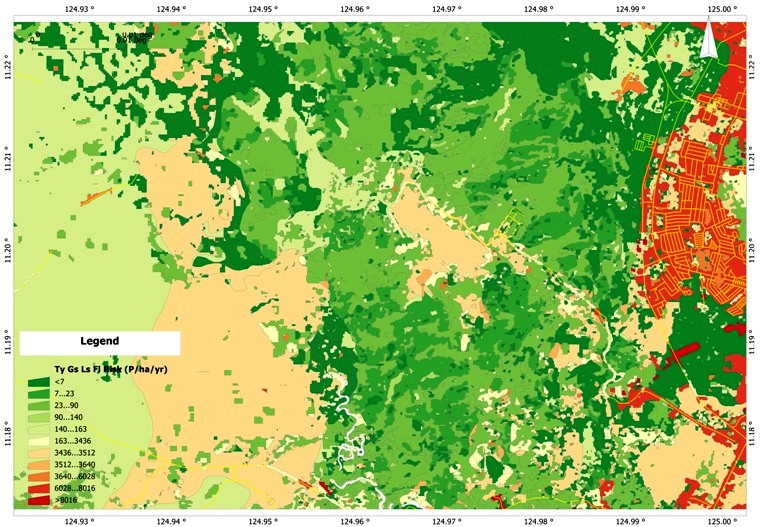
Fig. 8: Map of expected average damage per hectare and year caused by rain-induced landslides, ground shaking, wind/storm and floods
Conclusions
Land use maps with a spatial resolution of 5-15m are sufficient for a province level assessment of natural hazard risks and in the absence of good alternatives they also provide valuable information on municipal level, although not sufficient for planning as 1:10,000 is the desired scale.
Using medium resolution satellite imagery for the production of land use maps appears to be the most efficient way of solving this task. Aerial photography and ground surveys are too expensive and/or labor intensive for large rural areas. Limiting factors in the case of Leyte in the Philippines are the availability of archive images with a low cloud cover and the expertise and time needed to convert images into useful vector information.
Information from different sources on vulnerabilities are still quite incomplete and probably in some cases subjective overestimations of hazard impacts. A more systematic compilation leading towards vulnerability curves for common hazards is needed in order to arrive at more precise vulnerability estimations.
Similarly hazard maps and data on severity and probability appear to need verification.
Although the limitations in hazard and vulnerability assessments are reflected in the risk assessment the risk maps are a significant step forward for local governments in Leyte, because for the first time they are provided with quantitative natural hazard risk maps. These maps serve as a basis for the identification of current high risk areas needing priority interventions like structural protection or adaptation measures. The maps also enable the local governments to estimate the risk in potential development areas in order to avoid dangerous places and promote safer areas.
Acknowledgement
Financial support was granted from the Commission of the European Union under the DIPECHO programme and the German Federal Ministry for Economic Cooperation and Development, and the German Academic Exchange Service (DAAD). Planet Action provided SPOT images.
References
- Republic of the Philippines (RP) & Global Facility for Disaster Reduction and Recovery (GFDRR), (2009), Typhoons Ondoy and Pepeng: Post-Disaster Needs Assessment, Manila, p. 2.
- International Strategy for Disaster Reduction, ISDR, (2009), Global Assessment Report on Disaster Risk Reduction. United Nations, Geneva, Switzerland, pp.7, 50.
- National Economic and Development Authority, NEDA, (2009), Mainstreaming Disaster Risk Reduction in Subnational Development and Land Use/Physical Planning in the Philippines, Manila, pp. 20, 275.
- Branthomme, A.; Saket, M.; Altrell, D.; Vuorinen, A.P., National Forest Inventory, Philippines, Field Manual, (2002), FAO, Forestry Department.
- International Strategy for Disaster Reduction, ISDR, (2009), UNISDR Terminology on Disaster Risk Reduction, Geneva, pp. 7, 11, 12.
- Munich Reinsurance Company, Geo Risks Research Department, Munich Re, (2008), Natural Hazards Assessment Network, http://mrnathan.munichre.com/, accessed 2008.