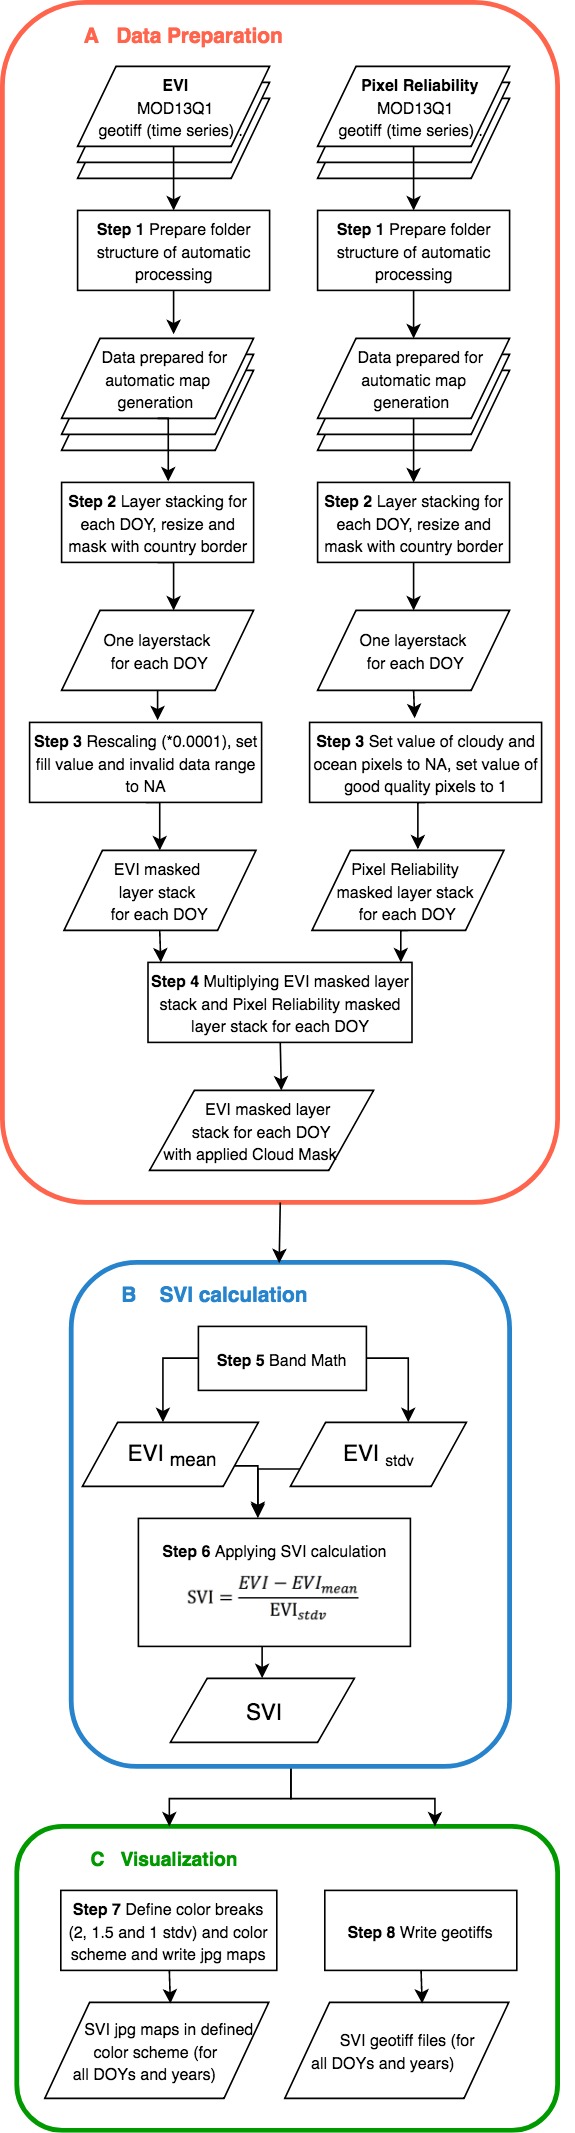
Spectral vegetation indices are among the most commonly used satellite data products for evaluation, monitoring, and measurement of vegetation cover, condition, biophysical processes, and changes. This recommended practice shows how to apply a multi-temporal analysis of MODIS-based Standard Vegetation Index (SVI) to support drought monitoring and early warning. The method was developed by UFSM in Brazil in cooperation with UN-SPIDER within the SEWS-D project. It has been applied in different countries in the Central American Dry Corridor and in the Dominican Republic in the Caribbean. For more information on the SEWS-D project see the dedicated webpage (SEWS-D project).
The practice on drought monitoring and early warning has been adapted to the programming languages R and Python and gradually updated, for example by including a cloud mask, which has not been considered before. Also, an additional R script is provided to be able to compute the SVI for large areas (>200.000km2).
For related information and drought definitions see the related recommended practice on drought monitoring using the Vegetation Condition Index developed by the Iranian Space Agency in cooperation with UN-SPIDER.
Definition of the SVI
Originally building on the NDVI anomaly concept, the Standardized Vegetation Index (SVI) developed by Peters et al. (2002) describes the probability of variation from the normal NDVI over multiple years of data (e.g., 12 years), on a weekly time step. The SVI is a z-score deviation from the mean in units of the standard deviation, calculated from the NDVI or EVI values for each pixel location of a composite period for each year during a given reference period. The equation below shows the general calculation of the SVI
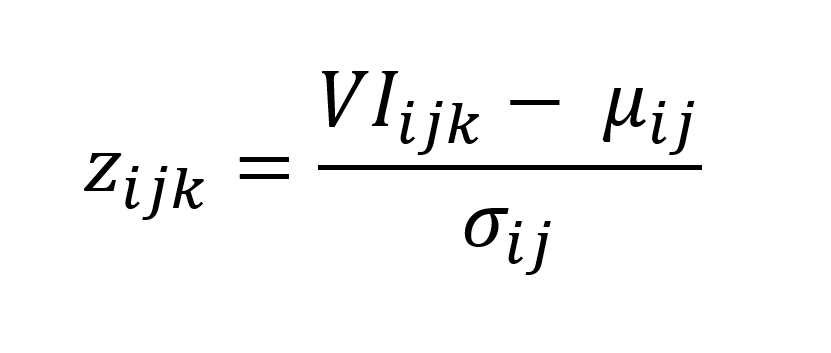
where zijk is the z-value for the pixel i during week j for year k, VIij is the weekly VI value for pixel i during week j for year k whereby both the NDVI or EVI can be utilized as VI, µij is the mean for pixel i during week j over n years, and σij is the standard deviation of pixel i during week j over n years.
This recommended practice calculates the SVI based on the Enhanced Vegetation Index (EVI) which has some advantages compared to the NDVI such as an improved sensitivity over dense vegetation conditions and is less affected by aerosol influences.
More detailed information on the Standardized Vegetation Index can be found here.
SVI based on EVI or NDVI
The SVI can be calculated based on the Normalized Difference Vegetation Index (NDVI) as well as on the Enhanced Vegetation Index (EVI) depending on the user's preference. Both products can be easily downloaded from AppEEARS. However, the SVI based on the EVI can be preferred in certain circumstances to the NDVI given following advantages:
- No distortions in the reflected light caused by the particles in the air
- No distortions in the reflected light caused by ground cover below the vegetation
- The EVI data product does not become saturated as the NDVI when viewing rainforests and large amounts of chlorophyll
Cloud mask
In order to mask out pixels that are impacted by atmospheric interferences such as clouds as well as snow and ice cover, the Pixel Reliability Quality Assurance (QA) layer of MOD13Q1 is being used. The layer classifies the quality of the vegetation index in the following categories:
![]()
"Good" and "marginal" data in the pixel reliability bands are accepted as sufficient quality and will be considered for the analysis. Other filter values than "0" and "1" are used to mask out the corresponding EVI pixels.
Find more information about the MODIS Land Products Quality Assurance here.