")
Introduction
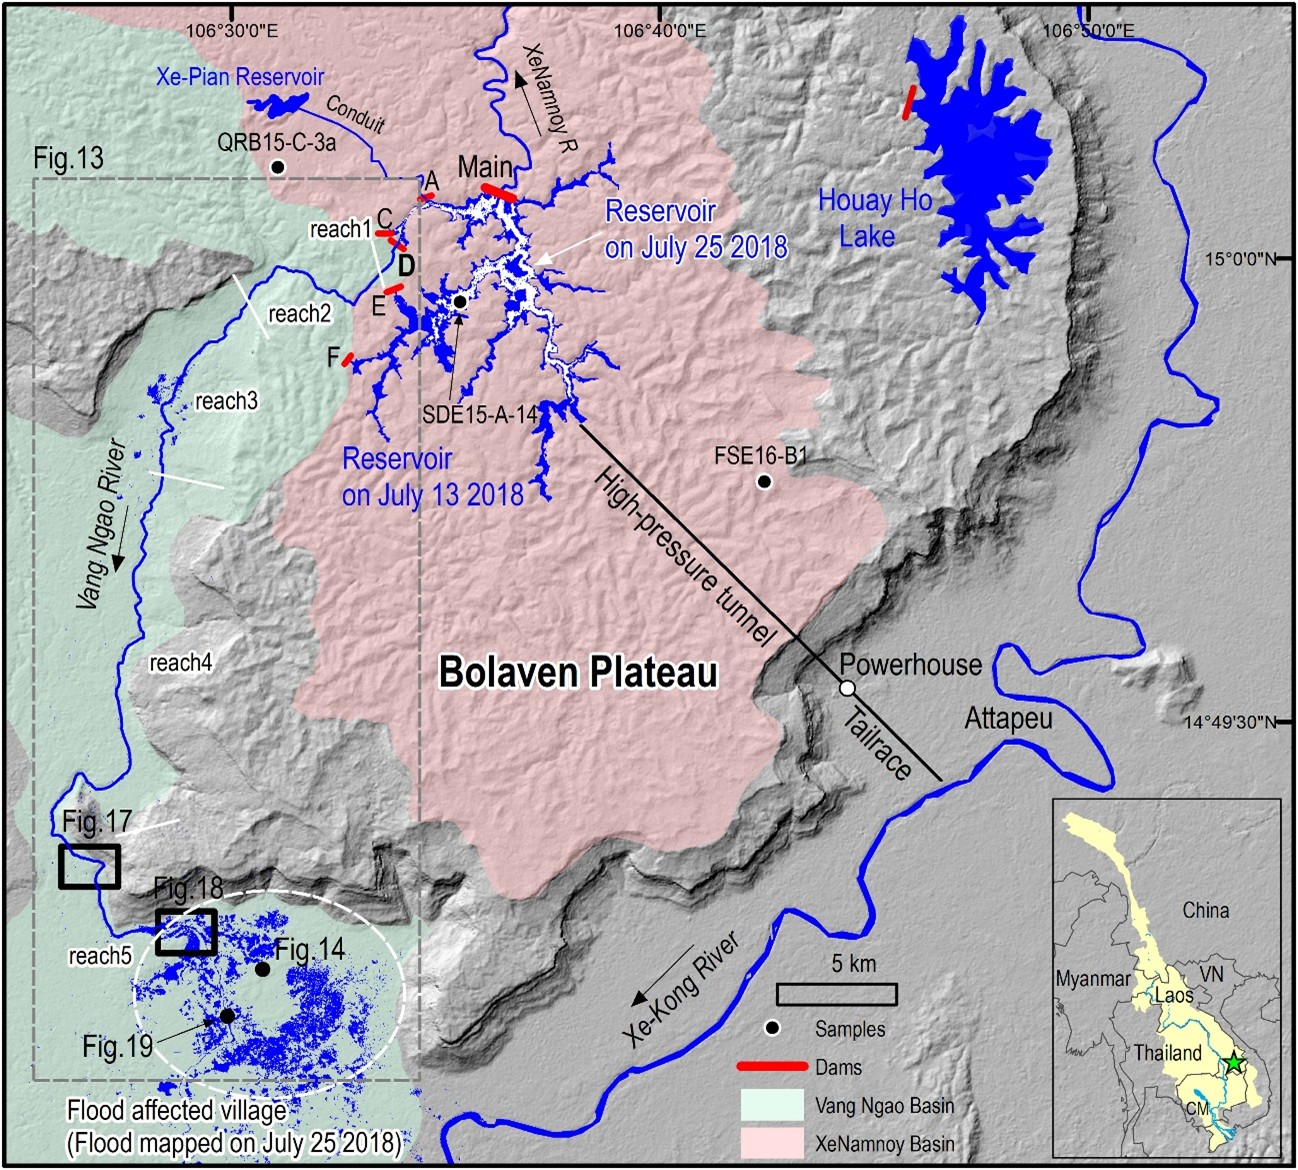
On 23 July 2018, Saddle Dam D, part of the Xe Pian–Xe Namnoy hydropower project in southern Laos, experienced a catastrophic structural failure. This auxiliary saddle dam, designed to contain a portion of the project’s large reservoir system, collapsed suddenly after exhibiting signs of instability. The collapse unleashed approximately 350 million cubic meters of water from the upstream reservoir, creating a massive flood wave that travelled through the Vang Ngao River basin. This inundation devastated an estimated 46 km² of land, sweeping away villages, destroying critical infrastructure such as roads and bridges, and causing widespread displacement of local communities. Beyond the human and material toll, the incident exposed structural and operational vulnerabilities in dam design, construction quality, and hazard preparedness, particularly in the context of the rapidly expanding hydropower sector in Southeast Asia. It underscored the urgent need for effective remote sensing-based monitoring strategies to identify precursory deformation and mitigate the risk of similar disasters.
This study uses Sentinel-1 Synthetic Aperture Radar (SAR) imagery to retrospectively analyze the dam’s pre-collapse deformation through Time-Series Interferometric SAR (TS-InSAR) methods. By processing 17 images acquired between January and July 2018, downloaded via the Alaska Satellite Facility (ASF) SAR Data Search Tool (ASF Data Search), this study demonstrates how modern SAR-based geospatial analysis can enhance dam safety monitoring and early warning systems.
Time Series Interferometric SAR Analysis
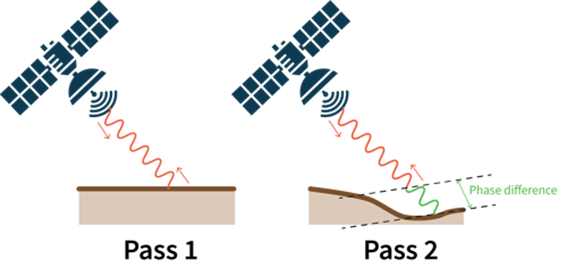
SAR is a powerful remote sensing technology that observes surface conditions regardless of time of day or weather, by transmitting microwaves from satellites and measuring their reflections. Interferometric SAR (InSAR) uses SAR images from two different dates to detect surface deformation such as crustal movements and land subsidence, making it a key tool in geoscience and disaster risk management. Differential InSAR (DInSAR) can detect surface displacements with centimeter-level accuracy by removing topographic effects from phase differences. It has been successful in capturing major events like earthquakes and volcanic activity.
However, DInSAR’s reliance on just two acquisitions makes it sensitive to decorrelation and atmospheric artifacts, limiting its effectiveness for slow or progressive deformation monitoring, such as seepage-induced subsidence in dam embankments. These limitations include:
• Temporal and Spatial Decorrelation: InSAR coherence degrades when surface properties change (e.g., vegetation growth or soil moisture), or when satellite paths differ too much, making measurement difficult in vegetated or agricultural areas.
• Atmospheric Phase Screen (APS): Water vapor in the troposphere causes signal delays, introducing phase errors that can mask or mimic actual ground displacement. DInSAR, using only two images, cannot separate atmospheric effects from real deformation.
• Phase Unwrapping Errors: InSAR measures wrapped phase values. Recovering true displacement requires phase unwrapping, which can fail in noisy or rapidly deforming areas, causing large systematic errors.
To overcome these challenges, Time-Series InSAR (TS-InSAR), such as Persistent Scatterer Interferometry (PSI) and Small Baseline Subset (SBAS) methods, emerged in the late 1990s. This approach uses dozens of SAR images to statistically model and separate phase components into true displacement, topographic errors, atmospheric effects, and noise. This marked a transformation from InSAR as a one-time snapshot tool to a reliable monitoring system capable of tracking surface motion with millimeter accuracy.
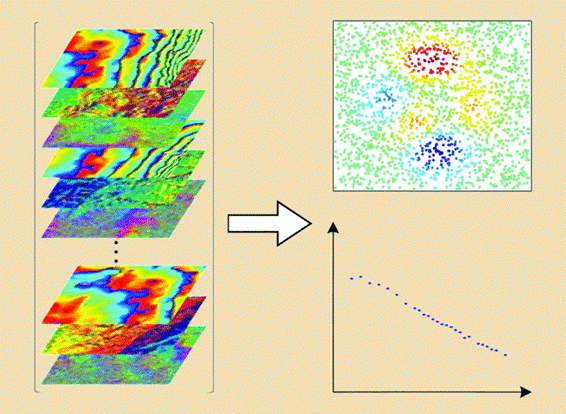
Although many frameworks are applied for TS-InSAR processing, they share the same basic principle. In essence, the time-series InSAR technique is used to process the complex 3D signal to obtain information of interest, as shown in Figure 4.
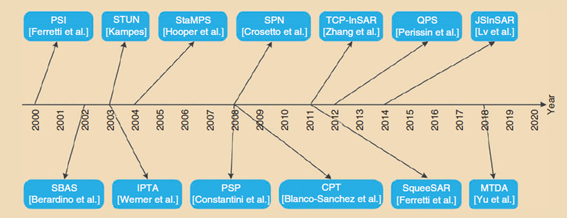
Since the introduction of TS-InSAR, many organizations have proposed their own TS-InSAR techniques. Figure 5 shows the development of various time-series InSAR techniques. We classified current TS-InSAR techniques according to different perspectives so that readers may have a comprehensive understanding of various methods and learn about the design ideas behind them. The classification of TS-InSAR techniques is based on the key steps in their processing chain.
The following process outlines the standard steps used in TS-InSAR analysis to detect and monitor surface deformation phenomena such as flooding, landslides, and land emergence over time. Unlike simple pre/post color-composite techniques, TS-InSAR utilizes a stack of SAR images acquired under consistent viewing geometry to extract phase-based displacement information with high precision.
- SAR Data Acquisition: Acquire a time series of SAR images (typically 20 or more) covering the area of interest from satellites such as ALOS-2, Sentinel-1, or RADARSAT. Ensure consistent acquisition parameters (orbit direction, look angle, off-nadir angle, etc.) to maximize interferometric coherence.
- Co-registration of SAR Images: Align all SAR images in the stack to a selected master image with sub-pixel accuracy. This ensures that each pixel corresponds to the same ground location across time. Co-registration is a prerequisite for interferogram generation.
- Interferogram Generation: Generate differential interferograms from suitable image pairs by calculating the phase difference between the master and slave images. Select pairs based on temporal and spatial baselines to minimize decorrelation (e.g., short temporal and perpendicular baselines).
- Topographic Phase Removal: Remove the topographic component of the interferometric phase using a Digital Elevation Model (DEM), such as SRTM or AW3D, to isolate deformation and atmospheric effects in the residual phase.
- Persistent Scatterer or Coherent Point Identification: Identify stable pixels with high coherence across the time series. Depending on the method used, these may include Persistent Scatterers (PS) or Distributed Scatterers (DS), which are less affected by noise and temporal decorrelation.
- Phase Time Series Analysis: Model and decompose the interferometric phase at each stable pixel into key components:
a. Surface deformation (e.g., linear/subsidence trends)
b. DEM error
c. Atmospheric phase screen (APS)
d. Residual noise
- Phase Unwrapping and Displacement Extraction: Perform spatial and/or temporal phase unwrapping to resolve the 2π ambiguity and extract absolute displacement values in the satellite's line-of-sight direction. This step is critical for reconstructing reliable deformation histories.
- Velocity and Time-Series Product Generation: Derive deformation velocity maps and displacement time series for each identified scatterer. These products allow millimeter-scale tracking of surface movements over months or years.
Visualization and Interpretation: Export results to GIS platforms (e.g., QGIS, ArcGIS) for visualization. These interpretations support disaster response, infrastructure monitoring, and geohazard assessments.
a. Subsiding zones appear as steady negative trends.
b. Emerging areas may show consistent positive displacement.
c. Stable zones exhibit minimal phase change.
Analysis Result
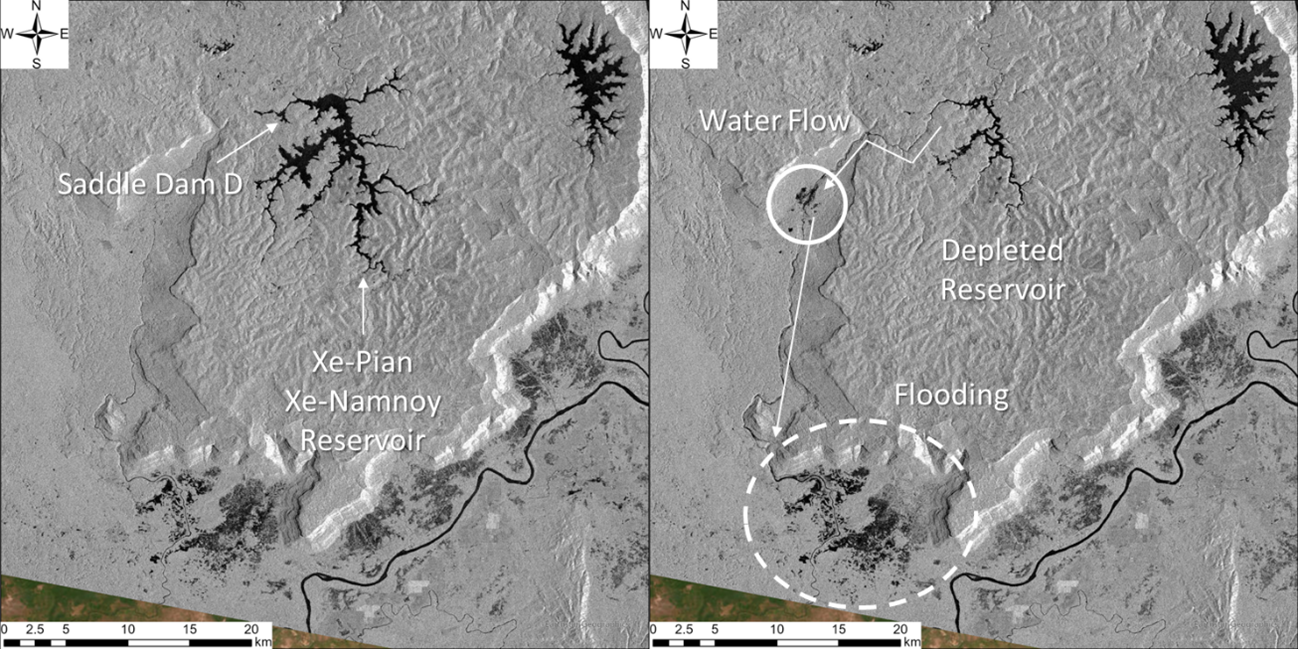
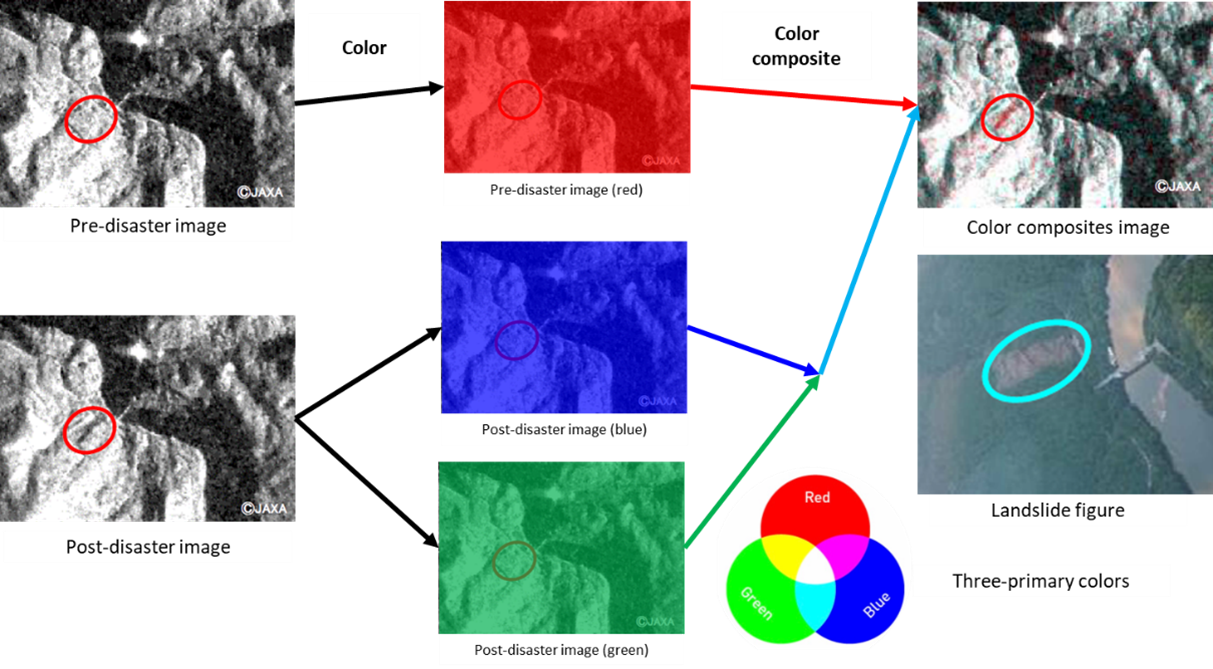
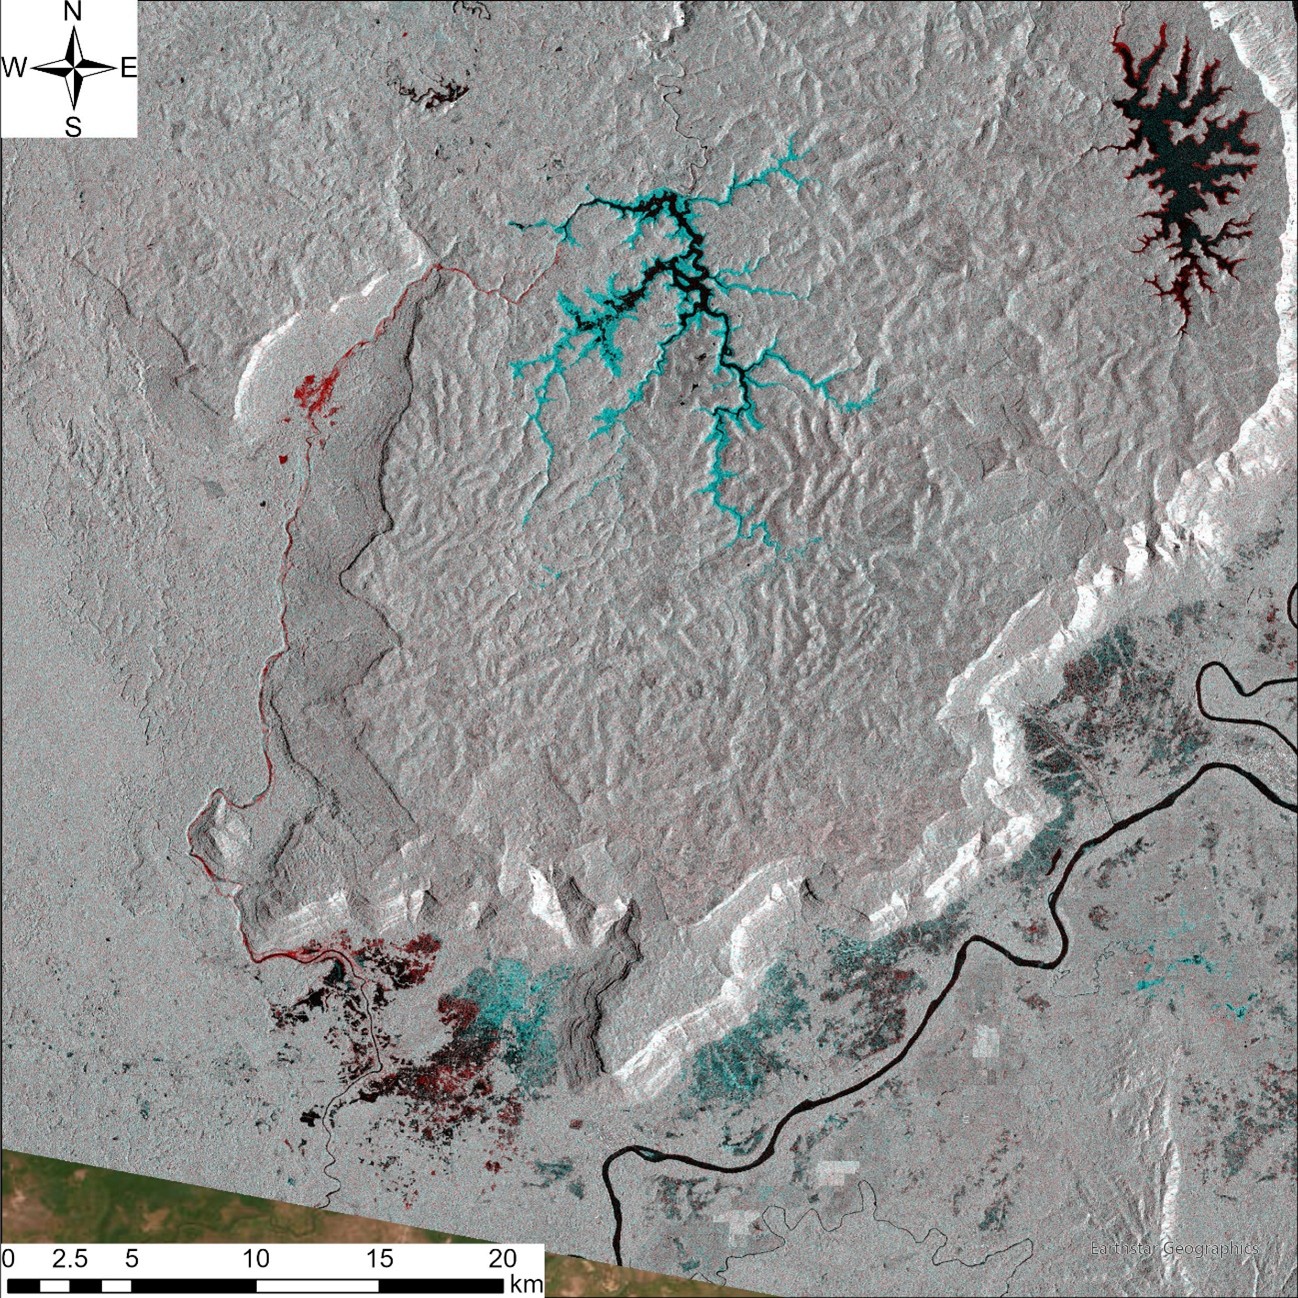
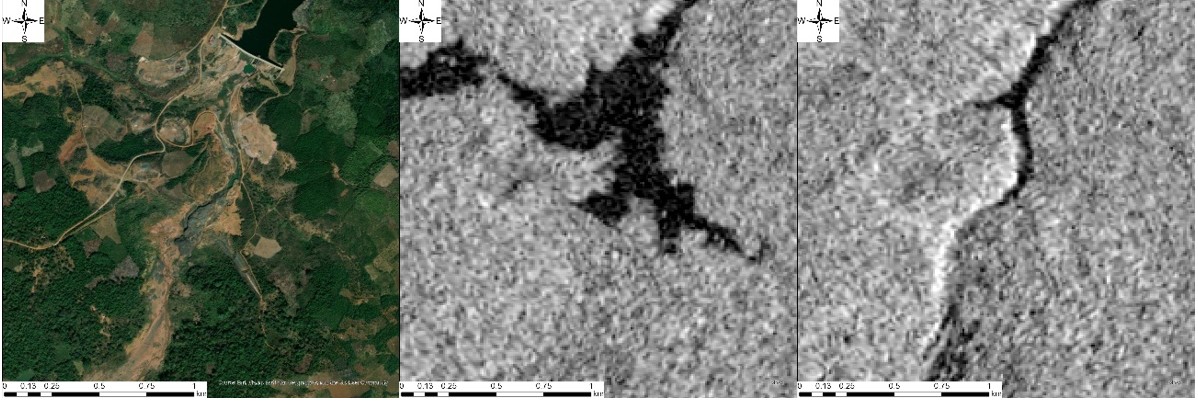
Color-composite imagery derived from pre- and post-disaster SAR acquisitions provided an immediate and intuitive visualization of the flood extent. By assigning different acquisition dates to RGB color channels, changes in surface water coverage became distinctly visible. This technique enabled rapid mapping of inundated zones and facilitated cross-validation with aerial photographs and field survey reports. When the composite imagery was overlaid with landslide polygons derived from post-event aerial reconnaissance, a strong spatial correlation emerged. Many of the observed landslides were concentrated along steep valley slopes adjacent to the flood path, suggesting that rapid drawdown and intense water flow from the dam breach acted as primary triggers for slope failure.
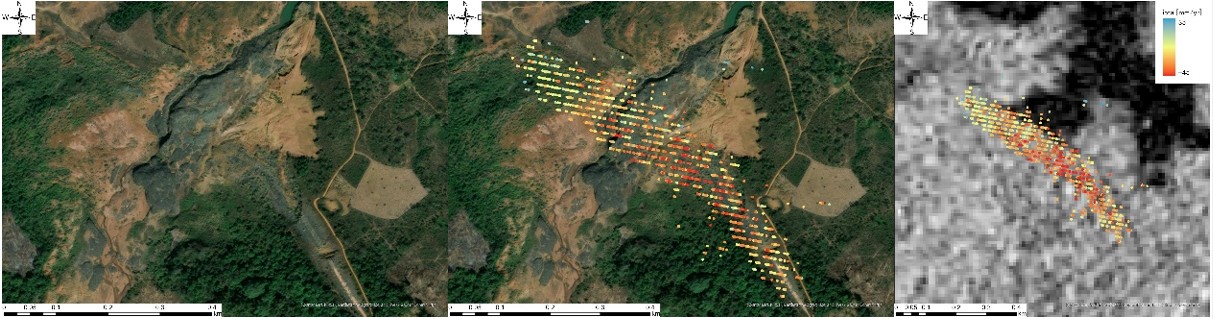
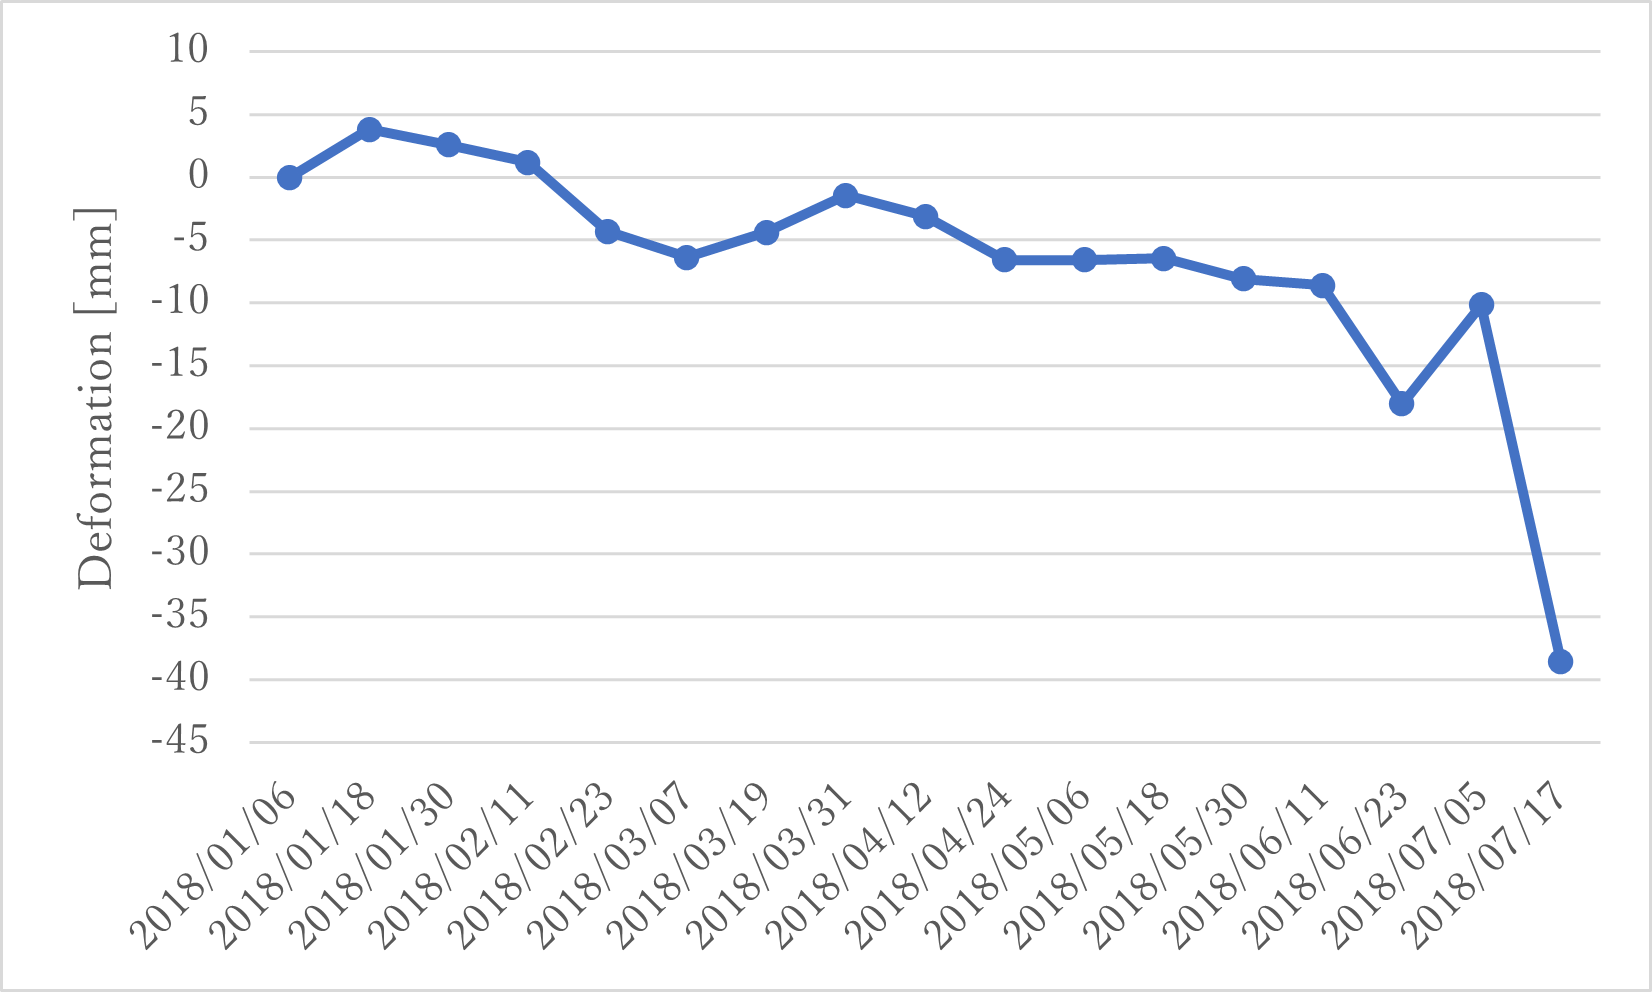
In addition to flood extent mapping, one kinds of TS-InSAR, Interferometric Point Target Analysis (IPTA), yielded valuable insights into pre-collapse deformation at Saddle Dam D.
Analysis of scatterer time series revealed gradual but measurable displacement patterns localized along the central crest and upstream shoulder of the dam. In some points, displacement rates increased in the weeks prior to the collapse, indicating progressive structural weakening. These deformation signals, on the order of several millimeters to centimeters, would likely have been imperceptible to conventional visual inspections but were detectable in the interferometric phase data. The IPTA-derived velocity maps displayed a clear gradient, with the highest subsidence velocities aligning with the eventual breach zone.
Moreover, temporal analysis showed that deformation rates accelerated notably during the peak rainy season, suggesting a relationship between increased reservoir load, seepage pressures within the dam structure, and instability progression. By correlating these deformation patterns with meteorological records, it is possible to attribute part of the observed motion to hydrological forcing, reinforcing the importance of integrating SAR monitoring with reservoir management data.
From an operational perspective, these results demonstrate the potential of TS-InSAR and IPTA techniques to serve as an early-warning component in dam safety programs. Real-time or near-real-time processing of incoming Sentinel-1 or ALOS-2 imagery could provide engineers and decision-makers with actionable intelligence on emerging deformation trends. Had such a system been implemented prior to the Xe Pian–Xe Namnoy disaster, alerts could have been issued days or even weeks in advance, allowing for pre-emptive reservoir drawdown or targeted structural reinforcement.
Beyond this case, the workflow applied here has relevance for other geohazards and critical infrastructure monitoring. The same TS-InSAR approach can be adapted to monitor tailings dams, urban subsidence zones, or large-scale landslide complexes. Furthermore, combining SAR-derived deformation products with hydrodynamic flood modeling can yield a comprehensive hazard chain assessment, from structural failure to downstream flood propagation, thereby enhancing both preparedness and post-disaster recovery strategies.
Conclusion
This study reaffirms the strategic value of advanced SAR-based monitoring for dam safety and disaster preparedness. The Saddle Dam D collapse highlights the pressing need for continuous, high-precision ground deformation monitoring, particularly in regions undergoing rapid hydropower development. Time-Series InSAR, when coupled with robust data acquisition strategies and integrated into dam asset management systems, offers a cost-effective, scalable solution for early detection of structural instability. Looking forward, the increasing availability of high-resolution L-band data from missions such as ALOS-4, and combined S- and L-band capabilities from NISAR, will further enhance deformation detection in vegetated and humid tropical environments, providing an indispensable tool for safeguarding communities and infrastructure.
References
Latrubesse, Edgardo & Park, Edward & Sieh, Kerry & Dang, Thanh & Lin, Yunung & Yun, Sang-Ho. (2020). Dam failure and a catastrophic flood in the Mekong basin (Bolaven Plateau), southern Laos, 2018. Geomorphology. 362. 107221. 10.1016/j.geomorph.2020.107221
Xue, F., Lv, X., Dou, F., & Yun, Y. (2020). A review of time-series interferometric SAR techniques. IEEE Geoscience and Remote Sensing Magazine, 8(1), 22–41. https://doi.org/10.1109/MGRS.2020.2972256
Agram PS, Warren MS, Calef MT, Arko SA. An Efficient Global Scale Sentinel-1 Radar Backscatter and Interferometric Processing System. Remote Sensing. 2022; 14(15):3524. https://doi.org/10.3390/rs1415352
Guidebook for Satellite Applications in Disasters: Landslide Disaster Edition," Satellite Applications and Operations Center, Japan Aerospace Exploration Agency, Erosion Control Planning Division, Erosion Control Department, Water Management and Land Conservation Bureau, Ministry of Land, Infrastructure and Transport (March, 2008) URL: https://www.mlit.go.jp/common/001227722.pdf