
The Global Facility for Disaster Reduction and Recovery (GFDRR), a grant-funding mechanism managed by the World Bank, has released a new report that analyzes how machine learning (ML) can be applied in disaster risk management (DRM) projects. The publication provides a concise, demystifying reference that readers - from project managers to data scientists - can easily use. It includes key definitions, case studies and practical considerations for the use of machine learning in disaster risk management.
Machine Learning at a glance
A machine learning (ML) algorithm is a type of computer program that learns to perform specific tasks based on various data inputs or rules provided by its designer. In the context of DRM, machine learning applies predominantly to methods used in the classification or categorization of remotely sensed satellite, aerial, drone and even street-level imagery by capitalizing on a large body of work on image recognition and classification.
This approach enables actions to be taken on the information gathered from the data; sometimes in near real time, for instance in the form of suggested web search results, and sometimes with longer-term human input.
Planning and implementation tips
The document also contains a section dedicated to giving the readers a brief overview of the steps to follow to set up an ML project. It describes how to prepare the inputs for the problem and evaluate the quality of the ML algorithm results and also goes into required project resources in more detail.
There are several issues that need to be considered when planning an ML project. Following a step-by-step learning approach, the report divides these into subsections and explains them one at a time:
selecting suitable input data
evaluating model output
expertise, time, infrastructure, and costs
ethics: privacy and bias considerations
The implementation and use of ML algorithms apply to the Digital Development and the Open Data for Resilience principles, which promote open innovation through the use of open standards, open data, and open-source software. All over the process of ML projects, several aspects can benefit from being documented and shared: the training data, the algorithm, the methodology, and the output data.
Practical case studies
Finally, the report shows evidence-driven case studies, selected as they provide an overview of how ML can support various aspects of DRM, from the prevention of social and physical exposure and vulnerability of communities to risk and post-disaster mapping, as well as damage prediction and assessment.
All the cases study showcased in the document represent different geographical regions, various input datasets, units of analysis and various ML algorithms.
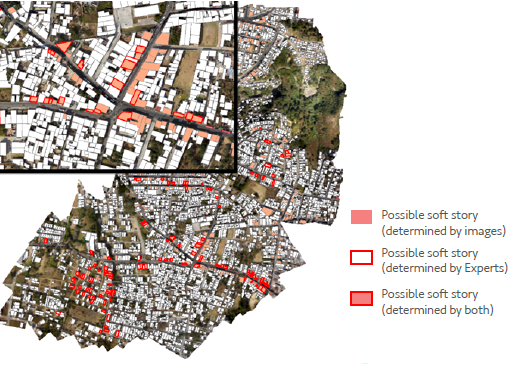
An interesting example is the Guatemala City case study, which shows how urban area physical exposure and vulnerability can be addressed and reduced through technology. Generally, detecting seismic vulnerability in urban areas is critical. Identifying high-risk buildings can save lives and help prioritize retrofitting investments. However, sending large teams of surveyors into the field is time-consuming and expensive. Instead, this case study leverages imagery from satellites and drones, and street-view images from 360° street cameras to identify homes that are a high risk for collapse during an earthquake.
Digital elevation models from satellite imagery helped identify buildings located on steep slopes, which are at higher risk for mudslides. A combination of satellite and drone imagery helped identify rooftop material, suggesting underlying construction techniques that are more vulnerable to seismic activities. The availability of street-view imagery is unique, as it can be used to identify soft-story constructions which are vulnerable to seismic activities.
This case study is a good example of how different physical factors of vulnerability can be extracted from various data sources and the unique capabilities of street-view imagery. The deep learning algorithm trained on the street-view imagery caught 85% of the buildings which were flagged by expert engineers as vulnerable.
ML projects can also support activity such as risk mapping and damage prediction. NASA developed the Landslide Hazard Assessment for Situational Awareness (LHASA) model in order to provide landslide hazard data in real time. They trained an algorithm that links landslide susceptibility factors (slope, geology, road networks, fault zones, and forest loss) to historical landslide events. This model is applied to precipitation data from the Global Precipitation Measurement (GPM) mission at three-hour intervals.
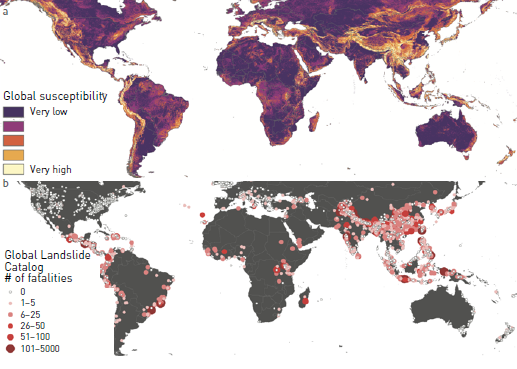
When rainfall for a given region is extremely high for that region, the landslide susceptibility map is consulted. If a region is also classified as being highly susceptible to a landslide, a nowcast warning is issued. Thus, LHASA provides near-real-time situational awareness of landslide risk on a global scale, presented in an open-source framework.
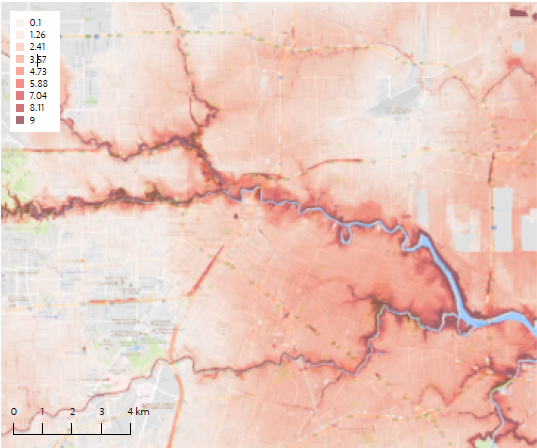
Another relevant use of open-source and space-based data for post-disaster event mapping and damage assessment is the project developed in 2017 by Orbital Insight, which uses Synthetic Aperture Radar (SAR) as an input for an image classification algorithm that allows the categorization of at-risk areas for flooding in Houston, Texas. A combination of optical and SAR imagery (which is capable of “looking” through clouds) helped identify the flooding extent. Digital elevation models (DEMs) allowed natural watersheds to be delimited, and crowdsourced geotagged images were used to confirm the flood extents.
All the advancements made in the applications of the learning machine can and are being used to solve bigger issues confronting societies worldwide, from making the most of our land to preparing for and recovering from crises.