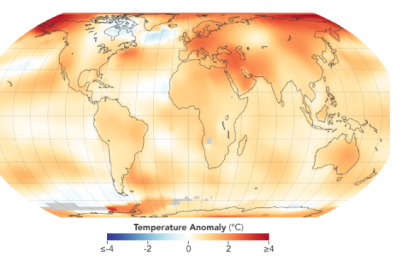
New satellite data from the National Aeronautics and Space Administration (NASA) confirms that 2015 to 2018 were the four hottest years on record. The findings echo the results of recent reports by the European Space Agency (ESA) and the World Meteorological Organization (WMO).
The Atmospheric Infrared Sounder (AIRS) on NASA's Aqua satellite collected the data, which NASA and the National Oceanic and Atmospheric Administration (NOAA) analyzed. Both WMO and NASA’s GISTEMP results originate from a combination of in situ and satellite-derived data, enabling the estimation of temperatures for data-sparse areas such as the poles.
NASA’s AIRS uses 2400 wavelengths of light to create 3D maps of clouds, temperature and humidity throughout the atmosphere. The GISS Surface Temperature Analysis (GISTEMP) is an estimate of global surface temperature change.
The new GISTEMP data closely mirror findings from 2003 to 2017. The AIRS satellite is able to collect data in polar regions, where former recordings were sparse due to restrained usage of instruments and the limited number of weather stations. The new data indicates that warming trends rose faster than measured before, by 2.5 degrees Celsius per decade. The Paris Agreement has set a limit for the increase of global temperature to 1.5 degrees Celsius.
“2018 is yet again an extremely warm year on top of a long-term global warming trend,” said GISS Director Gavin Schmidt. According to him, increasing temperatures also contribute to longer fire seasons and some extreme weather events.
These findings are echoed by the ESA European State of the Climate 2018 report, which also examines variations in vegetation and soil moisture, wildfires, sunshine duration, river discharge, glaciers and sea ice.
The European State of the Climate 2018 report provides content about last year’s climate and its consequences in Europe based on the latest measurements from satellites and in situ stations. 2018 is compared to a reference period from 1981 to 2010, unless less extensive data records force the use of shorter periods. It delineates three events of preserving weather conditions over several months. The events and their impacts are placed in a long-term global context, featuring some key indicators for climate change.
The report states that 2018 was the third hottest year on record. It is compiled by the Copernicus Climate Change Service (C3S) which is implemented by the European Centre for Medium-Range Weather Forecasts (ECMWF) on behalf of the European Union.
The WMO Statement on the State of the Global Climate in 2018 - the 25th anniversary edition - highlights the impact of climate change on state-of-the-climate indicators such as temperature, greenhouse gases, the oceans and cryosphere as well as extreme events. The report was formally launched at a joint press conference at United Nations headquarters in New York on 28 March.
WMO’s global temperature assessment is based on five datasets: three of them are established by a combination of statistical methods of in-situ measurements on land and water, the other two are reanalysis datasets from the Japan Meteorological Agency (JMA) (JRA-55) and the ECMWF with its Copernicus Climate Change Service (ERA-Interim). ERA-Interim is a global atmospheric reanalysis from 1979 which is continuously updated in real time. Reanalyzed datasets construct a “reanalysis” of the atmosphere by combining meteorological and marine observations such as satellites-derived ones with modelled values.

