Flood hazard assessments are essential to design land-use ordinances or norms that minimize the exposure of future critical infrastructure and potential new settlements to such floods. Flood hazard assessments rely on flood modelling, which can be conducted using flood modelling software.
At the request of UN-SPIDER, the Space Applications Centre for Response in Emergency and Disasters (SACRED) of Pakistan’s Space and Upper Atmosphere Research Commission (SUPARCO) conducted a comparative analysis of the modelling of floods using two digital elevation models (DEM): The DEM developed by the United States National Aeronautics and Space Administration (NASA) based on its Shuttle Radar Topography Mission (SRTM), and WorldDEMTM developed by Airbus Defence and Space GmbH.
Both data sets are digital surface models (DSM), which represent the surface of the Earth including buildings, infrastructure and vegetation.
This comparison was conducted using the HEC-RAS River Analysis System software developed by the Hydrologic Engineering Center (HEC) of the United States Army Corps of Engineers. Flood modelling was conducted in the segment of the Indus river between the Chashma and the Taunsa barrages. This article presents the results of this comparison.
The Indus River
The Indus river is the main river of Pakistan. It originates in the Tibetan plateau and flows through the country, reaching the Arabian Sea near the city of Karachi. It is one of the longest rivers in Asia, with a length of nearly 2,900 kilometers. For this case study, the segment of the Indus river between the Chashma and the Taunsa barrages was used for flood modelling.
Data and Methods
The aim of this analysis has been to compare the results of hydrological modelling of floods between the Chashma and the Taunsa barrages using as inputs two digital surface models (DSM):
The digital elevation model WorldDEMTM developed by Airbus Defence and Space GmbH, and
The digital elevation model developed from SRTM of NASA.
Table 1 presents the characteristics of these two digital elevation models:
| PARAMETER | WORLDDEMTM | SRTM DSM |
|---|---|---|
| XY coordinate system | GCS WGS 1984 | GCS WGS 1984 |
| Vertical coordinate system | EGM2008 geiod height | EGM1996 geiod height |
| Resolution | 0.4 arc sec (approx. 12m) | 1 arc sec (approx. 30m) |
| Vertical accuracy | 2m (relative) / 4m (absolute) | 16m (with 90% confidence) |
| Data acquisition date | 2011 - 2015 | 2000 |
Results
While both DSMs can be used to carry out the flood modelling analysis, it is important to keep in mind that they were developed on the basis of space missions conducted at different times. The SRTM data and WorldDEMTM data are at least 10 years apart. Due to the different acquisition dates, there are differences in the river morphology as well as changes of the surface in the area of interest (AOI). This can be seen in Figure 1:
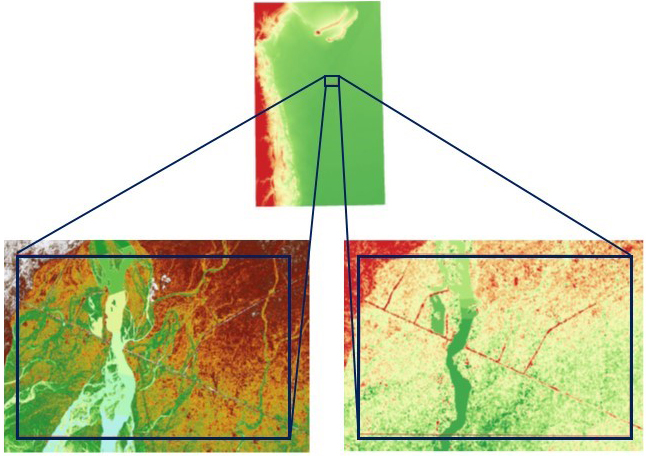
Figure 1: Comparison of floodplain as detected using the WorldDEMTM (left) and the SRTM (right). While the WorldDEMTM provides more detail, it is important to keep in mind that the two DEMs were developed from satellite observations in different decades. This explains the differences in the morphology of the main channel of the river.
Due to its higher resolution and very high relative vertical accuracy, the WorldDEMTM is representing more details concerning the floodplain, including small tributaries that are not really visible using the SRTM (see figure 1).
The extraction of cross sections is a standard method for hydrological modeling and flood simulation. Figure 2a presents a comparison of cross sections of the river in one place of the river, while figure 2b shows the comparison of cross sections in another part of the river. While both DSMs can be used to extract cross sections of the river, the WorldDEMTM is able to represent the topographic features of the cross section with a higher precision.
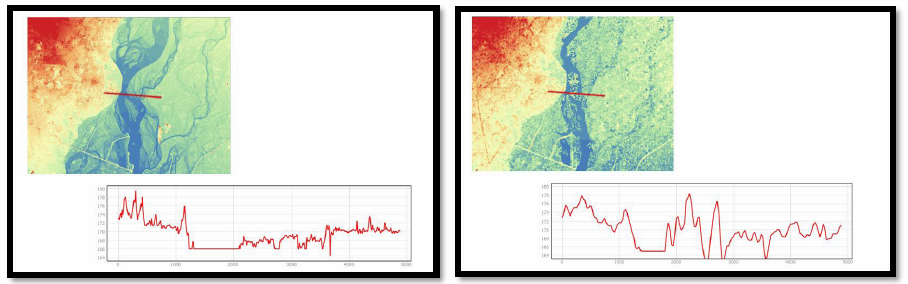
Figure 2a: Comparison of the cross section of the river in one random place using WorldDEMTM (left) and the SRTM (right).
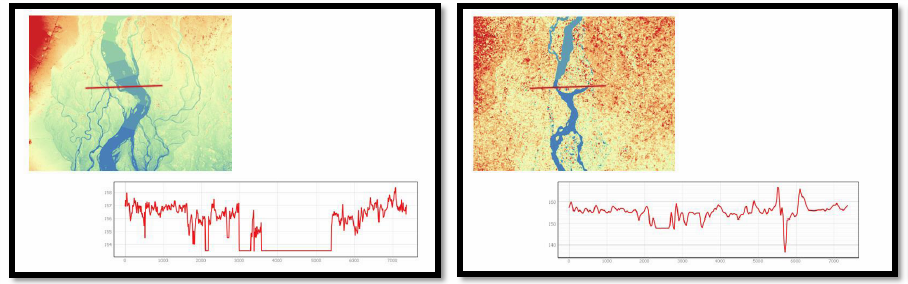
Figure 2b: Comparison of the cross section of the river in another random place using WorldDEMTM (left) and the SRTM (right).
While the previous figures show a comparison of the morphology of the river, the next figures present the results of the analysis conducted in various segments of the channel.
Figure 3a presents observed and simulated flow hydrographs using the WorldDEMTM and figure 3b presents the observed and simulated flow hydrographs using the SRTM.
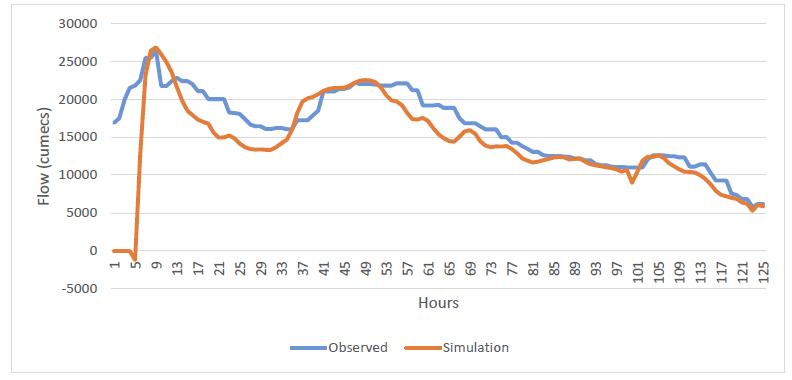
Figure 3a: Observed and simulated flow hydrographs at Taunsa barrage using the WorldDEMTM
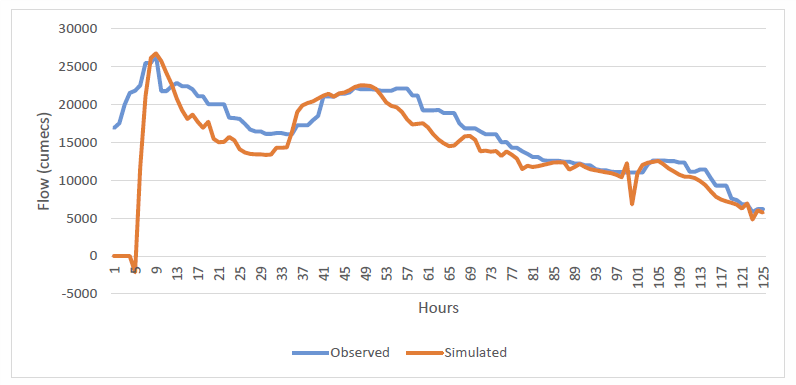
Figure 3b: Observed and simulated flow hydrographs at Taunsa barrage using the SRTM.
While these results are very similar over time, the observed and simulated flow hydrographs at the Chashma barrage are different when using the WorldDEMTM and the SRTM. Figure 4a presents the observed and simulated flow hydrographs using the WorldDEMTM. Figure 4b presents observed and simulated flow hydrographs using the SRTM.
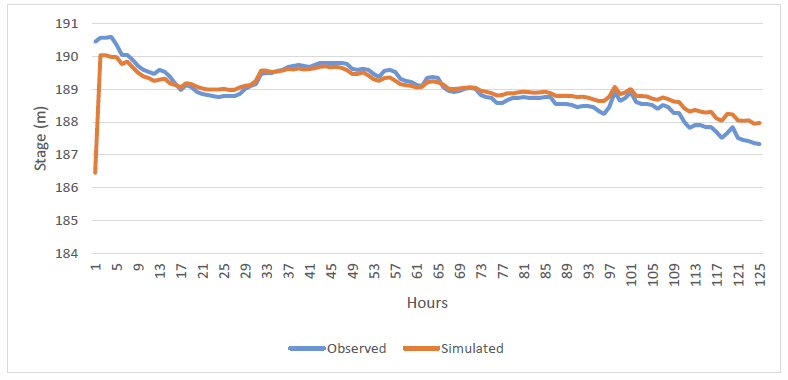
Figure 4a: Observed and simulated flow hydrographs at the Chashma barrage using the WorldDEMTM
As it can be seen, there is a good agreement between the observed and the simulated flow hydrographs for the period of 125 hours when using the WorldDEMTM. However, there is a difference of nearly 2 meters between the height of the observed and the simulated flow hydrographs throughout the period of 125 hours when using the SRTM.

Figure 4b: Observed and simulated flow hydrographs at the Chashma barrage using the SRTM
Another important parameter in hydraulic analysis is the simulated depth of the water along the channel. Figure 5 presents the comparison of simulated depth along the channel.
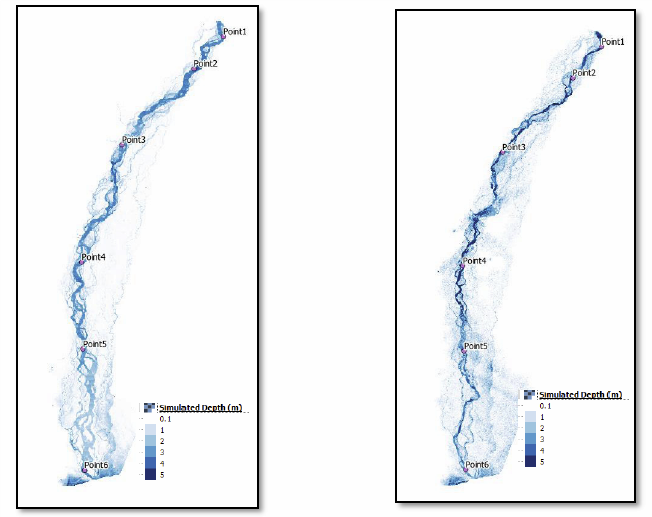
Figure 5: Comparison of the simulated flood depths using WorldDEMTM (left) and the SRTM (right).
From figure 5, it is possible to conclude that the simulated flood depth is larger when the SRTM is used; while the main channel is wider when the WorldDEMTM is used. Table 2 presents data on the simulated depth at 6 random points along the channel.
| Point | WorldDEMTM | SRTM |
|---|---|---|
| 1 | 3.28 | 6.78 |
| 2 | 4.07 | 5.58 |
| 3 | 3.46 | 4.74 |
| 4 | 3.32 | 7.70 |
| 5 | 2.95 | 3.36 |
| 6 | 3.01 | 2.84 |
The largest difference is detected in point 4, where the difference is nearly 4.4 meters. In contrast, the smallest difference is detected in point 6, where the difference is 0.17 meters. Furthermore, except for point 6, in all other points the simulated flood depth is higher when using the SRTM than when using the WorldDEMTM.
Figure 6a presents the simulated flood extent using the WorldDEMTM. This flood extent is overlaid on top of a Landsat-5 satellite image.
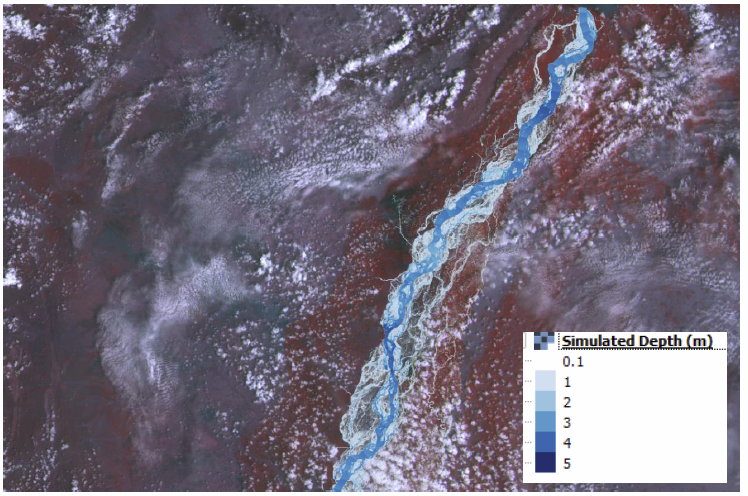
Figure 6a: Simulated flood extent and flood depth using the WorldDEMTM, overlaid on top of a Landsat-5 satellite image.
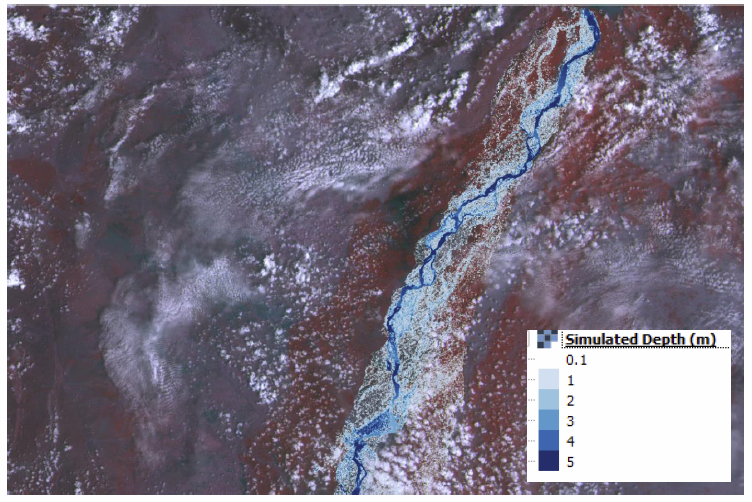
Figure 6b: Simulated flood extent and flood depth using the SRTM, overlaid on top of a Landsat-5 satellite image.
Conclusions
The analysis conducted leads to the following conclusions:
- The WorldDEMTM presents more details in the floodplain i.e. river body and surrounding areas.
- The WorldDEMTM-based simulated depth, extent and hydrographs agree with those observed.
- The SRTM-based simulated flow hydrograph is in agreement with the observed flow hydrograph at Taunsa Barrage. However, at the Chashma Barrage there is a difference of up to 2m lower than the observed.
- The simulated flood depth is larger when the SRTM is used; while the main channel of the river is wider when the WorldDEMTM is used. For further validation, reference data (e.g. based on In-situ measurement or very high resolution LIDAR DEM data) is required, but has not been available for the scope of this analysis.
In general, both data sets can serve as an input for flood modelling. However, it is important to be aware of the different characteristics of WorldDEMTM and SRTM to be able to correctly evaluate the results.
The main differences are:
- Acquisition dates: The acquisition period of WorldDEMTM is January 2011 to mid-2015 and thus the WorldDEMTM is more than 10 years more up to date than SRTM (SRTM was acquired in February 2000).
- Accuracy: The vertical accuracy of WorldDEMTM with a global average of LE90ABS is less than 4 meters while the accuracy of SRTM at LE90ABS is less than 16 meters.
- Resolution: WorldDEMTM has a relative accuracy of less than 2 meters for slopes less than 20%; and less than 4 meters for slope above 20%. This is very beneficial in regions of moderate and plain terrain where accuracy of flood modelling results strongly correlates with the accuracy of the DEM used as input.
The WorldDEM™ used in this analysis is a Digital Surface Model. However, to reduce the impact of surface features such as vegetation, Digital Terrain Models (DTM) are usually preferred for the purpose of landslide modelling. Since 2019, Airbus Defence and Space GmbH offers a WorldDEMTM-based, global, automatically derived DTM product with a resolution of 24m.
Acknowledgements
This user story has been provided by the Space and Upper Atmosphere Research Commission (SUPARCO) of Pakistan, a UN-SPIDER Regional Support Office (RSO).
The WorldDEMTM data has been provided by Airbus Defence and Space GmbH in the framework of the MOU between UNOOSA and Airbus Defence and Space.
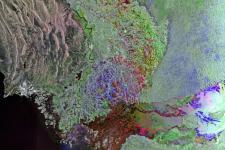
The main article image, courtesy of the European Space Agency (ESA), is a compilation of three passes by the European Envisat satellite on 15 May, 14 July and 12 September 2011, capturing the Indus River running through Pakistan’s Sindh province before emptying into the Arabian Sea.
References
- River Analysis System software of the Hydrologic Engineering Center (HEC-RAS): https://www.hec.usace.army.mil/software/hec-ras/
- NASA SRTM: https://www2.jpl.nasa.gov/srtm/
- WorldDEMTM Technical Product Specification Document, Version 2.5, April 2019
- WorldDEM DTMlite Technical Product Specification Document, Version 1.0
- WorldDEMTM of Airbus Defence and Space Website: https://www.intelligence-airbusds.com/en/8703-worlddem