")
What are precipitation data used for?
Floods, landslides, and droughts are hazards that are triggered by excess or shortage of precipitation. Monitoring precipitation is important to see those hazards coming and to enable decision makers to take measures as early as possible. Precipitation data - together with ancillary data - thus help to prevent that natural hazards turn into disasters.
Ground-based rain gauges measure the amount of precipitation at a specific spot. Data of different rain gauges are often interpolated to get an estimate of the regional coverage of precipitation. The quality of such interpolated maps depends on the density of rain gauges and on the spatial variablity of precipitation in the respective region. The density of rain gauges is very low in most parts of the world. According to NASA, all rain gauges in the world packed together would fit on two basketball courts. Radar measurements cover much larger areas than rain gauges, in average about 130,000 square kilometers. However, this technology is not avaialble in many parts of the world. Besides, ground-based radars do not reach high altitude clouds and obstacles like mountains block the radar signal. Over the ocean, there are even fewer precipitation measurements based on ships. Satellite-based precipitation measurements fill in those gaps.
How is precipitation monitored from Space?
More than 50 years ago, the first weather satellite, Tiros 1, was launched. Today a whole fleet of weather satellites is in orbit including the geostationary Meteosat and GOES satellites, whose images are well known from daily weather forecasts. However, few satellites are designed specifically to measure rain, snow, and other types of precipitation at a global scale. Such specialized satellites use active radar and passive radiometers to diagnose what is happening in the clouds. They can provide 3-D views of storms.
In 1997, the Tropical Rainfall Radar Mission (TRMM) was launched by NASA and JAXA being the first rain radar in Space. After 17 years of 3-D images of rain and storm, the satellite is about to reach the end of science operations in or about April 2015. The animated image shows hurricane Sandy's rainfall on October 28, 2012 as seen by TRMM precipitation radar (Credit: NASA).
Image: NASA.
TRMM's successor, the Global Precipitation Mission (GPM), was launched jointly by NASA and JAXA in February 2014. The sensors of GPM are designed to continue and expand TRMM measurements. GPM carries two instruments: Firstly, NASA's advanced GPM Microwave imager (GMI), which captures precipitation intensities and horizontal patterns; GMI uses thirteen different microwave channels to not only measure light to heavy rainfall but also falling snow. The second instrument onboard GPM is JAXA's Dual-frequency Precipitation Radar (DPR), which provides insights into the three dimensional structure of precipitation particles.
More GPM satellites are planned to be launched by a consortium of GPM partners in the United States of America, Japan, France, India and Europe. The first GPM satellite, which was launched by NASA and JAXA, will serve as the GPM Core Observatory to serve as a reference standard to unify precipitation measurements from all satellites that fly within the contellation. The whole constellation of GPM satellites will observe precipitation over the entire globe every 2-3 hours.
How can I access precipitation data?
Both, GPM data and TRMM data are available free of charge:
How are the datasets used for disaster risk management and emergency response?
TRMM rainfall data at about 25km resolution are used in the operational Famine Early Warning System Network (FEWS NET). FEWS NET combines high resolution (0.05°) rainfall mean fields with current satellite-derived rainfall estimates to provide pentadal (5-day) rainfall fields suitable for crop monitoring. Next to TRMM precipitation data, a variety of different satellite data is used including estimated rainfall from infrared temperature data from NOAA at 4km resolution. Read more here.
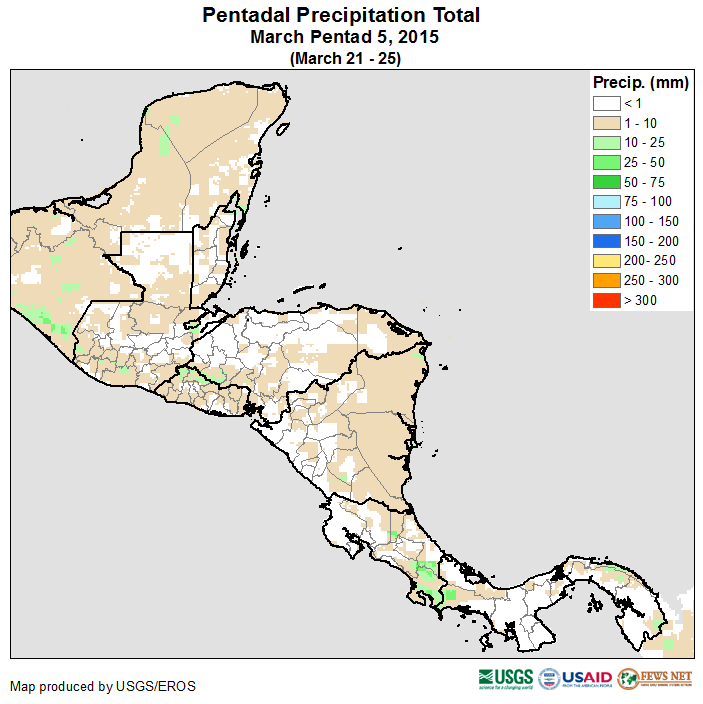

Example of the FEWS NET Pentadal Precipitation product. (Image: FEWS NET)