")
What are land cover maps used for?
Land cover maps display the bio-physical cover of the earth’s surface. Typically the classes include but are not limited to water, developed (residential), barren, forest and shrubland. Land cover information is important for many scientific and societal applications, especially when monitoring environmental change. In Disaster Management and Emergency Response land cover maps are often used to observe agricultural changes, to assess and monitor drought and flood risk, to map and model fire/burn or future climate change risks.
Land cover maps are generated by classifying pixels based on their spectral reflectance from satellite aerial imagery. This process is described in more detail in the next section. In order to classify each pixel, a number of methodologies can be applied. These can be based on commercial software such as ArcGIS or open source software like QGIS and R among a few. However, land cover information is not only available by generating it through software but can also be accessed using online tools such as REMAP.
The quality, or detail, of the map depends on the resolution of the image used during the pixel classification. The resolution of a satellite image can be further refined into three different categories, swath width, pixel resolution and temporal resolution. These resolution factors define the area an aerial imagery covers, e.g. 1km2, the size of each individual pixel in the image, e.g. 10m2 and the number of times a satellite collects imagery e.g. every 6 days.
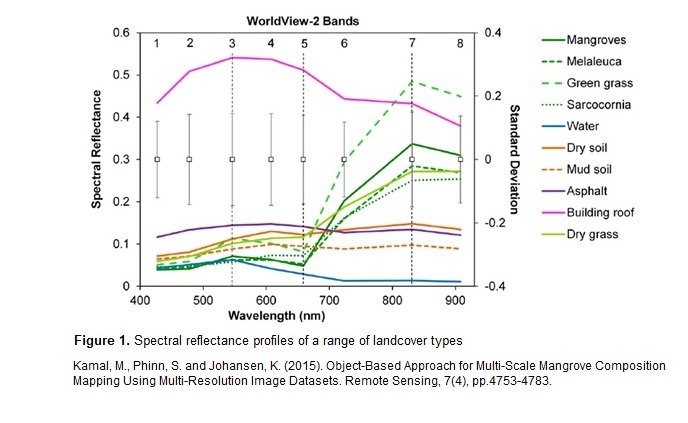
Taking flood mapping as an example, water has a specific spectral reflectance similar to a specific colour code combination in RGB code. This can be seen in Figure 1 which shows the different spectral reflectance and wave length values for a range of land cover types. With the use of specific wavelength properties, sample areas from images could be selected and trained to identify pixels with similar spectral reflectance/ absorption and assigns them to the groups mentioned earlier (water, forest etc.). This process is called semi-automated land cover mapping. Another way to obtain land cover maps is through fully automated land cover mapping where an algorithm independently identifies land cover classes based on the surface spectral reflectance/absorption of the pixels. The approach is often limited in terms of accuracy, especially in high-resolution imagery.
Land cover information is important for many applications like flood modeling, observation of agricultural drought, climate change modeling, and monitoring of environmental changes including vegetation phenology, flooding, fire occurrence, and monitoring of carbon emission due to deforestation and forest degradation.
Typical land cover classes include, for example, forest, crops, grassland, water surfaces, or artificial cover. Land cover interacts strongly with the water cycle and the climate system. The type of land cover determines the behaviour of precipitation on the Earth. This includes the infiltration rate, runoff, and evapotranspiration of water. The spatial distribution of different land cover types is therefore, a decisive factor for water and climate models. In hydrology, a so-called curve number is used to predict runoff and infiltration. The value of the curve number depends on the soil and land cover type. Land cover maps are needed to determine the spatial distribution of different curve number values within an area.
Another example of using land cover information for disaster risk reduction is agricultural drought monitoring. The Food and Agriculture Organization (FAO) extracts a crop mask from land cover information to calculate the Agricultural Stress Index for cropland. UN-SPIDER’s Regional Support Office in Iran, the Iranian Space Agency, recommends a similar approach. Detailed step-by-step procedures on this Recommended Practice is available on the UN-SPIDER Knowledge Portal.
How is land cover mapped from space?
Most global land cover maps are based on medium to high resolution optical and radar satellite imagery, for example, AVHRR, MODIS, SPOT-Vegetation, and MERIS. More recently high-resolution optical imagery, from the Sentinel missions, Landsat, SPOT-4/5, IRS LISS III and RapidEye, is used to generate regional land cover maps.
When using a standard approach satellite imagery is obtained and the user chooses a type of analysis method which is believed to be the most appropriate for the information they are trying to receive. As mentioned above, pixel spectral reflectance/absorption is an often used method to classify different Landover types in both semi- and/or automated processes. In some texts, these are often referred to as supervised or unsupervised classification respectively. Semi-automated land cover mapping is often dependent on the skill of the user and the number of samples used to train the software or program. On the other hand, automated processes can result in errors in unique landscapes where specific features don’t fall into the standard reflective pattern. However, pixel reflection is not the only way to map land cover from space. An object-based approaches make use of more than just the spectral information of single pixels; they take the relationship to neighbouring objects, the shape, homogeneity, size and colour of the object into account. Multi-temporal approaches are used to separate very similar classes, for example, different crop types, by looking at different plant growth patterns.
Multi-sensor fusion of optical and synthetic aperture radar (SAR) data is applied to increase the number of acquisitions within a phenological cycle and to improve the classification accuracy. The choice of the most suitable classification algorithm depends on different factors like data availability or the number and type of land cover classes. The drawback of having so many different classification algorithms in place is that available land cover maps are often not comparable. The international remote sensing community including GEO and GTOS has worked on the harmonization of global land cover products and standardization of classification systems to improve interoperability of different land cover maps. The Land Cover Classification System (latest version: LCML – LCCS v.3; ISO 19144-1) aims at providing a globally applicable classification scheme. Progress is also made in the development of validation standards, for example by the CEOS Cal/Val Working Group.
How can I access land cover maps?
For generic use, many land cover datasets are available for free. This includes global datasets based on medium to coarse resolution satellite imagery, for example
- MODIS land cover products: years 2001-2012; 500m-5,600m resolution
- Land cover products from ESA's climate change initiative: years 1998-2012; 300m resolution
- Global land cover by national mapping organisations - GLCNMO: years 2003-2008; resolution 500-1,000m
- Global land cover GLC2000 by the European Commission's Joint Research Center
- ESA's GlobCover map: year 2009; 300m resolution: year 2000; 1,000m resolution
With the GLC-SHARE map, FAO provides a global land cover map. Through harmonization and standardization of classification systems, FAO has fused best available land cover maps for all regions to produce this global product, which was released in October 2014. China has released in summer 2014 the first global land cover map based on Landsat data at 30m resolution.
For many countries, national land cover maps are available based on high-resolution Landsat or SPOT-5 imagery. National land cover data are included in the UN-SPIDER database on data sources, which can be filtered by countries. For example, the Space and Upper Atmosphere Research Commission (SUPARCO), Regional Support Office of UN-SPIDER in Pakistan, has published two land cover atlases in Pakistan based on 5m resolution SPOT-5 imagery, which are available for download in pdf format. For many African countries, land cover data are available from FAO's Africover project including Sudan, Kenya, Senegal, Libya, Egypt, Eritrea, and DR Congo.
Online land cover mapping using REMAP
The Remote Ecosystem Monitoring & Assessment Pipeline (REMAP) allows users without the otherwise needed, hard or software and/or training to create land cover maps. It is a web-based, free, opensource and globally available tool. In order for a user to create land cover maps, a 7-step based progress based on semiautomated mapping needs to be followed. Once the region of interest is selected, users are required to train the random forest classifier that REMAP utilises to create land cover maps; this process is well explained in the tutorial provided on the remap web app (https://remap-app.org). It is currently limited to areas of around 100,000km2 however according to REMAP (2017) this area might increase in the future. REMAP also offers users to upload field observations or other point based data in .csv file format. It is recommended that users with or no little experience in land cover mapping should create their landcover maps based on ISO standards mentioned earlier. Once the random forest classifier is trained the web app automatically creates the desired land cover map. The map can be downloaded in a range of formats for further use in more complex analysis.
Further reading: A recent review of the current status and future trends of global land cover maps has been published by Brice Mora et al. (2014) (dx.doi.org/10.1007/978-94-007-7969-3_2).What are land cover maps used for?
Land cover datasets are included in the UN-SPIDER database on data sources.