What are digital elevation models used for?
Digital elevation models (DEMs) are needed for mapping and modelling natural hazards and risks that are influenced by topography, for example floods and landslides.
Since water only runs downhill and the flow of water is channelled by objects that are higher than the water level, elevation information is used to model the flow of water and to determine possible inundation areas in case of floods. Step-by-step procedures how to use DEMs for flood modelling are provided in the practice recommended by University of Purdue (link to the practice).
Slope is a decisive factor for landslides. Generally, landslides occur only in areas with a certain initial relief contrast in the source area of the landslide. Slope can easily be derived from DEMs; any standard remote sensing software provides tools to automatically derive a slope image from a DEM. In a study performed at the GFZ Helmholtz Center Potsdam and published in August 2014, a DEM of 30m spatial resolution derived from the X-band data of the Shuttle Radar Topography Mission in February 2000 is used in combination with multi-temporal NDVI trajectories derived from 5m resolution RapidEye optical satellite imagery to automatically detect landslides over large areas. The approach can be used for generating multi-temporal landslide inventories and regular monitoring of landslide activity. It was applied successfully in a study area in Kyrgyzstan with an average landslide size of approximately 13,000m2. According to the authors of the study, further methodological development is needed to adapt the approach to regions where the natural environments largely differ from the conditions in Central Asia. (link to the open access paper)
Furthermore, DEMs are necessary for orthorectifying satellite imagery. Satellite imagery taken from different view angles can only be compared when orthorectified, otherwise the pixels do not align.
How is elevation measured from space?
Elevation can be measured from space using different approaches designed for different sensors. For radar sensors interferometric SAR (InSAR) is applied. For optical sensors stereo images are analyzed to derive elevation information.
Elevation measurements on the ground also make use of space technology. Handhelds with built-in receivers for Global Navigation Satellite Systems (GNSS) like GPS are used to estimate elevation on the ground. With Differential GPS (D-GPS), elevation can be measured on the ground with high precision. Such measurements are used to model and to validate elevation based on satellite imagery.
Very precise and high resolution elevation measurements are possible using airborne laser-ranging (lidar) instruments. The first space-borne lidar instrument for continuous global observations of Earth was the Geoscience Laser Altimeter System (GLAS) onboard ICESat (2003-2009), which was designed to measure ice-sheet topography and associated changes. The resulting DEMs for Antarctica and Greenland have a horizontal spatial resolution of 500m and 1km. The recently launched ICESat-2 (2018) with the ATLAS instrument onboard is also designed for the observation of ice-sheet elevation change (cf. this video of NASA to understand how the ATLAS instrument works).
How can I access digital elevation models?
Since 28 September 2018 a 90 meter resolution global digital elevation model (DEM) is available free of charge from the German Aerospace Center (DLR). It is part of the products derived from the TanDEM-X mission (TerraSAR-X add-on for Digital Elevation Measurements) which allowed to capture a horizontal resolution of 12m and a vertical accuracy better than 2m (source: JRC) or plus/minus 10m (source DLR). The TanDEM-X derived (DEM) model covers all of Earth’s land surfaces with no gaps. It captures the elevation from 2010-2015 and represents an update to the afore used DEM product of the Shuttle Radar Topography mission (SRTM) dating from the year 2000.
- The 90m TanDEM-X DEM is freely accessible at the DLR Geoservice and has a high elevation accuracy of up to ~1m in some areas. (link to the data)
- Furthermore, 12m and 30m elevation models are available with a scientific proposal. These are, however, subject to restrictions due to the potential for commercial exploitation.
Products of the Shuttle Radar Topography Mission (SRTM), which was flown aboard the space shuttle Endeavour February 11-22, 2000 are also freely available in different versions and resolutions as presented below. While the TanDEM-X data has no gaps and high accuracy, the SRTM data may be preferred if a higher resolution can be accessed. A comparison of SRTM and TanDEM-X DEMs can illustrate effects of mining and landslides that occurred between the two missions.
- SRTM 1 arc-second global datasets of approximately 30m horizontal resolution are now available globally. (link to the data)
- SRTM 3 arc-seconds non void filled and void-filled by NGA (approximately 90m horizontal resolution). The vertical error of the DEMs is reported to be less than 16m (source: JRC) or plus/minus 10m (source DLR). The data are available for the entire land surface between 60 degrees North and 60 degrees South. (link to the data)
- SRTM 3 arc-seconds void filled by CGIAR-CSI and JRC. (link to the data)
- While the above DEMs are based on C-band data of the SRTM, the German Aerospace Centre (DLR) also provides DEMs based on X-band data of the SRTM. The horizontal resolution is 25m and according to DLR, the vertical precision is plus/minus 6m. The data are available for the whole globe between 60 degrees North and 60 degrees South but not covering the entire land surface. (link to the data)
The Tandem-X mission started in June 2010 and has already outlived its expected lifetime of 5.5 years. Both TanDEM-X and TerraSAR-X are still orbiting the earth and acquiring images to detect topographic changes that have occurred as a result of earthquakes or in glaciers, permafrost regions, agricultural areas or urban zones.
Not only radar sensors such as the ones listed above can be used to create DEMs. An example of a DEM derived from optical sensors is the ASTER Global DEM. It covers the entire land surface of the Earth between 83 degrees North and 83 degrees South with a horizontal resolution of 1 arc-second (approximately 30m). The vertical accuracy is generally between 10 and 25m. The ASTER DEM contains some artifacts which could affect its utility in certain applications (cf. validation summary report). (link to the data)
Other freely available DEMs includes GTOPO30 at 1km horizontal resolution derived from different raster and vector sources covering the land surface of the whole globe (link to the data) or the Global Multi-Resolution Topography (GMRT), which includes Sonar Seafloor Bathymetry (link to the data).
Exploring DEMs
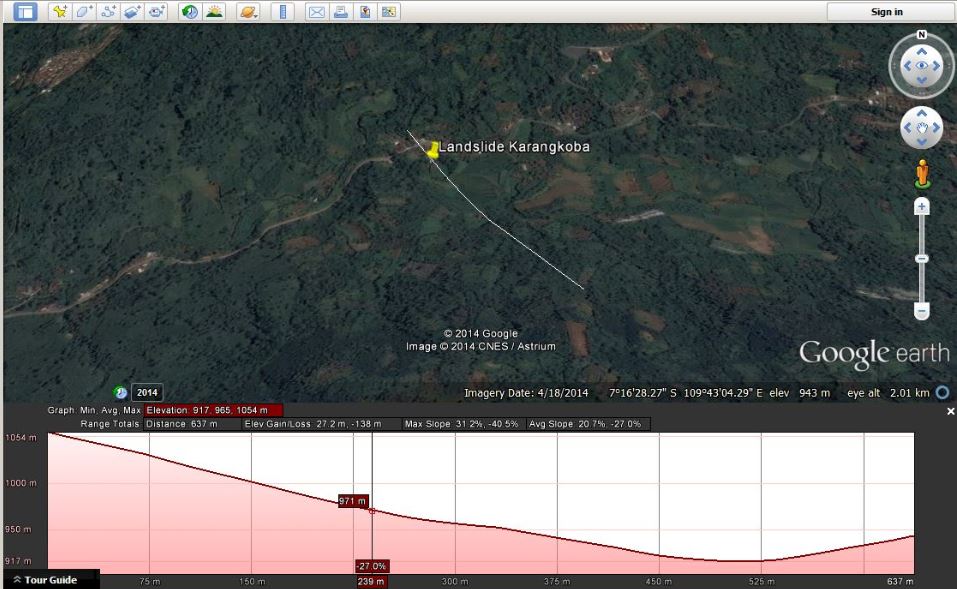
A nice and easy to use tool to look at elevation profiles of any are area of interest are the Google Earth elevation profiles (how to). The image below shows an elevation profile for the landslide in Indonesia for which the International Charter on Space and Major Disasters was activated on 15 December 2014.