")
What is drought monitoring used for?
Droughts develop gradually; they are referred to as slow-onset natural hazards. Droughts often do not get any global attention until they trigger a famine or cause wildfires. Unfortunately, response to droughts is too often reactive in terms of crisis management. According to the World Meteorological Organization (WMO), droughts are by far the most damaging of all natural disasters because of their long-term socio-economic impacts. Early detection of droughts is important for managing emerging crop losses to prevent or mitigate possible related famines, and for dealing with increased fire risk. Satellite imagery helps to monitor precipitation, soil moisture, and vegetation health to support drought early warning systems. It is used to feed monthly drought bulletins and to issue warnings.
How are droughts monitored from Space?
Meteorological droughts are defined by rainfall deficiency over an extended period of time. Meteorological droughts can turn into agricultural droughts, which are characterized by a soil water deficiency and subsequent plant water stress and reduced yield. Agricultural droughts can then turn into hydrological droughts, which refer to deficiencies in surface and subsurface water supplies. The different drought definitions imply that several parameters are used to monitor drought: precipitation, temperature, evapotranspiration, soil moisture, and vegetation. These parameters can be observed from space.
Using vegetation indices is a popular approach due to its simplicity. Vegetation indices like NDVI and EVI are freely available in near-real-time (cf. Data Application of the Month on Vegetation Indices). In addition, calculating anomalies or the Vegetation Condition Index indicating the state of the greenness of vegetation in relation to a time-series is straight-forward (cf. Recommended Practice by UN-SPIDER's Iranian RSO). A drawback of a vegetation-based approach is that the drought is already quite advanced once water stress is already visible in the vegetation cover. Soil moisture can indicate plant water deficiencies earlier than vegetation indices can do. Soil moisture products are also available free of charge in near-real-time but with a lower spatial resolution (cf. Data Application of the Month on Soil Moisture). Soil moisture is currently not exploited to its full potential for drought monitoring. Precipitation data are usually taken from climate stations. However, the spatial coverage of climate stations is sometimes not satisfying and interpolation of precipitation data is therefore very coarse. Satellite sensors such as the declining Tropical Rainfall Measuring Mission (TRMM, cf. related news) and the new NASA/JAXA Global Precipitation Measurement mission (GPM, cf. related news) can complement or replace climate station precipitation data in areas where ground-based data are not available.
Existing drought monitoring systems make use of freely available satellite data sometimes in combination with ground-based data. They provide pre-calculated indices, anomalies, and agricultural information in near-real-time free of charge at global to national scale.
How can I access drought monitoring information?
Several institutions worldwide are processing satellite data to provide useful information for drought monitoring to support drought early warning. They provide interactive webmaps, static maps in near-real-time, or monthly drought bulletins to be used by decision makers. See below how to access this information.
Access global drought monitoring information
The U.S. Agency for International Development (USAID) Famine Early Warning Systems Network (FEWS NET) with the USGS FEWS NET data portal provides free of charge and publicly available near-real-time and archived information via its global data portal as well as via its regional data portals for Africa, Central America/Caribbean/Mexico, South Asia, and. Central Asia. The information includes NDVI (temporally smoothed NDVI, mean anomaly, previous year difference, and percent of average) based on eMODIS 10-day composits in near-real-time and archived data for up to two years; different indices based on pentadal TRMM satellite rainfall estimates and anciliary data, e.g. the Water Requirement Satisfaction Index (WRSI) for the growing season, which is an indicator of crop performance based on the availability of water to the crop during a growing season for crops; the onset of rains/start of growing season and its anomaly; the crop soil water index (SWI); rainfall estimate and precipitation forecast; seasonal rainfall accumulation anomaly; and number of consecutive dry days. The NDVI data are available as geotiff while all other information is only available as png graphics. In addition, an early warning explorer is provided for interactive visualization and download of data for parameters like NDVI and rainfall for Africa. An experimental decision support interface (DSI) with crop zones and current and archived drought conditions for Africa complements the FEWS NET services.
The Food and Agriculture Organisation (FAO) provides wit ASIS free of charge and publicly available global webmaps for near-real time (10 days) information on seasonal indicators like the Agricultural Stress Index (ASI), progress of season, and mean vegetation health index (VHI), as well as an annual summary of ASI, mean VHI, and maps of the start and the end of season. ASIS also provides near-real-time information and monthly summaries of vegetation indices (NDVI anomaly, VCI, VHI) and precipitation indicators (estimated precipitation, precipitation anomaly, and long term average estimated precipitation). The global webmaps are also available as archived maps from 1984 onwards. Additionally, seasonal indicators, vegetation indicators, and precipitation indicators as well as NDVI and precipitation graphs are provided at country level for the latest 12-months period.
With its Global Agricultural Monitoring (GEOGLAM) initiative the Group on Earth Observation (GEO) is delivering within its Agriculture Societal Benefit Area monthly global crop outlooks for wheat, maize, rice, and soy to support FAO's Agricultural Market Information System (AMIS). GEOGLAM provides an interactive monthly assessment tool for AMIS countries. Available layers in the assessment tool include anomalies of rainfall, temperature, and NDVI (since August 2013) as well as crop masks and associated crop calendars for the four crop types. The assessment results in the visualization of four different crop stages (planting-early vegetative, vegetative-reproductive, ripening through harvest, and out of season) and crop conditions (exceptional, favorable, watch, and poor). GEOGLAM satellite data are available via Earth Explorer (Landsat) and via the University of Maryland (MODIS).
The Center for Spatial Information Science and Systems (CSISS) provides a the Global Agricultural Drought Monitoring and Forecasting System (GADMFS), a webtool for drought monitoring including the Vegetation Condition Index (VCI), the normalized difference vegetation index (NDVI), and a drought index layer showing six levels of drought (no drought, abnormally dry, moderate drought, severe drought, extreme drought, exceptional drought).
With its Global Drought Information System (GDIS), the U.S. National Integrated Drought Information (NIDIS) together with international partners provides a platform with non-prescriptive drought information from local providers with the objective to make drought conditions around the world comparable. The platform offers an interactive map with the following layers: global station-based SPI (from 1-24 months) and remotely sensed GPCC based SPI (1-24 months); soil moisture for Africa; rainfall percentiles and soil moisture for Australia; soil moisture, monthly rainfall, SPI, vegetation water content (NDWI), vegetation productivity (fAPAR), and combined drought indicator for Europe; and SPI, Palmer drought indices, percent of average precipitation, North American drought monitor for North America. An overview of current conditions of the standard precipitation index (SPI), the vegetation health index (VHI), and global drought monitor is also provided. Furthermore, the platform provides links to the regional drought monitoring platforms of the international partners: Monitor of the Australian Department of Agriculture, the African Flood and Drought Monitor (AFDM), the European Drought Observatory, and the North American Drought Portal.
NASA's Earth Observing System Data and Information System (EOSDIS) provides access to near-real-time satellite data that are potentially useful for drought observation: MODIS Corrected Reflectance True Color and Bands 7-2-1, MODIS Land Surface Reflectance bands 1-2-1, MODIS Snow Cover, and AIRS precipitation. The satellite data can be visualized in NASA's interactive webmapping tool Worldview, where it can also be overlaid with the following layers from the Socio Economic Data and Applications Center (SEDAC): drought economic risk (2000) and drought hazard frequency and distribution (1980-2000). The latter is also available for visualization and download in the webinterface provided by Databasin.
Access regional drought monitoring information
Besides global drought observation platforms, many regions in the world have implemented their own regional platforms and some global platforms also provide regional information, for example the below:
- European Drought Observation (EDO - JRC)
- Drought Monitor-US Only (NDMS) (link to the data)
- U.S. drought reports (NOAA)
- Drought Index Map for Vegetation-US Only (VegDRI - USGS)
- Enhanced Combined Drought Index in Southeast Asia - experimental version (TU Vienna)
- Famine Early Warning Systems (FEWS NET - USGS)
How are the datasets used for disaster risk management and emergency response?
Satellite based drought monitoring information is used by governments for situational awareness. A concrete example is the use of satellite-based drought information for monthly drought bulletins.
However, not all the useful satellite information available is provided in a usable format and not all usable information is ultimately used to support decisions to mitigate the impact of droughts. A recent paper by Enenkel et al. (2015) in the journal "Global Food Security" tackles the problem that the potential of satellite information to support disaster risk management decisions is not yet fully exploited. Technical solutions like continental and global drought portals are available but these solutions are not tailored to the end user's requirements. Enenkel et al. propose a framework for an operational decision-support system (cf. figure below). The framework shows clearly that the monitoring of parameters like vegetation cover, soil moisture, or precipitation, the identification of critical thresholds, seasonal forecasting and the application of advanced Earth observation models is not enough to support decision maker's choices. The gaps are to link these solutions to user requirements, to make the information more easily accessible, and to integrate environmental data with socio-economic information including crowd-sourced information.
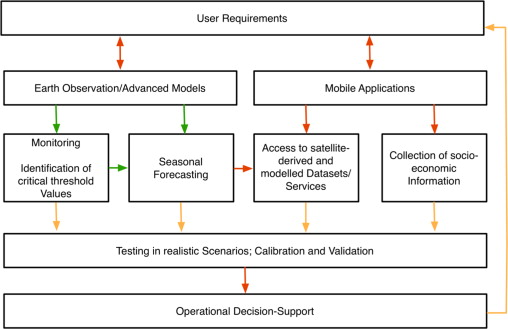
Figure: Framework for an operational decision support system proposed by Enenkel et al. (2014). Green: established connections, orange: moderate connections, red: weak connections. (Source: Enenkel et al. 2014, doi:10.1016/j.gfs.2014.08.005)
UN-SPIDER contributes to this task by bringing stakeholders from the technical communities and the disaster risk management and emergency response communities together during workshops and conferences, by providing the UN-SPIDER Knowledge Portal as an information hub for both communities, and by offering technical advisory support including the development of recommended practices based on user requirements. During the 6th annual meeting of Regional Support Offices in Vienna in February 2015 it was decided to start the second stage of the recommended practices project: validating the practices from a technical perspective and evaluating the results from a user perspective.