Background
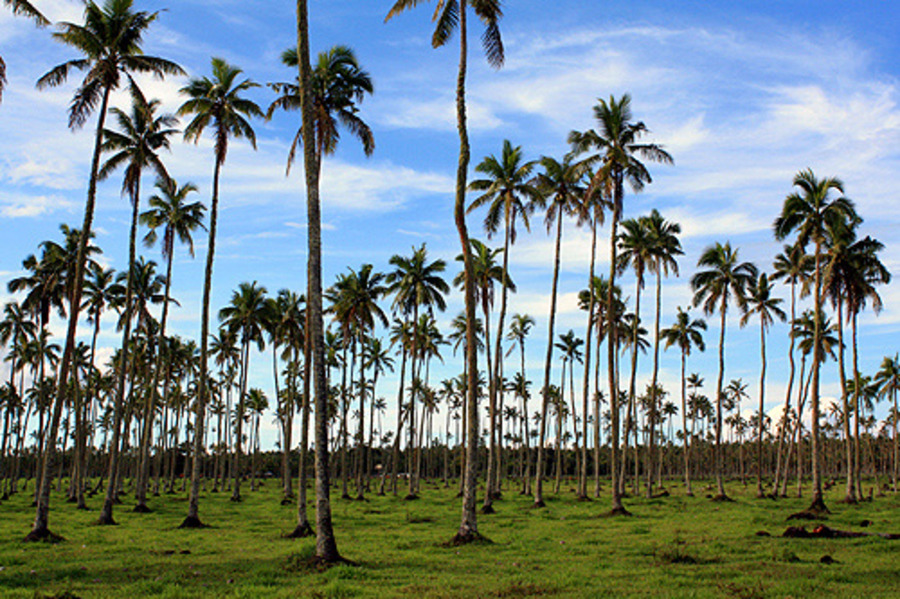
Following the completion of the Tonga Disaster Preparedness Pilot Project, national authorities identified an urgent need for reliable vegetation datasets to strengthen their environmental reporting and climate action planning. Palm trees are not only a defining feature of Tonga’s landscapes but also a key component of the Agriculture, Forestry & Other Land Use (AFOLU) sector under the UNFCCC reporting framework. Accurate inventories of palm trees are essential for estimating carbon sequestration potential, developing greenhouse gas inventories, and informing applications to climate finance mechanisms such as carbon markets. A useful point of comparison is the ArcGIS tutorial “Detect objects with a deep learning pretrained model”, which applies a pretrained palm tree detection model to drone imagery of Kolovai, Tongatapu, at ~9 cm resolution. The tutorial demonstrates the efficiency of pretrained AI models for vegetation detection at local scale, but it is limited in scope and scalability. Drone imagery requires significant logistical effort to achieve island-wide coverage, and pretrained models may not capture the local variability of palm species or land-use conditions. In contrast, the FlyPix AI initiative builds on the same principle of AI-driven detection but scales the approach using Airbus Pleiades Neo satellite imagery at 15 cm resolution. This allows for comprehensive island-wide mapping with validated accuracy and operational readiness for national climate reporting.
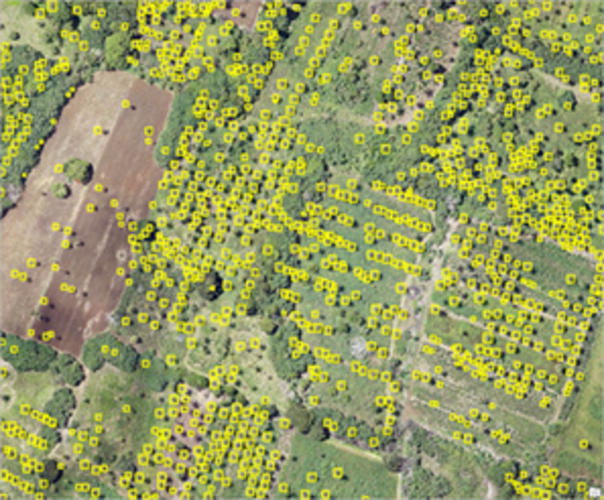
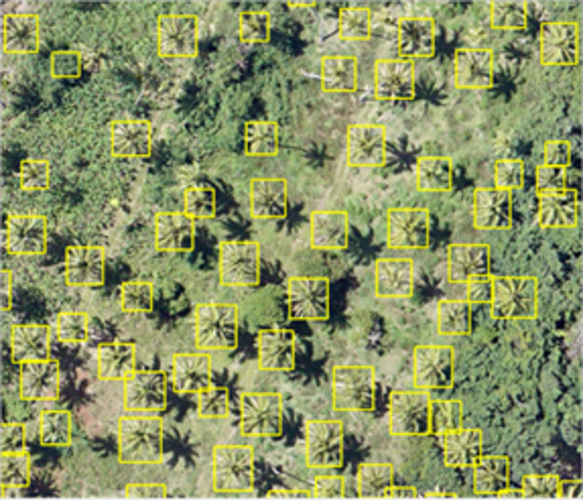
Figure 1. Example of palm-tree detection from drone imagery, from the ArcGIS tutorial ‘Detect objects with a deep learning pretrained model’ (Esri).
Approach
To address Tonga’s needs, FlyPix AI deployed its deep learning-based palm tree detection model on Airbus Pleiades Neo imagery. The imagery, originally captured at 30 cm resolution and processed to 15 cm, provided the necessary detail for distinguishing palm trees across varied environments, including dense coastal forests, agricultural plots, and peri-urban areas.
The technical workflow included:
1. Data Preparation: Pre-processed Pleiades Neo imagery covering the entirety of Tongatapu was enhanced to 15 cm resolution, maximizing clarity for feature extraction.
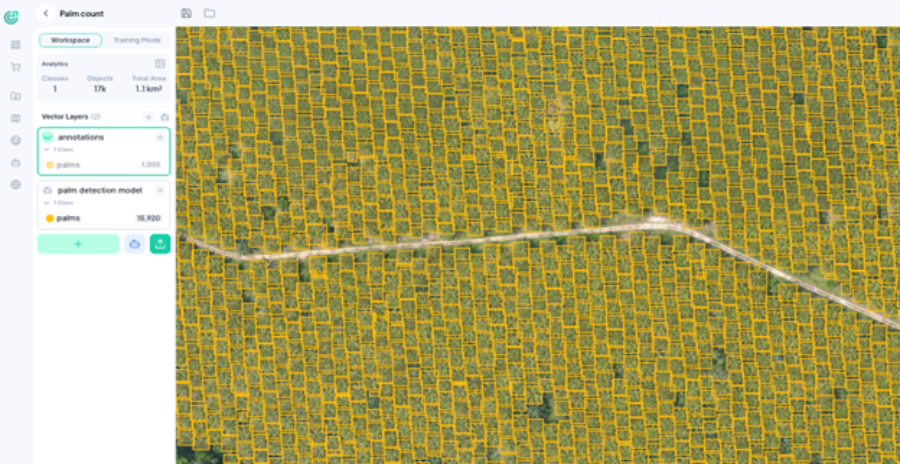
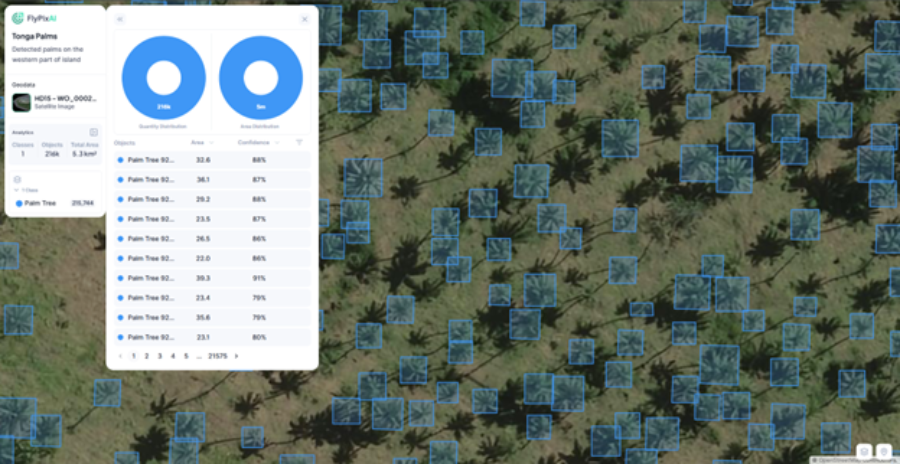
2. Model Deployment: The FlyPix AI detection algorithm automatically identified and localized palm trees using bounding boxes, ensuring both isolated and clustered palms were accurately detected.
3. Validation and Accuracy Assessment: Performance testing achieved a mean Average Precision at IoU 0.5 (mAP50) of 94.7%, confirming strong agreement between predictions and actual palm tree locations.
4. Mapping and Integration: The detections were compiled into a geospatial dataset and visualized as a full-island palm distribution map, structured for integration with national GIS platforms and climate reporting systems.
By leveraging high-resolution satellite data, the workflow avoided the logistical and financial constraints of drones or field surveys, while providing an operational, national-scale dataset ready for reporting and monitoring.
Result
The project produced a comprehensive palm tree inventory for Tongatapu, offering actionable insights for:
Carbon Credit Estimation: Establishing accurate baselines for palm-related carbon sequestration and enabling applications to international carbon finance mechanisms.
Greenhouse Gas Inventory: Directly supporting Tonga’s Fourth National Communication to the UNFCCC under the AFOLU sector.
Land-Use Monitoring: Enhancing national strategies for sustainable agriculture, reforestation, and ecosystem management.
Regional Replication: Providing a scalable methodology for other Pacific islands where vegetation data collection is a critical gap for climate action.
The high accuracy of the model (94.7% mAP50) ensures that the dataset can be confidently used in official reporting, while also strengthening Tonga’s technical capacity for evidence-based climate action.
End-User Feedback
The dataset was shared with Tonga’s climate change authorities, who emphasized its practical value for national reporting:
“a great asset towards the forestry inventory under the AFOLU sector with their Greenhouse Gas Inventory for our climate reports such as Tonga's Fourth National Communication Report that we’ve been trying to gather data upon.”
This feedback underscores the importance of AI-satellite workflows in bridging critical data gaps and providing ready-to-use outputs for policy and reporting needs.
Conclusion
By comparing with smaller-scale AI detection exercises, such as the ArcGIS drone-based tutorial, this project highlights how high-resolution satellite imagery combined with specialized AI models can deliver validated, operational datasets at national scale. For Tonga, the palm detection project not only provides a tool for greenhouse gas reporting but also demonstrates a replicable methodology that can be extended across the Pacific.
The collaboration illustrates UNOOSA/UN-SPIDER’s role in connecting innovative space-based solutions with the needs of vulnerable island nations, ensuring that cutting-edge technologies directly contribute to climate resilience, sustainable development goals (SDGs), and global climate reporting frameworks.
Annex: How does FlyPix AI Geospatial Analysis Platform work?
By combining a no-code approach with an intuitive interface, FlyPix AI enables you to construct personalized AI models, expediting the analysis of geospatial data.
Step 1: Upload your data
Begin by uploading your satellite or drone imagery. FlyPix AI fully supports both types of data. Alternatively, you may request data from a built in Data Market.
Step 2: Label your data
Label the objects you want to detect. You won’t need to spend hours labeling hundreds of objects; just a few labels will suffice thanks to the Visual AI Co-Pilot.
Step 3: Let FlyPix's Engine Take Over
With just a handful of labels, FlyPix’s powerful AI engine generates a robust model and performs inferences seamlessly.
Step 4: Visualize Your Results and Create Dashboards
Explore FlyPix’s extensive features, including customizable dashboards and interactive maps, to visualize your results effectively