Introduction
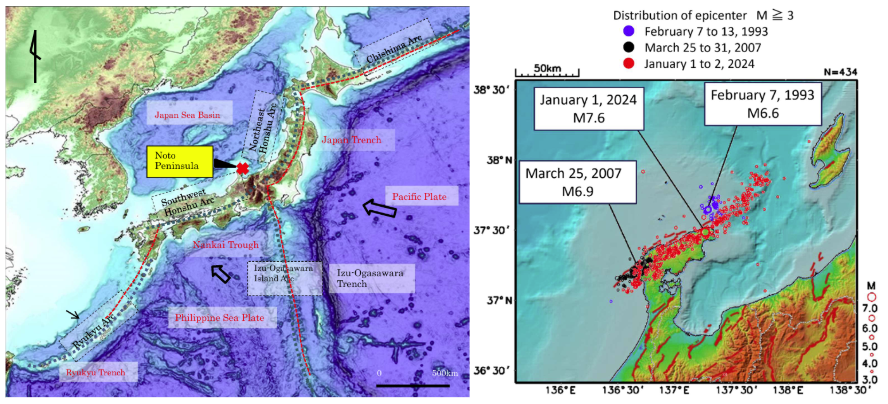
The 2024 Noto Peninsula Earthquake struck northwestern Japan on January 1, with a magnitude of 7.6 at a depth of 15 km in Ishikawa Prefecture's Noto region. It was a reverse fault earthquake with a northwest-southeast pressure axis, occurring within the Earth's crust (IAEG, 2024). Also, a tsunami of up to 1.2 m was observed. The earthquake caused many deaths, injuries, collapse of houses and buildings, fires and landslides.
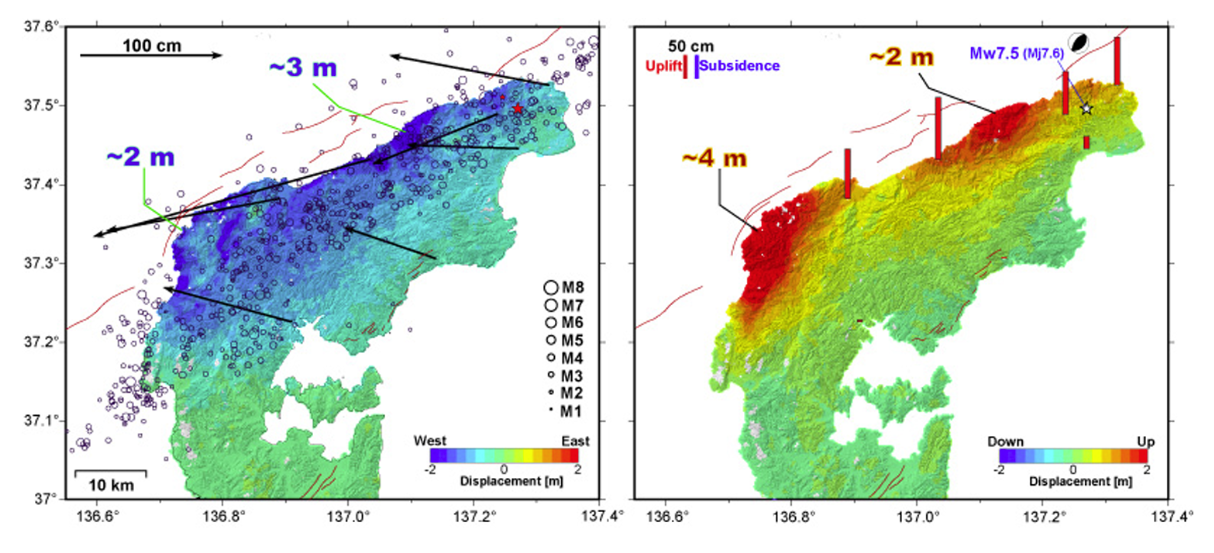
The report (GSI, n.d.-a) highlights SAR-detected ground deformation and the geodetically derived fault model. GNSS data reveal that the northern part of the peninsula, aligned in an east-west orientation, has uniformly shifted westward by up to approximately 2 meters. Significant uplifts, measuring around 1 meter, have been recorded at stations along the northern coast. While GNSS data provides a broad overview of large-scale ground deformation, SAR-based analyses using Interferometric SAR (InSAR) and pixel offset techniques offer a more detailed displacement field. The SAR-derived deformation map shows extensive uplift concentrated along the northern coast, with two prominent areas: the northwestern tip of the peninsula, where the maximum uplift reaches approximately 4 meters, and a secondary uplift zone west of the epicenter, with displacements reaching approximately 2 meters.
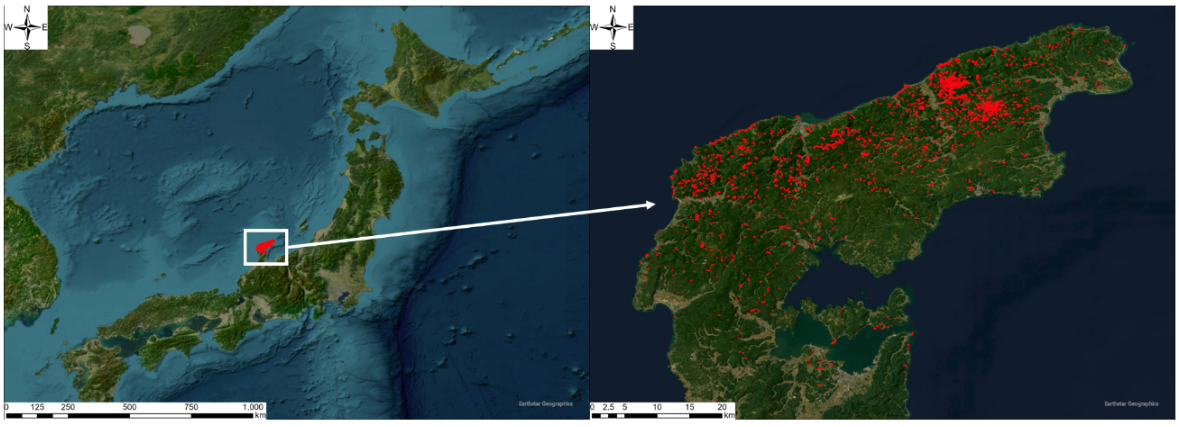
The earthquake has triggered numerous significant landslides, with initial reports estimating over 1,000, though this number is expected to increase as a comprehensive inventory is completed. These landslides have directly caused fatalities and severely impeded rescue efforts, particularly by blocking roads, which has further exacerbated the loss of life due to structural collapses.
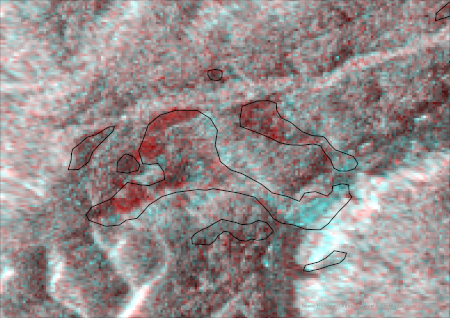
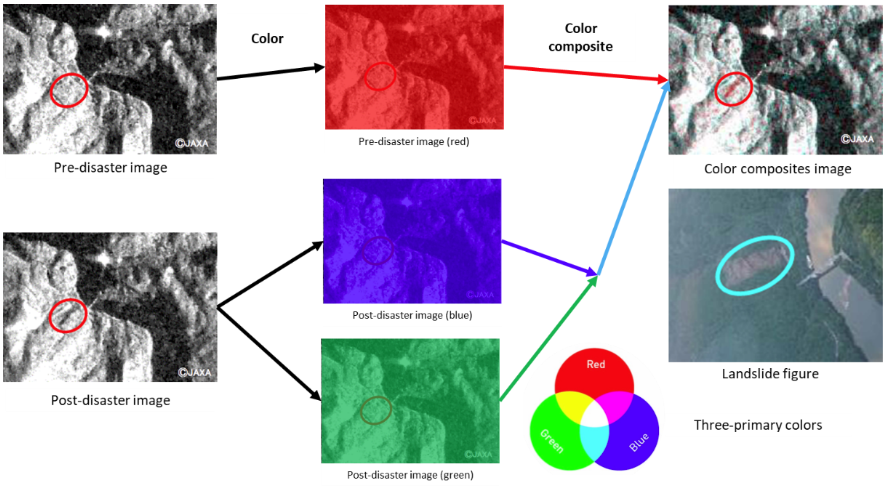
Color-composite image by pre and post radar images
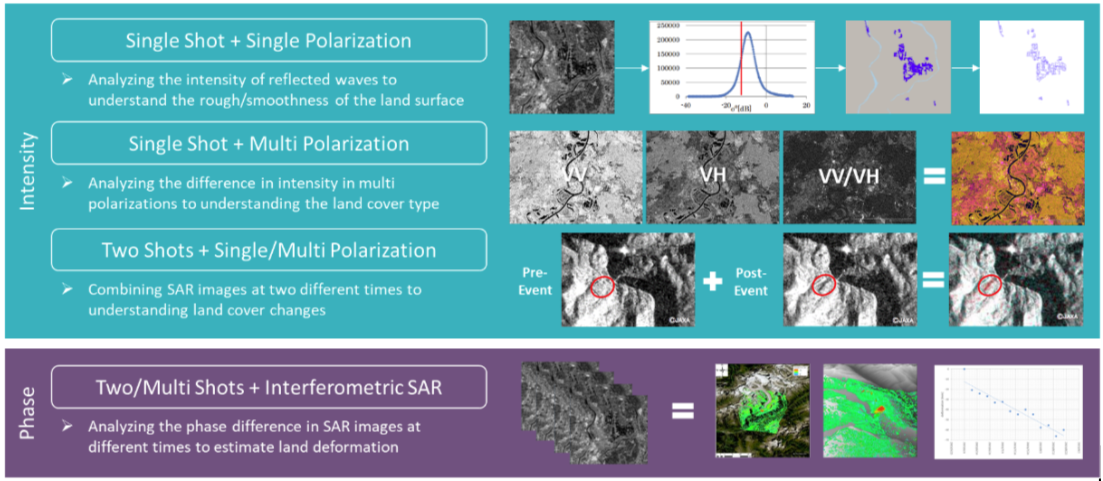
Radar satellite images have the capability of detecting the disaster location by using two features: Intensity and Phase. SAR dataset demonstrates how single-shot, single-polarization SAR data is used to analyze surface roughness and smoothness, while multi-polarization data enables better understanding of land cover types by comparing different polarizations (e.g., VH, VV/VH). By combining pre-event and post-event images, land cover changes can be identified using two-shot analyses. Additionally, interferometric SAR (InSAR) techniques, which use phase differences between two or more images acquired at different times, are shown to estimate land deformation effectively.
Creating a color-composite image using SAR (Synthetic Aperture Radar) satellite images involves combining pre-disaster and post-disaster images into a single RGB (Red, Green, Blue) composite. This technique is often used to analyze changes caused by disasters such as floods, landslides, or earthquakes.
The process described below leverages the steps of generation of radar intensity images and creation of the color-composite image to interpret the disaster area. To detect the flooding, landslide, and land emergence location, using pre and post SAR images, creating the color-composite image illustrates the results. The change detection with Color-composite bands is possible only when there is a pre-disaster image (archive) with the same conditions as the post-disaster image (orbit direction, look direction, off-nadir angle, etc.).
- Acquire SAR Data: Obtain SAR images for the pre-disaster and post-disaster periods from a relevant satellite, such as ALOS-2, Sentinel-1 or RADARSAT. Ensure the images are geometrically aligned (co-registered) to the same reference system for proper pixel comparison.
- Preprocess the SAR Images
- Radiometric Calibration: Convert raw SAR data into calibrated backscatter values (e.g., sigma nought, gamma nought). This ensures the intensity values are physically meaningful.
- Speckle Filtering: Apply a speckle filter (e.g., Lee or Frost) to reduce noise in the SAR images while preserving important features.
- Geometric Correction: Perform terrain correction using a digital elevation model (DEM) to remove distortions caused by the satellite's viewing angle and the Earth's surface.
- Co-Register the Images: Align the pre-disaster and post-disaster images to ensure that corresponding pixels in both images represent the same geographic locations. Use tools like Ground Control Points (GCPs) or automated alignment algorithms available in SAR processing software (e.g., SNAP or ENVI).
- Normalize the Image Values: Normalize the backscatter intensity values of all images (pre-disaster and post-disaster) to the same range, typically 0–255, to prepare for RGB combination. This can be done by linear stretching or histogram equalization.
- Export and Visualize
- Export the intensity images as GeoTIFF or another format compatible with GIS tools like QGIS, ArcGIS, or MATLAB for further analysis.
- Combine into a Color Composite
- Combine the normalized pre-disaster image (R), post-disaster image (G), and post-disaster image (B) into an RGB composite image using image processing software.
- R (Red Band): Use the pre-disaster SAR image intensity as the input.
- G (Green Band): Use the post-disaster SAR image intensity as the input.
- B (Blue Band): Use the same post-disaster SAR image intensity for the blue band (to maintain emphasis on the post-disaster state).
- Interpret the Composite: Analyze the colors in the composite:
- Red Areas: Represent regions where the pre-disaster signal was strong, but the post-disaster signal weakened, indicating possible flooding and landslide happened.
- Cyan Areas: Represent regions with stronger post-disaster signal, often land emergence and building or piled up soil areas.
- Gray Areas: Highlight features persistent in the post-disaster image, helping to identify unaffected areas.
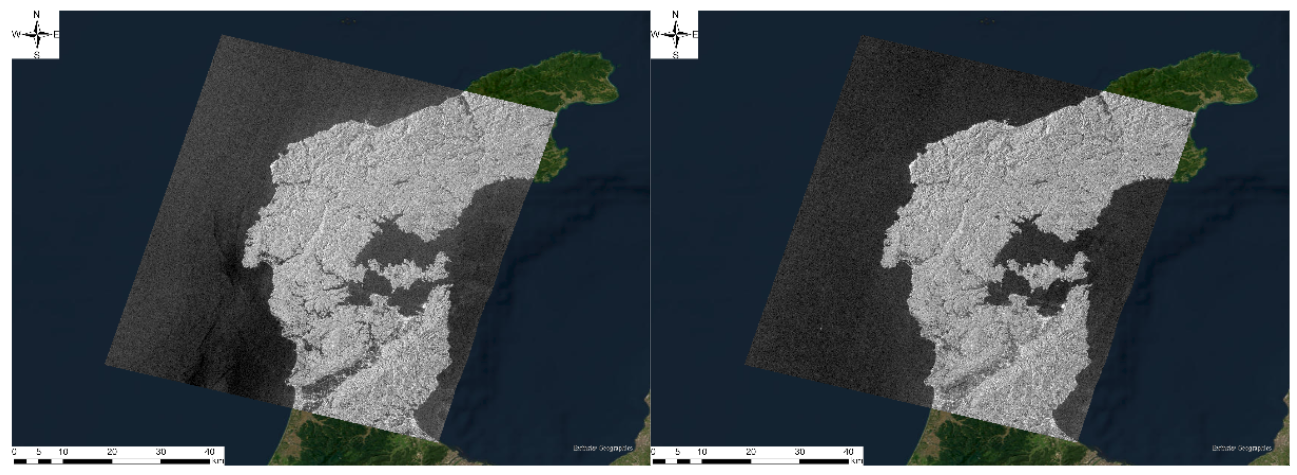
In this study, we downloaded ALOS-2 Stripmap mode data (Pre: June 6th, 2023 and Post: January 2nd, 2024) from the JAXA ALOS Series Open and Free Data website (in Japanese) (https://www.eorc.jaxa.jp/ALOS/jp/dataset/alos_open_and_free_j.htm).
Analysis Result and Comparison
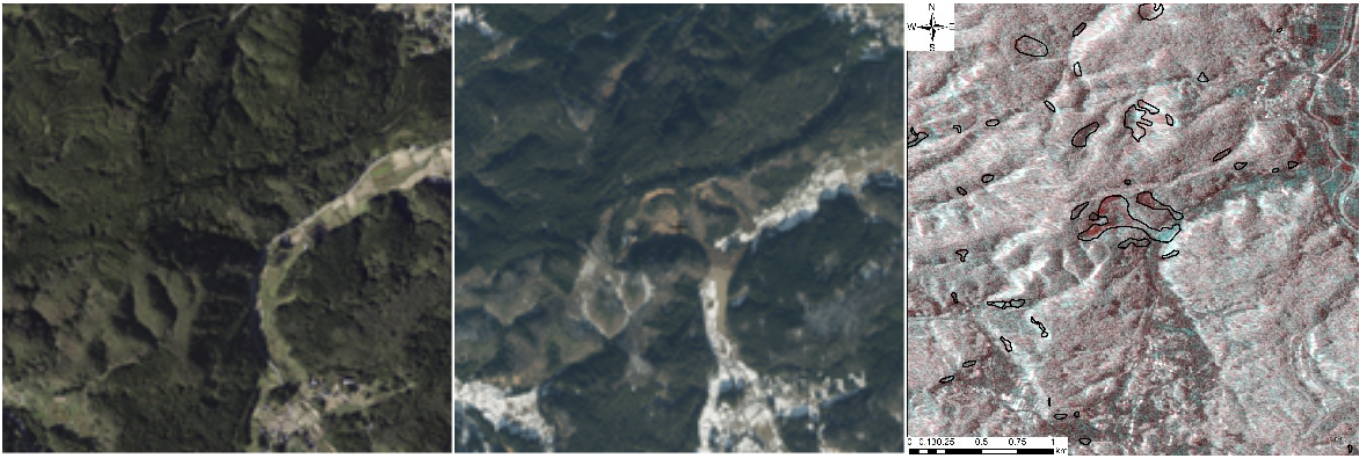
From the color-composite image, it shows the landslide at the location (37.417660, 137.070688), and then overlayed with the landslide polygons derived from the aerial photographs. The black solid lines show the landslide location and size, and the red area in the composite image matched with the landslide location.
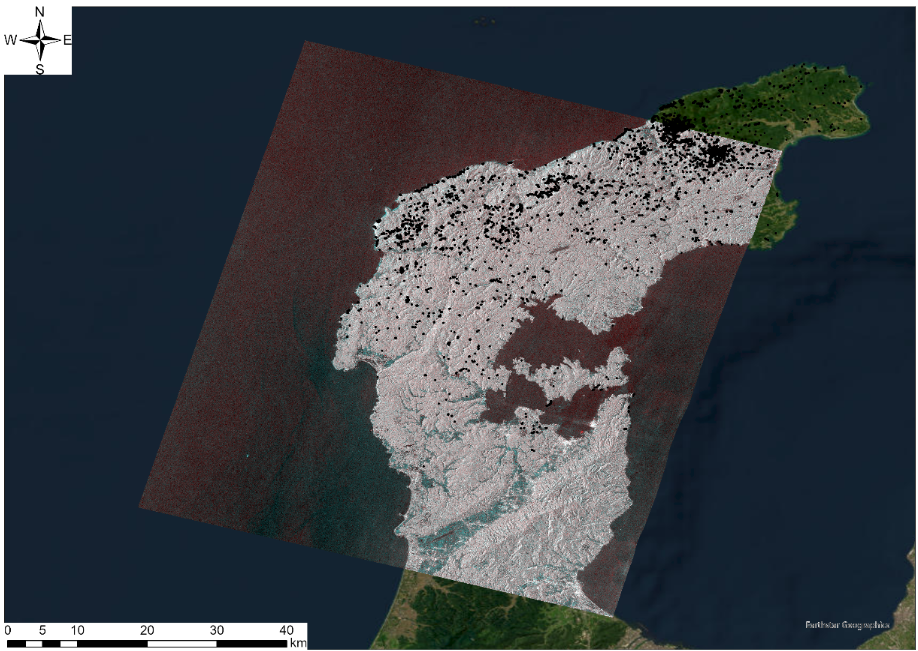
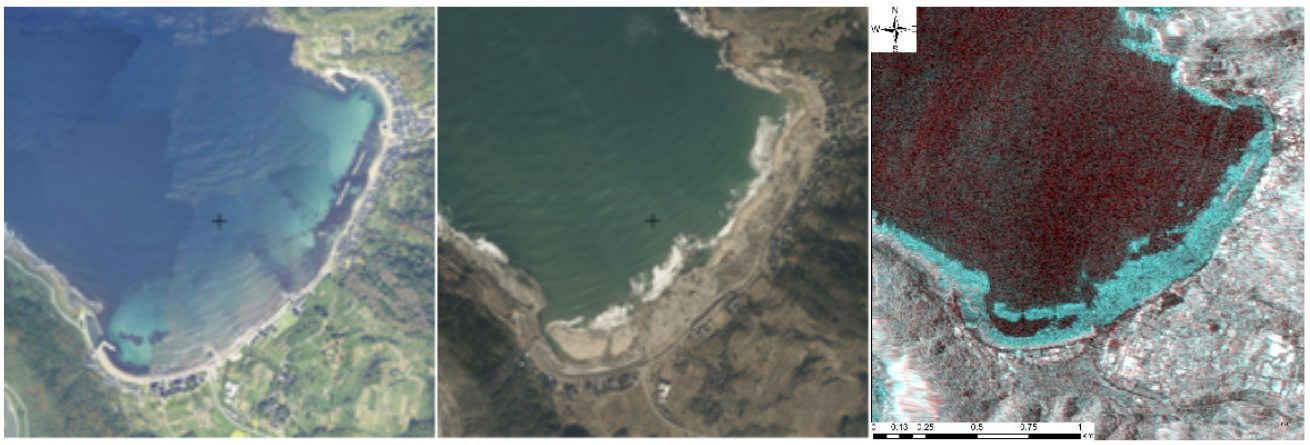
Also, around significant uplift, clear changes in the microwave backscatter of SAR intensity images were observed when comparing data acquired before and after the earthquake. The post-earthquake image reveals new land along the coastline that was not present in the pre-earthquake image. From the color-composite image, it shows the land emergence at the location (37.345655, 136.754177). Geospatial Information Authority of Japan shared the GeoJSON data for this land emergence along the coast detected by SAR images using ALOS-2 satellite data (GSI, n.d.-c).
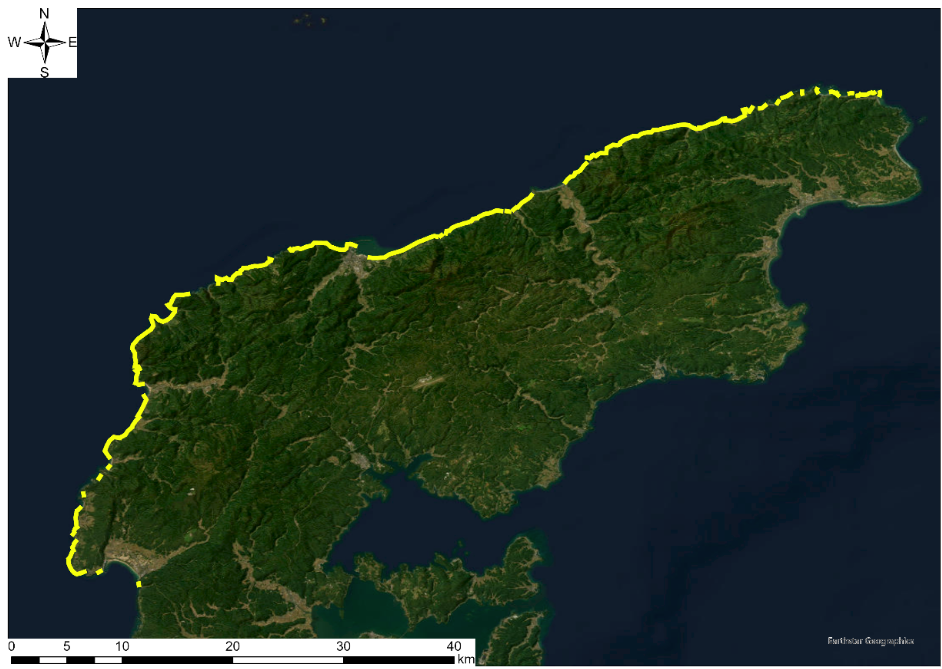
To better highlight the emergence of this land, an additive color process was applied to the SAR intensity images, resulting in an RGB composite. In this composite, areas with increased backscatter appear cyan, decreased backscatter appears red, and unchanged areas appear gray. A prominent cyan zone, indicating a substantial increase in backscatter intensity, extends along the coastal region. These findings suggest that the seafloor uplifted, causing the shoreline to shift seaward. The total length of this red zone is estimated to be approximately 90 km.
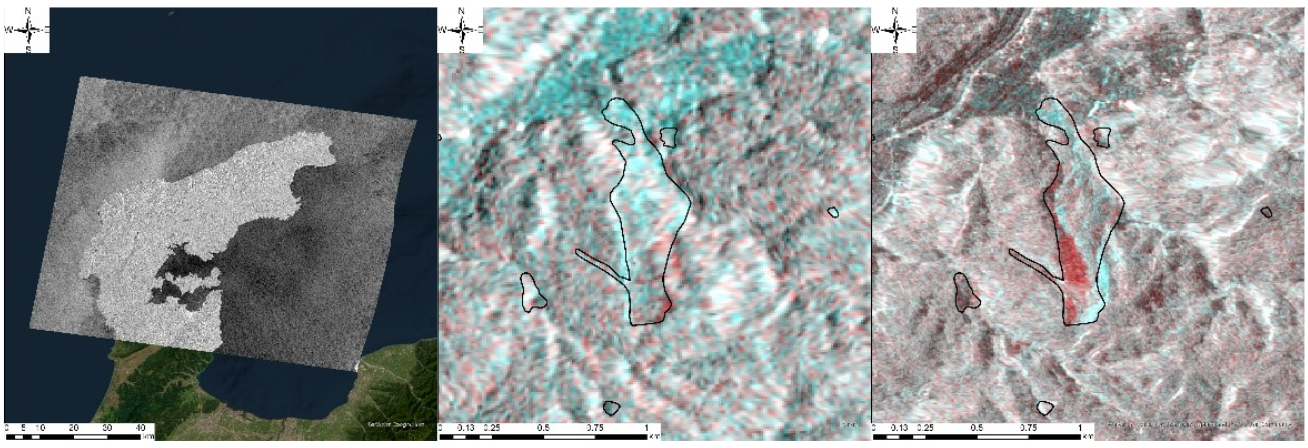
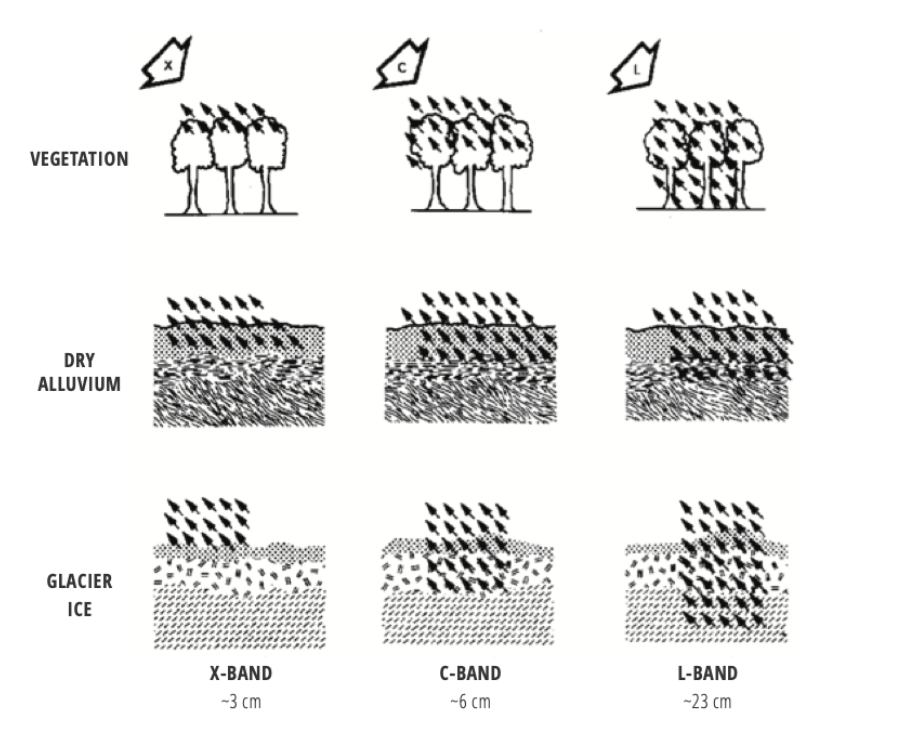
Compared with C-band SAR satellites (Sentinel-1), the result shows the difference in landslide locations, in which there are no changed colors in C-band composite image. This is because the penetration into vegetation and soils increases as the sensor wavelength becomes longer. The penetration into soil is also heavily influenced by soil moisture content. Short-wavelength sensors typically reflect at the surface of most objects. Middle-wavelength sensors reflect at the surface of larger objects. Long-wavelength sensors can penetrate the surface of objects smaller than one-quarter of their wavelength while reflecting at the surface of larger objects.
Conclusion
The 2024 Noto Peninsula Earthquake demonstrated the critical importance of utilizing advanced remote sensing technologies, such as SAR imagery, for disaster response and recovery. Through the integration of SAR-derived color-composite imagery, significant insights into landslide locations and land emergence were obtained. These findings not only enhanced our understanding of the earthquake's impacts but also facilitated effective emergency response and recovery planning. The use of SAR technology, particularly methods such as InSAR and pixel offset analysis, proved instrumental in detecting and quantifying changes in the affected areas, highlighting the value of these tools in post-disaster assessments. As remote sensing technology continues to evolve, especially recent ALOS-4 (L-band SAR satellite) and NISAR (S- and L-bands SAR satellite), its application in disaster management will undoubtedly play a pivotal role in mitigating risks and improving resilience against future natural hazards.
References
International Association for Engineering Geology and the Environment (IAEG). (2024). Brief report of the 2024 Noto Peninsula earthquake. Retrieved from https://www.iaeg.info/wp-content/uploads/2024/03/Brief-report-of-the-2024-Noto-Peninsula-Earthquake-1.pdf
Geospatial Information Authority of Japan (GSI). (n.d.-a). SAR-detected crustal deformation and topographic changes of the 2024 Noto Peninsula earthquake. Retrieved December 31, 2024, from https://www.gsi.go.jp/common/000261676.pdf
Geospatial Information Authority of Japan (GSI). (n.d.-b). Map of Noto Peninsula Earthquake damage areas. Retrieved December 31, 2024, from https://maps.gsi.go.jp/#16/37.418248/137.069893/&base=std&ls=std%7C20240102noto_wazimanaka_0102do%7C20240102noto_suzu_0102do%7C20240102noto_wazimahigashi_0102do&blend=000&disp=1111&lcd=20240102noto_wazimahigashi_0102do&vs=c1g1j0h0k0l0u0t0z0r0s0m1f0&base2=std&ls2=std%7Cseamlessphoto&blend2=0&disp2=11&lcd2=seamlessphoto
Geospatial Information Authority of Japan (GSI). (n.d.-d). Map of Noto Peninsula Earthquake damage areas. Retrieved December 31, 2024, from https://maps.gsi.go.jp/#16/37.348394/136.749294/&base=std&ls=std%7Cgazo4%7C20240102noto_wazimanishi_0111do&blend=00&disp=101&lcd=20240102noto_wazimanishi_0111do&vs=c1g1j0h0k0l0u0t0z0r0s0m1f0&base2=std&ls2=std%7Cseamlessphoto&blend2=0&disp2=11&lcd2=seamlessphoto
Satellite Applications and Operations Center, Japan Aerospace Exploration Agency, & Erosion Control Planning Division, Erosion Control Department, Water Management and Land Conservation Bureau, Ministry of Land, Infrastructure and Transport. (2008, March). Guidebook for satellite applications in disasters: Landslide disaster edition. Retrieved from https://www.mlit.go.jp/common/001227722.pdf
Geospatial Information Authority of Japan (GSI). (n.d.-c). Introduction to space geodesy. Retrieved December 31, 2024, from https://www.gsi.go.jp/uchusokuchi/uchusokuchi-e31001.html