")
Taal volcano in the Philippines experienced a large eruption in the middle of January 2020. The deformation of the greater caldera and its surroundings was analysed using differential SAR interferometry (DinSAR) days before and after the eruption. A separate analysis of the deformation of the inner cone of the volcano was conducted during the six months just before the eruption of January 2020. The analysis was carried out using the “Short Baseline Subset (SBAS)” technique. This user story presents the methods used and the results obtained.
Taal volcano (Philippines)
The Taal Volcano is located 50 km away from the city of Manila, Philippines. On 12 January 2020, a series of phreatic explosions took place, accompanied by increasing seismic activity characteristic of volcanic activity.
Morphology
Taal volcano is the result of the last eruptive phase of the complex volcanic caldera; which is divided into at least two areas. Some experts believe that the caldera stemmed from a single event, while other experts believe that this complex volcanic structure is the result of the fusion of two ancient volcanic calderas. According to researchers of the United States Geological Survey (Newhall and Dzurisin, 1988), the current morphology of the volcano is a remnant of several ancient stratovolcanoes. Inside the current crater there is a small lake that has been modified throughout the centuries.
Data and methods
Due to the tectonic complexity of this volcano and the extensive area covered by the volcanic caldera, two differential interferometry techniques were used. First, a conventional Differential Interferometry (DinSAR) technique was applied to analyse the larger caldera and its surroundings. This analysis was conducted using two radar images from 11 and 17 January 2020; before and after the eruption. Figure 1 shows the resulting differential interferogram. It was possible to detect evidence of growth or uplift of the main volcanic caldera that borders the more active part of the Taal volcano in the island inside the caldera. This is represented through a series of coloured concentric rings around the main caldera. One full-colour cycle represents 2.5 cm of deformation, this is equivalent to the radius of the wavelength of band C (λ=5 cm) at which the Sentinel-1 sensor works. In the figure, there are areas where the deformation is larger (where the coloured rings are closer to each other) and other areas where there is less deformation (where the distance between the coloured rings is larger).
Figure 1 also presents the location of epicentres of earthquakes at the time of the eruption of January 2020 (blue-coloured circles) and those areas where the Philippine Institute of Volcanology and Seismology (PHIVOLCS) conducted field work and detected fractures in the ground (black triangles).
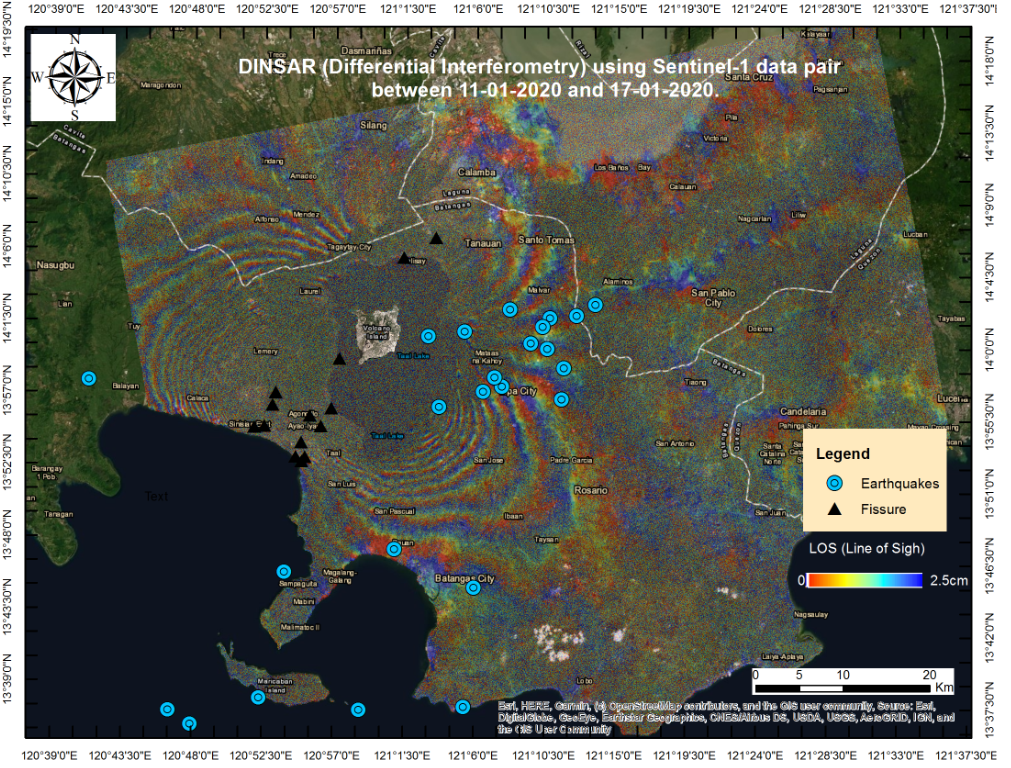
Figure 1. Differential interferogram (DinSAR) map using Sentinel-1 data for the period 11-01-2020 / 17-01-2020. Black triangles: ground fractures reported before, after and during volcanic eruptive phase. Blue points: seismic epicentre (Source: Philippine Institute of Volcanology and Seismology (PHIVOLCS)).
In addition, a multitemporal SBAS analysis (Short Baseline Subset, Berardino et al., 2002) was carried on the cone of the active volcano inside the caldera using radar imagery covering the period from July 2019 to January 2019. This analysis was conducted with 18 Sentinel-1 images acquired during its ascending orbit. An SRTM Digital Elevation Model (90 m resolution) was used to remove the existing topography. Thus, it was possible to detect evidence of uplift and subsidence during pre-eruptive phase. Uplift and subsidence are processes that can be detected in active volcanoes prior to their eruption (Holohan et al., 2017).
Results from the SBAS analysis
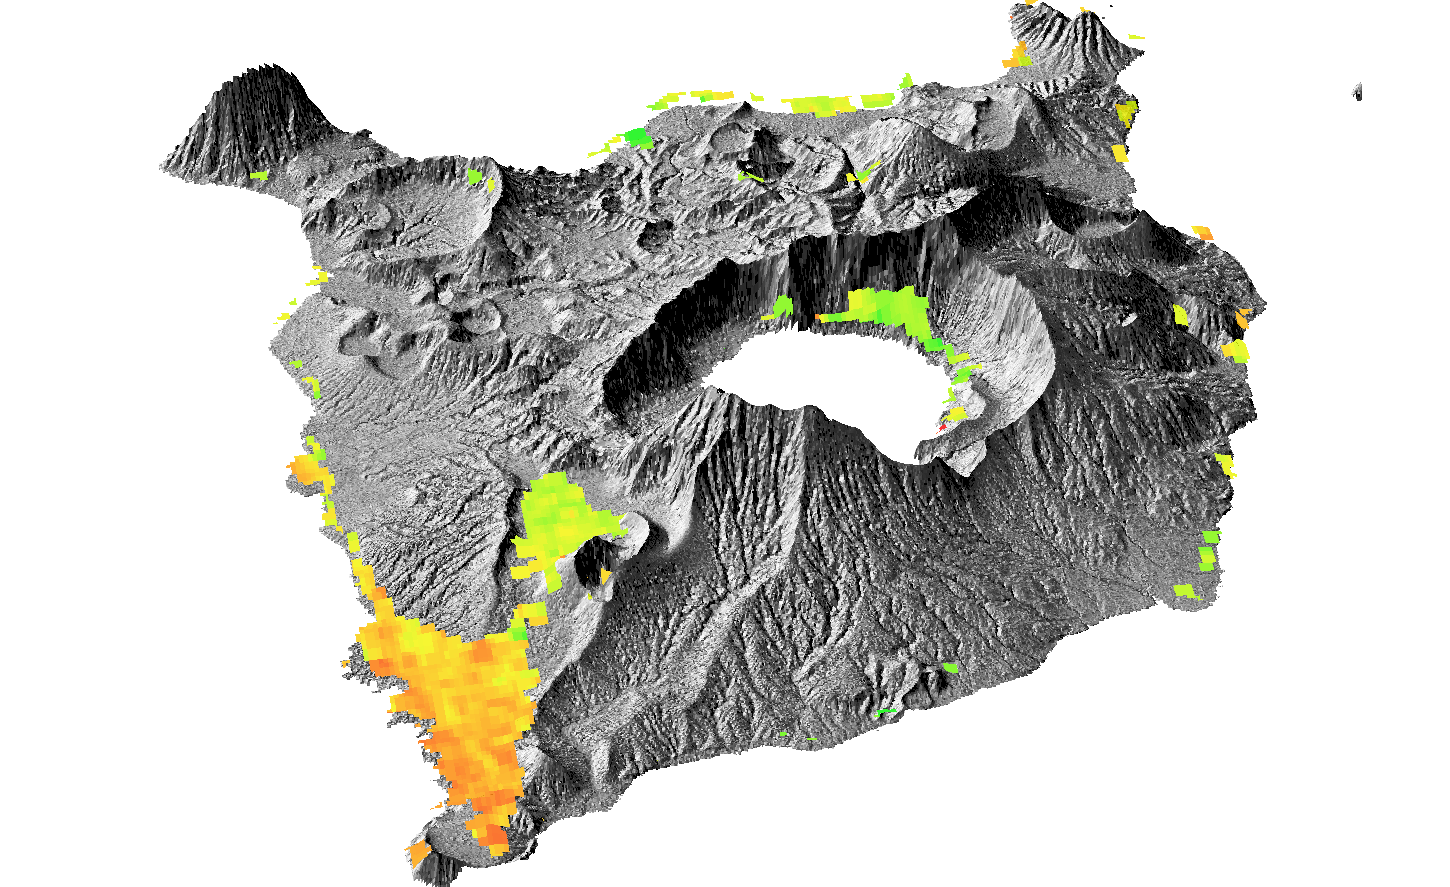
Using the SBAS analysis it was possible to detect a maximum deflation process of up to -91 mm in the southwestern flank of the outer side of the crater, with a northeast-south west orientation. This deflation or subsidence is represented with orange and red-coloured pixels. In addition, a small area presenting an uplift was detected closer to the rim of the crater. This is represented with green-coloured pixels. This uplift has a maximum displacement of 37mm. Another area experiencing upift or inflation was detected in the northeast shore of the lagoon of the small crater-lake (again represented by green pixels with mean maximum values of +197 mm), which matches with the magmatic material released by the eruption. These features are presented in figures 2a and 2b.
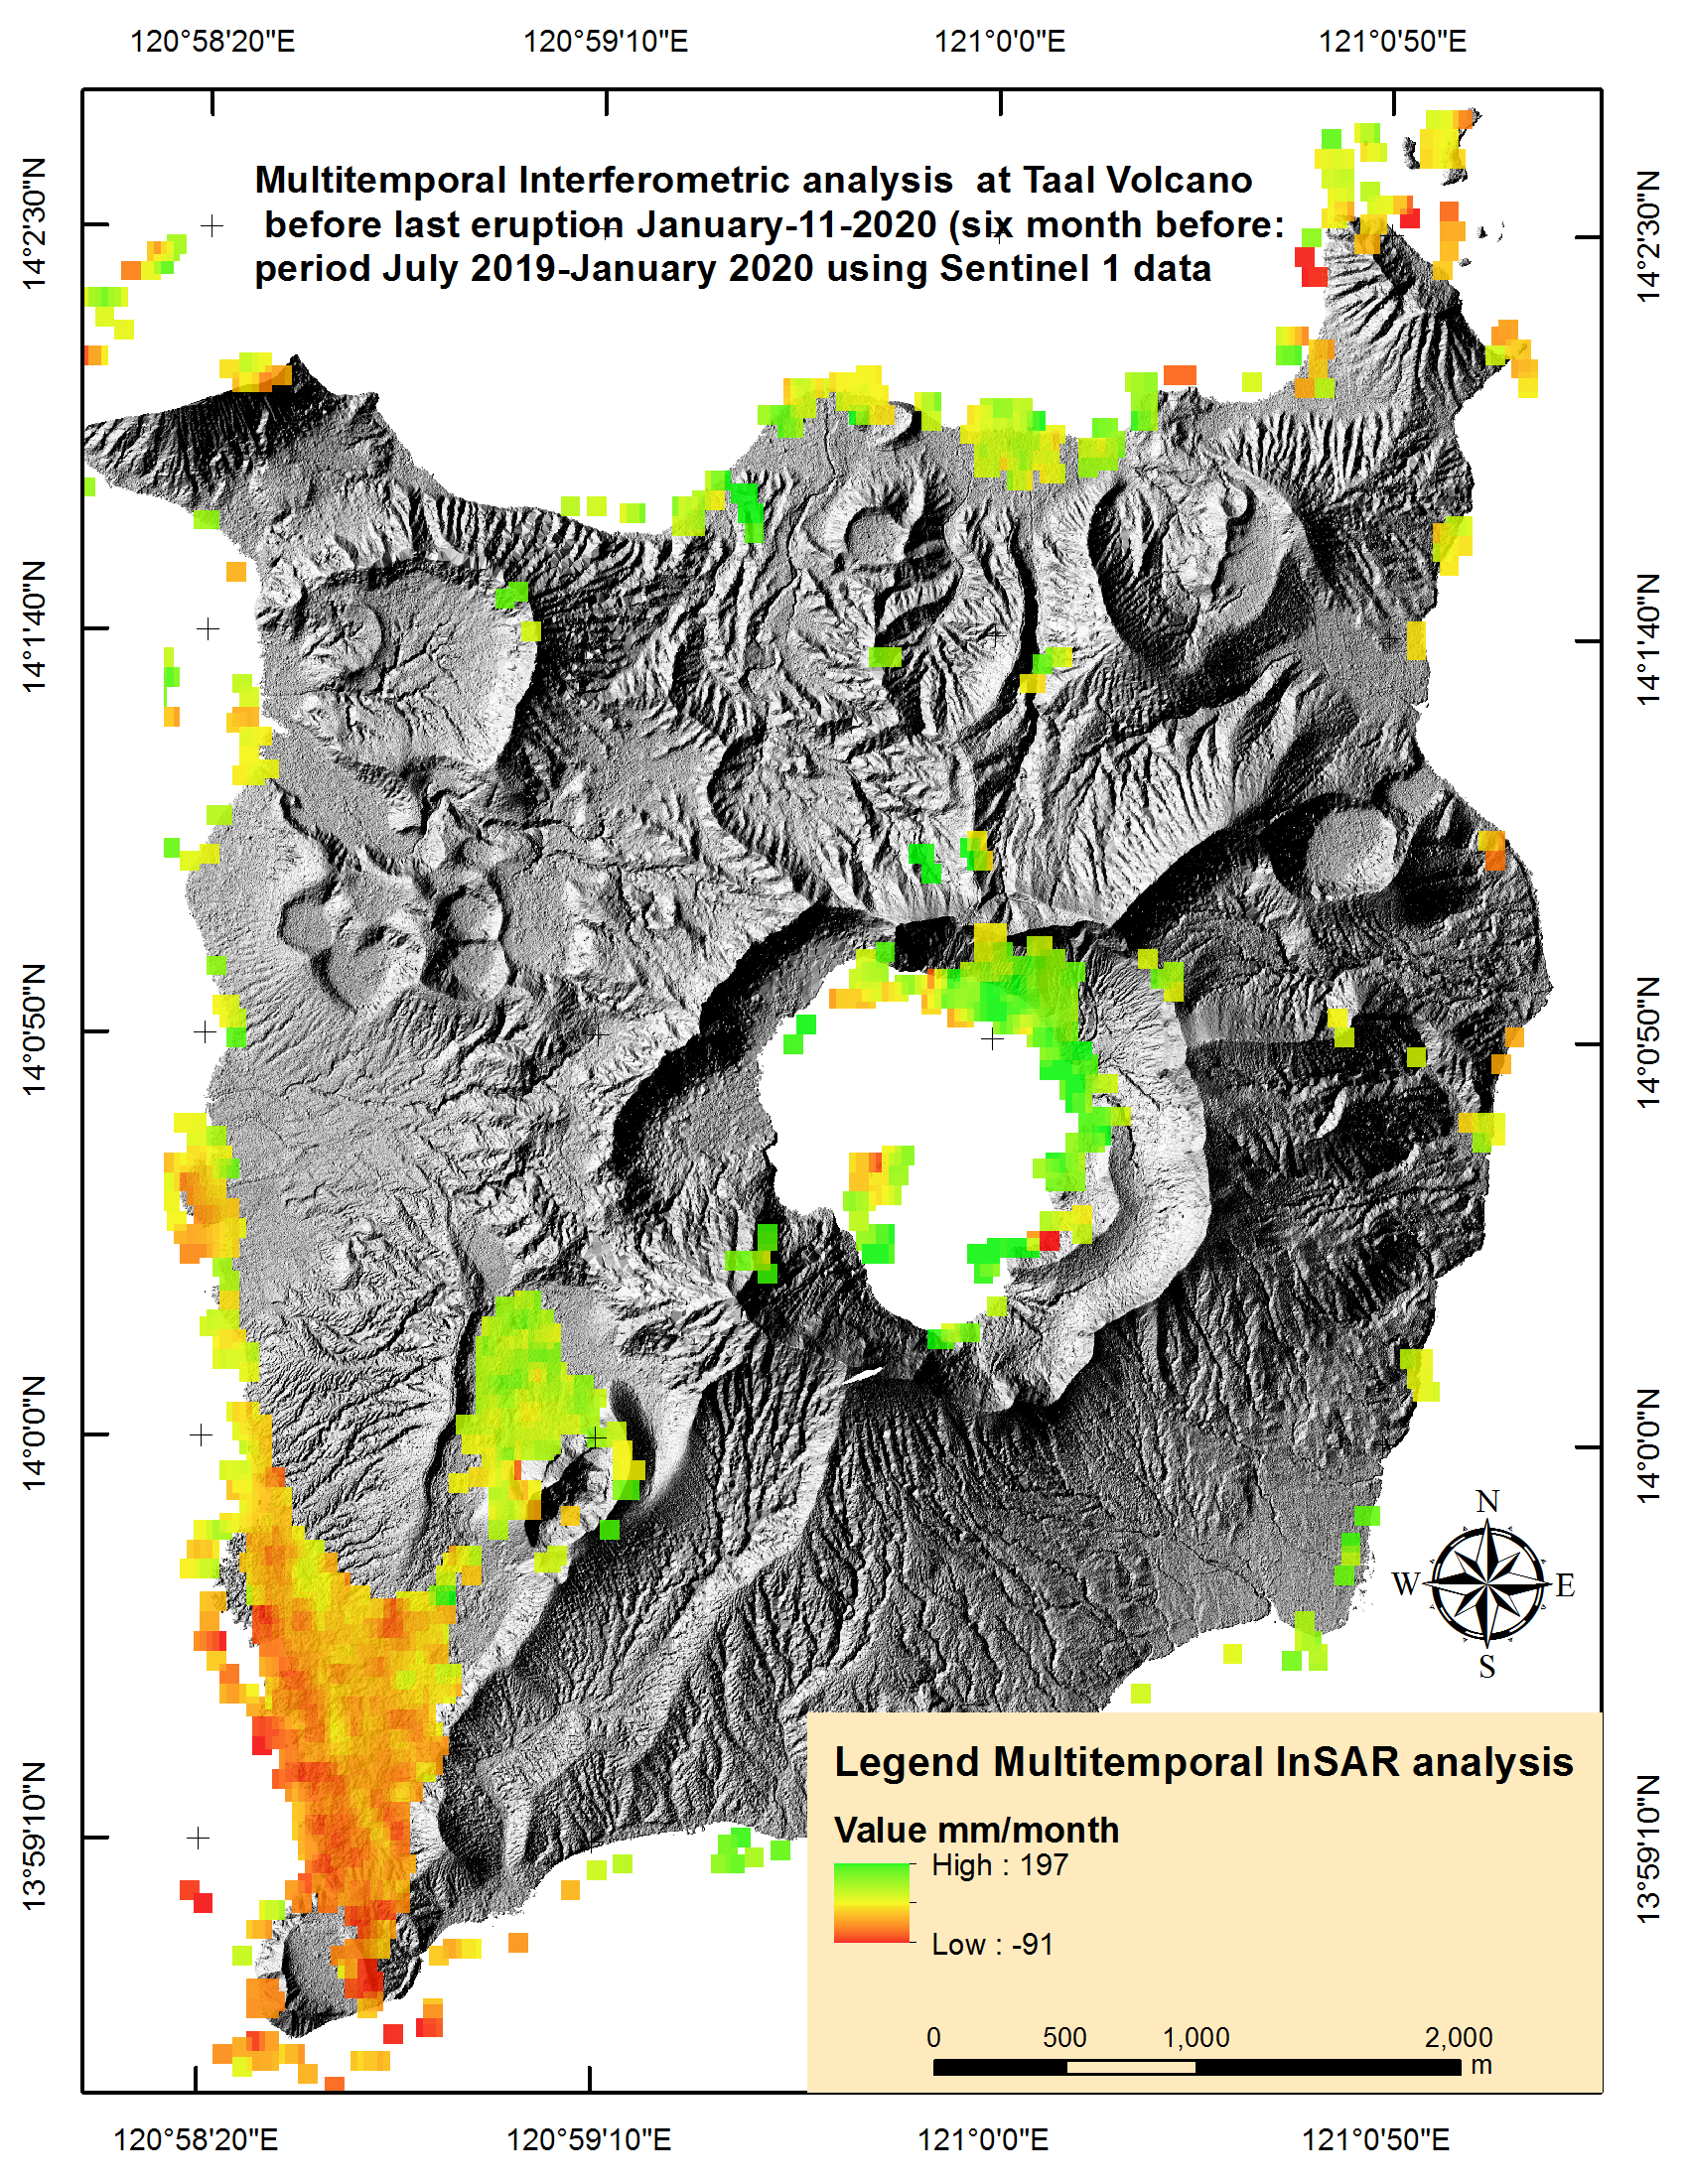
It is important to note that the detection of deformation could only be achieved in few areas of the cone. The vegetation cover throughout the cone has been one of the factors that has inhibited the coherence among all pixels in all radar images. This vegetation cover has limited the capacity to identify other areas where there was positive (uplift) or negative (subsidence) deformation. These areas where it was not possible to detect deformation are presented with grey-coloured pixels in figures 2a and 2b.
As in the case of other active volcanoes, this analysis has displayed the strength of the high periodicity of revisit of the Sentinel 1 satellites. This high periodicity allows for its satellite images to be used with these DinSAR and SBAS methodologies in early warning applications in case of volcanic activity.
References
Newhall, C. G. and Dzurisin. D. (1988). Historical Unrest at Large Calderas of the World. Volumen 1. Bulletin No. 1855 of the United States Geological Survey (USGS).
Holohan. E; Sudhaus. H; Walter. T; Schöpfer. M. P; Walsh. P. (2017). Effects of Host-rock Fracturing on Elastic-deformation Source Models of Volcano Deflation, Scientific Reports, 7: 10970. DOI:10.1038/s41598-017-10009-6
P. Berardino, G. Fornaro, R. Lanari, and E. Sansosti. (2002). A new algorithmfor surface deformation monitoring based on small baseline differentialSAR interferograms. IEEE Trans. Geosci. Remote Sensing, 40, 2375–2383.
Acknowledgements
This research was undertaken jointly by the Autonomous University of the State of Mexico (UAEMEX) and UN-SPIDER and benefited from the support provided by the Mexican Council of Science and Technology (CONACYT).