
Various phenomena and processes such as earthquakes, geological phenomena, ice motion, changes of groundwater flow by aquifer overexploitation and hydrocarbon extraction have as a consequence the deformation of the Earth's surface, which modifies its physical parameters. These can be either topographic (relating to the arrangement of shapes and features of the surface of the Earth), geological (affecting the composition of rocks) or hydrological (affecting water distribution in an area). Large earthquakes cause instantaneous land deformation and can strongly modify the physical environment, influencing the hydrological and hydrogeological circulation, trigger mass movements and cause a great damage in infrastructure. Land subsidence, the differential movement of ground could be caused by geological instabilities at different depths, and this phenomenon is a gradual settlement of soil that causes among others inundation of land, expansion of flooding areas, disturbance of drainage system, changes in slopes and damages to the foundations of infrastructure in urban areas. To prevent or reduce the wide-ranging social, economic, environmental and infrastructural consequences, an understanding of the relationships and interactions between human and natural phenomena is needed.
In order to support decision making related to land deformation and the temporal effects of the phenomenon, timely and accurate change detection of Earth's surface is essential. Multi-temporal datasets of both ground measurements and satellite data are often applied. Remote sensing data has been extensively used in the last decades for change detection because of the repetitive data acquisition and wide coverage. One powerful technique is Synthetic Aperture Radar (SAR) Interferometry (InSAR) that enables the measurement of small-scale surface deformation. This method uses two or more Synthetic Aperture Radar (SAR) images to generate differential interferograms that allow to measure the rate of ground deformation in cm/year and that can be successfully used for monitoring natural hazards, such as volcanoes, earthquakes, landslides and subsidence.
Content
1. SAR
1.1 SAR Image
1.2 Phase
1.3 Satellites with SAR instruments
2. SAR Interferometry
2.1 Basics
2.2 Details
2.3 Conditions
3. Differential SAR interferometry (DInSAR)
3.1 Basics
3.2 Interpretation of interferogram
3.3 Details
4. Deformation monitoring examples
4.1 Earthquakes
4.2 Volcanoes
4.3 Land subsidence
Data Sources
Software and Tutorials
Bibliography
1. SAR
Radio detection and ranging (radar) refers to a technique and an instrument. Radar as an active remote sensing instrument emits a pulse of electromagnetic radiation to the Earth's surface and measures the backscattered signal. An object scatters an incident wave into all possible directions with varying strength and with a different scattering pattern depending on the incident direction and backscatter is the portion of the scattered energy that is directed to the radar receiver. The amplitude and phase of the backscattered signal that is measured depends on the physical and electrical properties of the target. The range (the distance of target and radar) and the backscatter intensity of the detected objects can be determined by the radar technique which uses the two-way travel time (travelling to the object and back to the receiver) of the emitted pulse.
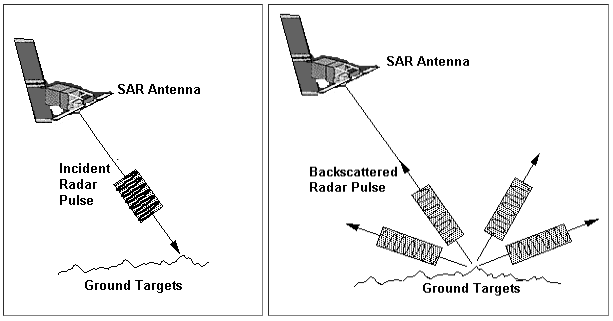
A radar pulse is transmitted from the antenna to the ground (left image) and it is scattered back to the antenna by the ground targets (right image). Image: CRISP.
Synthetic aperture radar (SAR) is a microwave imaging system with a side-looking imaging geometry (the pulses that it emits hit the Earth's surface at an angle). It has also cloud-penetrating capabilities and it is operational at day and night. SAR uses the forward motion of the spacecraft to synthesize a longer antenna that improves the spatial resolution of the images. Particularly, any target is illuminated by several hundred radar pulses during the time that the SAR sensor travels over it and the result is a high-resolution image that is equivalent to one that would have been collected by a radar with a much larger aperture (size of the antenna). This "synthetic aperture" is equal to the distance travelled by the spacecraft, while SAR is collecting information about the target.
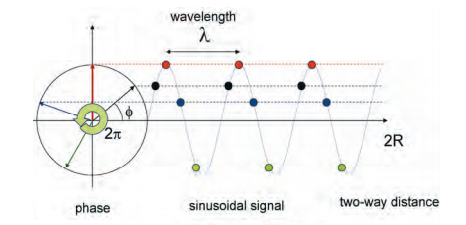
The relationship among amplitude, phase and wavelength of a radar signal. Image: ESA.
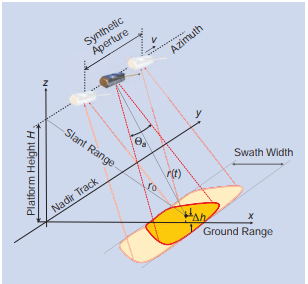
SAR imaging geometry. Image: Moreira et al., 2013.
1.1 SAR image
Successive pulses of waves are emitted to create a SAR image that can be seen as a mosaic of pixels. Each pixel gives a complex number that carries the amplitude (strength of the reflected signal, and in particular the height of electromagnetic wave) and phase (position of a point in time on a waveform cycle) information of the received signal from that resolution cell (pixel). The detected SAR image is visualized as a 2-D reflectivity map of the imaged area in grey scale. The targets with a high backscattered signal, such as exposed rocks and urban areas appear bright, in contrast to flat smooth surfaces that are dark as the radiation is mainly mirrored away from the radar. The two dimensions of the image are the range and azimuth which correspond in a satellite geometry to cross-track and along the track directions.
An ERS SAR Image in which urban areas appear bright, vegetated areas have an intermediate tone and water appears dark. Image: CRISP.
1.2 Phase
The phase of each pixel represents the phase difference between the emitted and received signal. Since the phase of the outgoing wave is known, it can be compared to the phase of the returned wave. The phase of the received signal is related to the distance of the sensor and the target as the length of the path to the target and back consists of whole wavelengths plus some fraction of wavelength. This extra fraction of wavelength is measured to great accuracy. The phase is the sum of the contributions of a number of effects, the two-way travel path (sensor - target - sensor), the interaction between the incident electromagnetic waves and the scatterers within the ground resolution cell, and the phase shift induced by the processing system used to focus the image. Hence, the phase of change from one pixel to another within a single SAR image looks random and is of no practical use. However, the phase difference of two SAR images from slightly different viewing angles can be usefully exploited to generate the topography and monitor terrain changes.
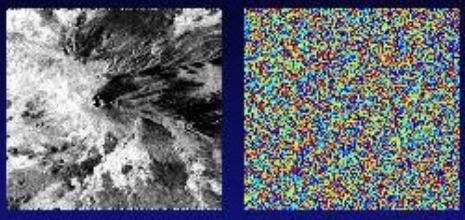
The amplitude (left image) and phase (right image) of the backscattered signal over Mountain Etna. The topographic pattern can be recognized in the amplitude image whereas the phase image looks random. Image: http://epsilon.nought.de/tutorials/insar_tmr/img35.htm.
1.3 Satellites with SAR instruments
The SAR satellites operate in designated frequencies with L-band, C-band and X-band being predominant. For the different frequencies, different information is acquired since for example, the lower frequencies correspond to longer wavelengths that can penetrate dense vegetation. The first satellite with an imaging SAR system was SEASAT that was launched in 1978. That sensor made the start of the following successful missions of ERS-1/2, Radarsat-1/2, Envisat, Risat-1, Sentinel-1 operating in C-band, JERS, ALOS, ALOS-2, SOACOM-1 operating in L-band and Cosmo-SkyMed, TerraSAR-X, PAZ, KOMPSAT-5 operating in X-band.
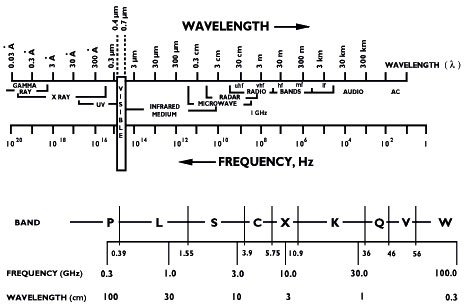
The range of electromagnetic radiation and radar frequency bands. Image: ESA.
2. SAR Interferometry
2.1 Basics
The comparison of the phase of two or more radar images of a given scene acquired from slightly different positions or at different times is the basic idea of the SAR interferometry. SAR interferometry enables the accurate measurement of surface topography, ground deformation and subsidence with centimetric accuracy. It is based on processing a pair of images and the result is a map of the differences of the reflected signals over a specific area. So if there is not any land deformation between two images, the phase difference of the images (interferometric phase) showed in the interferogram can give information about the relative terrain altitude. The flattened interferogram, as it is called, is an image with coloured fringes that shows the relative displacement between the first and second acquisitions and the different colours represent the different phase values from - to .
2.2 Details
Interferometry is a technique which uses the phase information retrieved from the interaction of two different waves to retrieve temporal or spatial information on the waves propagation. The radiation transmitted from the radar reaches the ground and is scattered back to the receiver and the slant range (line of sight distance between the radar and the target) can be determined based on the travel time of the wave (equation ). Scatterers at different distances from the instrument introduce different travel times (t) and t equivalent to phase change () between the transmitted and received signals that is proportional to the distance of the radiation divided by the transmitted wavelength () (). Thus, as the phase of each pixel contains information about the range to a small fraction of the wavelength, the path length differences can be detected with centimetric accuracy. However, travel distances that differ by an integer multiple of the wavelength introduce the same phase change, due to the periodic nature of the signal and hence the phase of SAR signal is a measure of the last fraction of the travel distance. This imposes a challenge as the measured range difference is ambiguous with the wavelength and can be resolved using the process of phase unwrapping.
Based on the interferometric configuration (image) and the geometrical relationships between two phase observations, the topographic height and surface deformation estimates can be derived. In other words, the interferometric phase of each pixel supposing that there is one dominant scatterer that does not change over time depends only on the difference in the travel paths from each of the two SARs ().
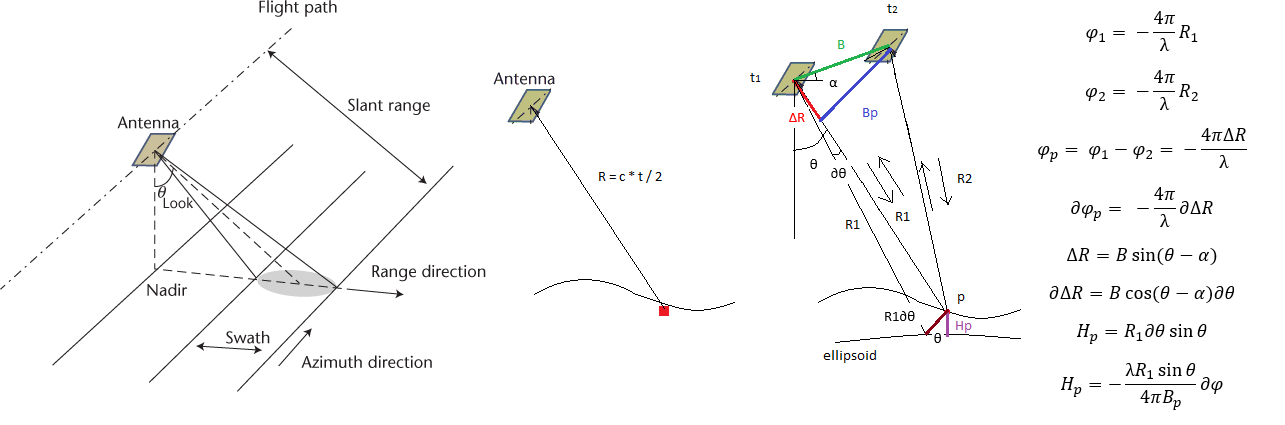
SAR imaging geometry (left image), Determination of the slant range (distance between radar and target) as (middle image) and InSAR geometry based on which the height of point P (Hp: topographic height) is determined B is the baseline (orbit distance), Bp is the perpendicular baseline (projection of perpendicular baseline to the slant range), is the look angle of the satellite.
The interferogram includes a phase trend that is caused by the fact that the terrain surface is not flat and thus the flat Earth phase, as it called, should be removed. The result is the flattened interferogram which is a phase map providing an ambiguous measurement of the relative terrain altitude. The height of ambiguity, which is the altitude difference that generates an interferometric phase change of can be derived from the last equation of image as []. Phase unwrapping is the process of adding the correct integer multiples of to the interferometric fringes in order to get a measurement of the actual altitude variation. This is the first step in acquiring a DEM.
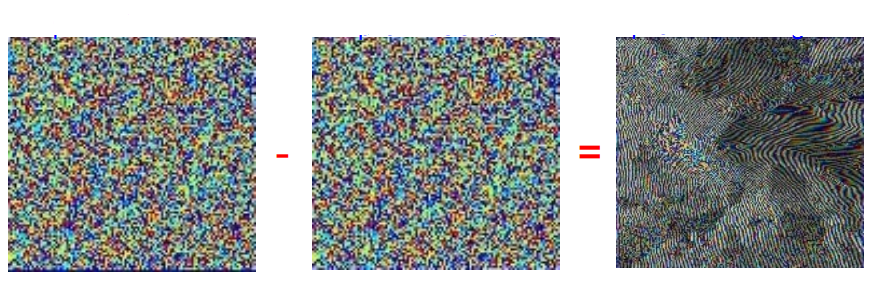
The subtraction of the second phase image from the first gives the interferogram in the right. Images: http://epsilon.nought.de/tutorials/insar_tmr/img35.htm.
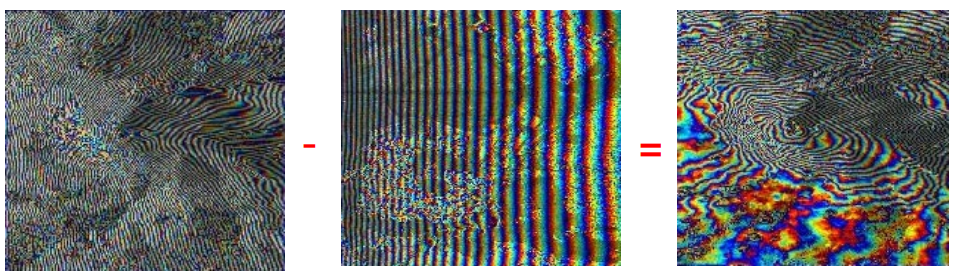
The first interferogram (left image) contains the contribution of the flat earth phase (middle image) and after its subtraction, we get the flattened interferogram (right image). Images: http://epsilon.nought.de/tutorials/insar_tmr/img35.htm.
2.3 Conditions
Interferometry can be performed under certain conditions and one of the most important is coherence. An area that keeps the same homogeneous reflective features, and the interaction with the radar pulse is constant, is considered coherent (e.g urban areas). Loss of coherence can occur for example when the time interval between the two acquisitions is long. Other limitations of SAR interferometry are that images have to be acquired by the same sensor and in the same acquisition mode, along the satellite's nominal orbit, and the acquisitions must be below a critical value that depends on the sensor.
3. Differential SAR interferometry (DInSAR)
3.1 Basics
In the case that there was a surface movement (land deformation) between the two radar acquisitions, the flattened interferogram contains information about the topography and the deformation. Differential InSAR is the process of removing the topography from the flattened interferogram in order to get the land deformation signal.
Displacement is derived from the phase shift of two SAR acquisitions. Image: Schindler et al., 2016.
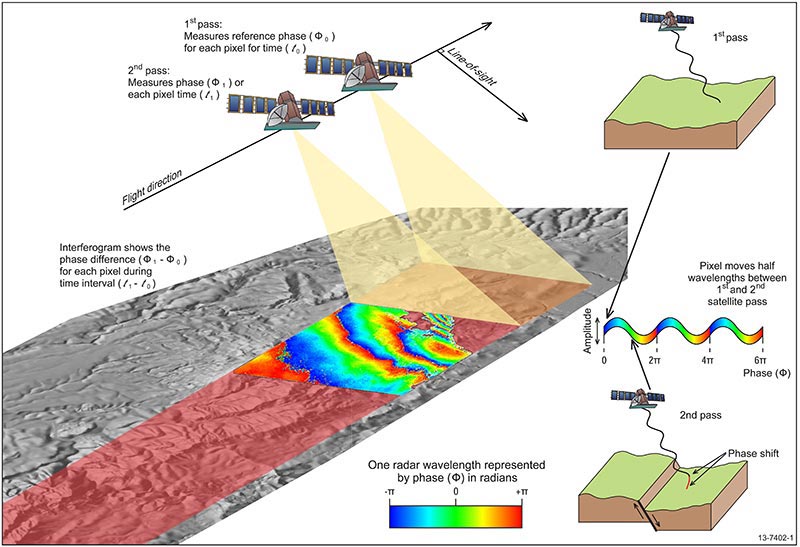
An interferogram created by using two SAR images that are acquired in two different times and maps the phase shift caused by a movement of the surface between the two acquisitions. Image: Geoscience Australia.
3.2 Interpretation of interferogram
The amount and pattern of deformation in an interferogram are shown using a colour cycle from red to blue. Each fringe, or colour cycle, represents a change in the distance of satellite to ground equal to half of the radar wavelength. By multiplying the number of fringes between two points by half of the wavelength, the relative displacement of the two points along the sight of view of the radar can be found. The sequence of colours red-yellow-blue of the fringes from the centre of the pattern indicates that the target moved away from the satellite, and for the reverse order blue-yellow-red indicates that the target moved towards the satellite. If the satellite is travelling from the North towards the South (descending orbit) the target moves away from the satellite when there is either subsidence or a westward move and towards the satellite, if there is uplift or an eastward move. On the contrary, if the satellite is travelling from the South to the North (ascending orbit) then the target moves away from the satellite when there is subsidence or an eastward move and towards the satellite, if there is uplift or a westward move. In order to be able to distinguish and measure the true vertical and horizontal deformation more information is required. The closer the fringes are, the greater the strain on the ground. The interference fringes with the same colour in the same colour cycle represent the same amount of relative deformation.
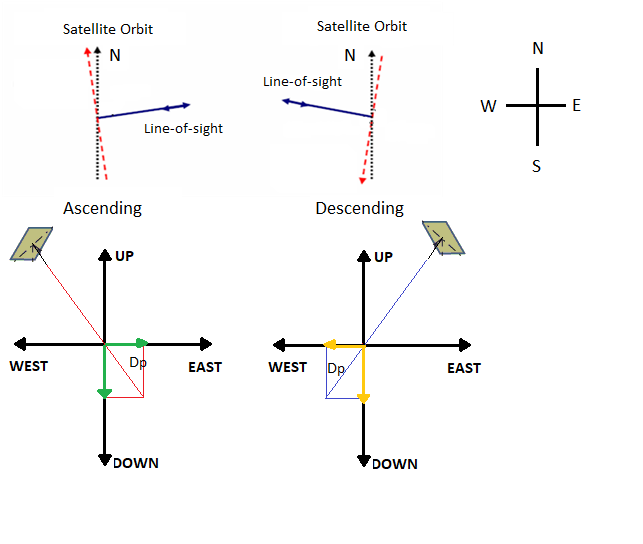
Geometries of ascending (northward) and descending (southward) satellite line-of-sight (top) and deformation and movement of target away from the radar is subsidence/eastward motion for ascending orbit and subsidence/westward motion for descending orbit
3.3 Details
The original interferogram is composed of several parts including, among others, the topographic phase, the flat Earth phase and the possible deformation phase, because, by combining images from different overpasses (multi-pass interferometry), a baseline, a path difference due to satellite track separation, is present. In this case, the interferometric phase contains a contribution of topography which can be taken into account through the use of a digital elevation model (DEM) and thus, in order to measure the ground deformation, the topographic phase should be removed from the flattened interferogram. For that reason a differential interferogram is constructed either by using (i) a two-pass method, in which an external digital elevation model (DEM) is used and subtracted from the interferogram, and (ii) a three-pass method, in which another SAR acquisition is used to create a topographic pair with one of the other two acquisitions and it is assumed that the pair has no deformation and the interferogram of the topographic pair is subtracted from the interferogram of the deformation pair. The accuracy of the DEM needs to be in the same order of magnitude or better than the phase sensitivity of the interferometric baseline. In addition, phase noise due to temporal decorrelation and variations in the propagation medium because of atmospheric delay is present in the interferogram.
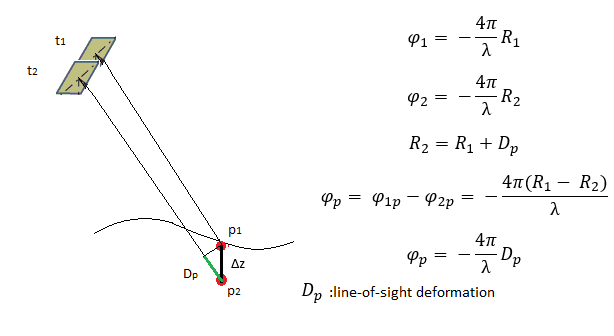
Relationship of phase and deformation in the line-of-sight
4. Deformation monitoring examples
4.1 Earthquakes
The earthquake deformation field measured by InSAR is the projection of ground displacement associated with the seismogenic fault in the line of sight (LOS) of the satellite. The deformation due to earthquakes is mostly horizontal and along the fault on which the earthquake occurs. Thus, other sources of information are needed to assess if there are both horizontal and vertical movements, as InSAR can detect movement towards or away of the satellite.
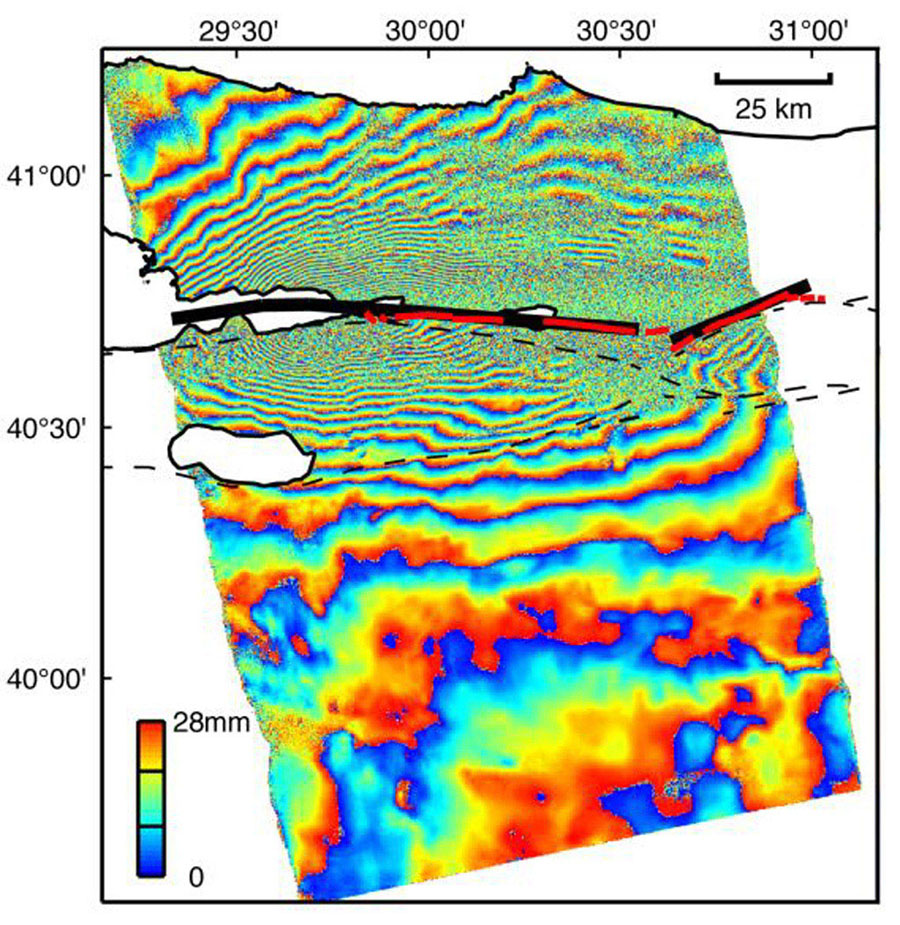
Land deformation after the magnitude 7.6 Izmit (Turkey) earthquake in August 1999. The red lines show the locations of fault breaks and the black lines the fault rupture from the SAR data. The northern side of the fault moved away from the satellite (red - yellow - blue) and the south part moved towards the satellite (blue - yellow-red), meaning that the earthquake ruptured the fault. Image: JPL NASA.
4.2 Volcanoes
InSAR can be useful in monitoring volcanoes as a map that covers a very large spatial area with centimetre-scale accuracy can be produced especially for volcanoes that are in locations difficult to access. The main limitation is the difficulty of seeing through vegetation to the ground beneath for the volcanoes located in the tropics. By monitoring the surface deformation of the volcano, the movement of molten rock (magma) underground can be tracked and that has led to the discovery that some long-dormant volcanoes are actively deforming and may erupt eventually, although they currently exhibit little activity. InSAR-detected deformation at volcanoes is considered to be predominantly vertical, as it involves either swelling as magma intrudes or a hydrothermal system pressurizes or subsidence caused by magma withdrawal during an eruption, depressurization, or thermal decay of a hydrothermal system.
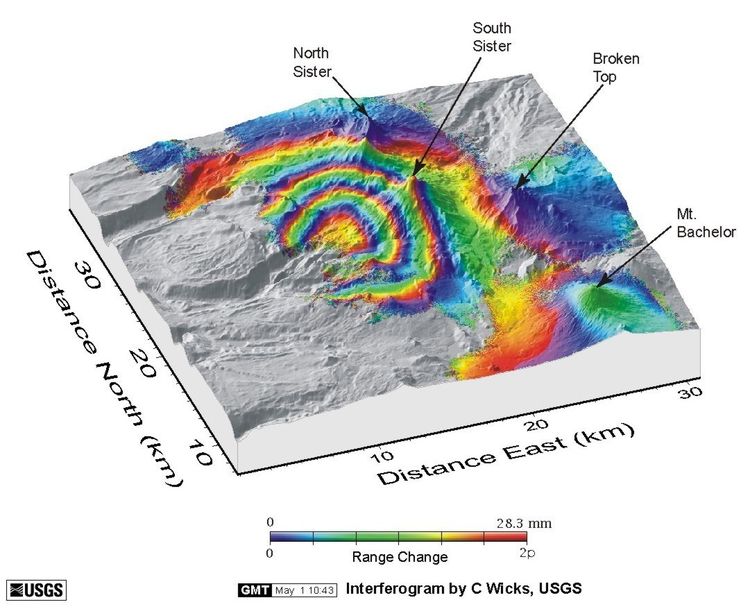
Land deformation centred 5 km west of South Sister volcano in central Oregon. Each colour cycle from blue to red represents a movement of 2.8 cm of the ground towards the satellite. Image: USGS.
4.3 Land subsidence
Interferograms are maps of relative ground-surface change that are constructed from InSAR data to help scientists understand how tectonic or human activities, such as groundwater pumping and hydrocarbon production, cause the land surface to uplift or subside. If the ground has moved away from (subsidence) or towards (uplift) the satellite between the times of the two SAR images, a slightly different portion of the wavelength is reflected back to the satellite resulting in a measurable phase shift that is proportional to displacement.
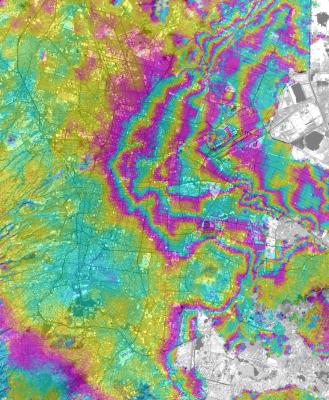
Subsidence of Mexico city in 2000. Each colour cycle from yellow to red represents a movement of 2.8 cm of the ground away from the satellite. Image: Cabral et al., 2008.
Data Sources
SAR data from different satellites are available and can be downloaded from different sources. Below there are some examples:
Software and Tutorials
There is a number of different software that can be used for InSAR processing. Some examples are:
Training courses
Land Subsidence mapping with Sentinel-1
Bibliography
Bamler, R., & Hartl, P. (1998). Synthetic aperture radar interferometry. Inverse problems, 14(4), R1.
Ferretti, A., Monti Guarnieri, A., Prati, C., Rocca, F., & Massonnet, D. February 2007. INSAR Principles: Guidelines for SAR Interferometry Processing and Interpretation.
Hanssen, R. F. (2001). Radar interferometry: data interpretation and error analysis (Vol. 2). Springer Science & Business Media.
Helz, R. L. (2005). Monitoring ground deformation from space. US Department of the Interior, US Geological Survey.
Moreira, A., Prats-Iraola, P., Younis, M., Krieger, G., Hajnsek, I., & Papathanassiou, K. P. (2013). A tutorial on synthetic aperture radar. IEEE Geoscience and remote sensing magazine, 1(1), 6-43.