Fire Intensity versus Burn Severity
Fire intensity represents the energy that is released from organic matter during the combustion process (Keeley, 2009). It also refers to the intensity of the fire while it is active. Burn severity, on the other hand, describes how the fire intensity affects the functioning of the ecosystem in the area that has been burnt. The observed effects often vary within the area and between different ecosystems (Keeley, 2009). Burn severity can also be described as the degree to which an area has been altered or disrupted by the fire. An illustration of the difference between fire intensity and burn severity is shown in Figure 1.
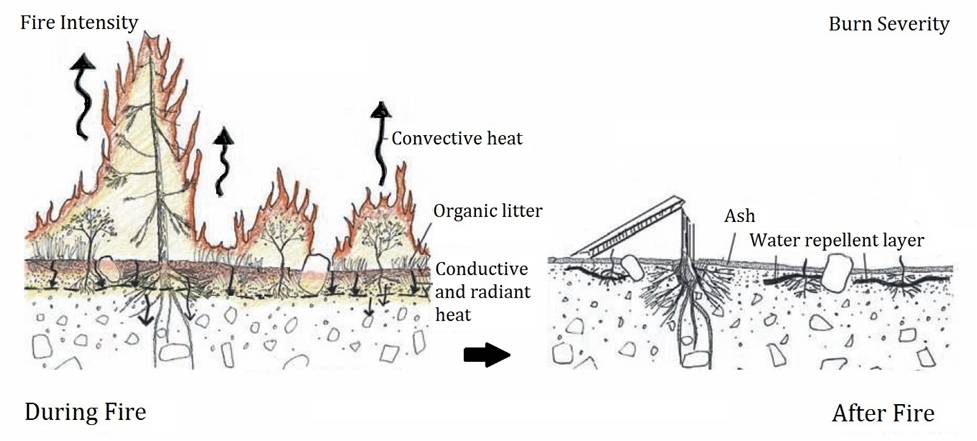
Figure 1. Illustration of fire intensity versus burn severity (Source: U.S. Forest Service).
Normalized Burn Ratio (NBR)
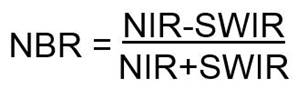
The Normalized Burn Ratio (NBR) is an index designed to highlight burnt areas in large fire zones. The formula is similar to NDVI, except that the formula combines the use of both near infrared (NIR) and shortwave infrared (SWIR) wavelengths.
Healthy vegetation shows a very high reflectance in the NIR, and low reflectance in the SWIR portion of the spectrum (Figure 2) - the opposite of what is seen in areas devastated by fire. Recently burnt areas demonstrate low reflectance in the NIR and high reflectance in the SWIR, i.e. the difference between the spectral responses of healthy vegetation and burnt areas reach their peak in the NIR and the SWIR regions of the spectrum.
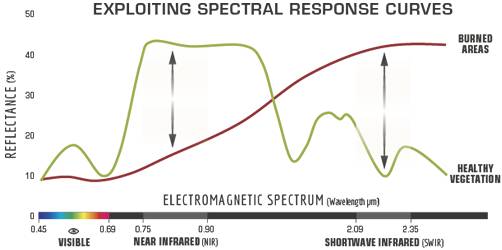
Figure 2. Comparison of the spectral response of healthy vegetation and burned areas. Source: U.S. Forest service.
To benefit from the magnitude of spectral difference, NBR uses the ratio between NIR and SWIR bands, according to the formula shown below. A high NBR value indicates healthy vegetation while a low value indicates bare ground and recently burnt areas. Non-burnt areas are normally attributed to values close to zero.
Burn Severity
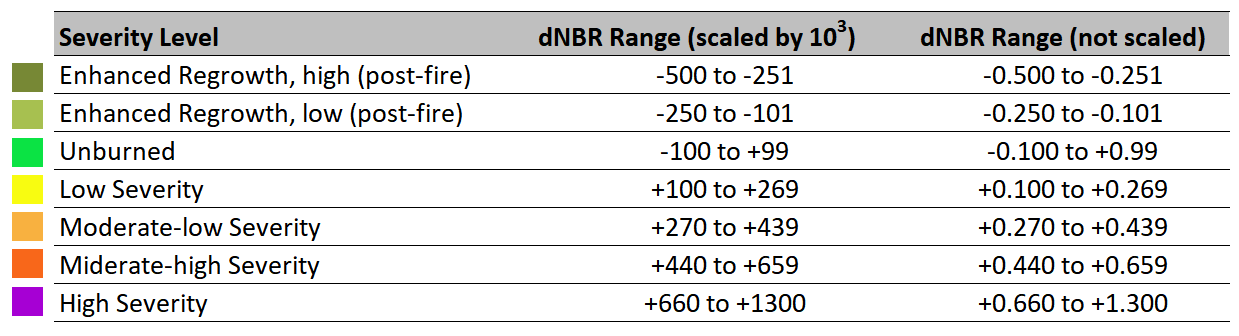
The difference between the pre-fire and post-fire NBR obtained from the images is used to calculate the delta NBR (dNBR or ∆NBR), which then can be used to estimate the burn severity. A higher value of dNBR indicates more severe damage, while areas with negative dNBR values may indicate regrowth following a fire. The formula used to calculate dNBR is illustrated below:

dNBR values can vary from case to case, and so, if possible, interpretation in specific instances should also be carried out through field assessment; in order to obtain the best results. However, the United States Geological Survey (USGS) proposed a classification table to interpret the burn severity, which can be seen below (Table 1).
Table 1. Burn severity levels obtained calculating dNBR, proposed by USGS.
Burn severity data and maps can aid in developing emergency rehabilitation and restoration plans - post-fire. They can be used to estimate not only the soil burn severity, but the likelihood of future downstream impacts due to flooding, landslides, and soil erosion.
References
Keeley, J. E. (2009). Fire intensity, fire severity and burn severity: A brief review and suggested usage. International Journal of Wildland Fire, 18(1), 116–126.
Normalized Burn Ratio by Humbold State University (Link here).
More Information:
- For information about which bands to use to calculate NBR using different sensors, click here.
- NASA webinar about remote sensing for wildfire application, click here.
Videos:
Environmental change - normalized burn ratio by Karen Joyce