Barbara Theilen-Willige, TU Berlin, Institute of Applied Geosciences, Department of Hydrogeology, Germany
Helmut Wenzel, VCE Holding GmbH, Vienna, Austria
Introduction
As prerequisite for earthquake emergency planning there is a strong need to improve the systematic, standardized inventory of areas that are more susceptible to earthquake ground motions or to earthquake related secondary effects such as landslides, liquefaction, soil amplifications, or compaction. A uniform data base with a common set of strategies, standards and formats should be implemented. The evaluation of satellite imageries, digital topographic data and open-source geodata can contribute to the acquisition of the specific tectonic, geomorphologic / topographic settings influencing local site conditions.
GIS is used as a tool to represent the earthquake hazard parameters as far as possible - in the form of geographical maps, which is most useful for government agencies, non-governmental organizations, business communities and public when planning emergency preparedness and hazard management.
Earthquakes in Hungary
Seismicity in Hungary is relatively low comparing to the adjacent areas. However, magnitude 6.0-6.5 earthquakes are documented. Fig.1 shows the distribution of earthquake epicentres in Central-Hungary, emphasising earthquakes with magnitudes M > 4. As cities and settlements, infrastructural facilities, and numerous industrial plants are concentrated along the Danube river, the necessity of earthquake awareness and preparedness is evident.
Earthquake hazards in Hungary mainly occur due to
- ground shaking
- soil amplification because of local site conditions
- liquefaction and compaction
- landslides
- movements along active fault zones and aseismic movements in the subsurface (horizontal and vertical).
It has been observed that at many sites surface motions are influenced primarily by the internal conditions within the top 20-30 m sub-surface layer. These conditions influence amplitude, frequency and duration of ground motion at a site. Local site conditions play an important role when considering earthquake shaking and damage intensities and their local variations: The ground-shaking during an earthquake predominantly depends on factors such as the magnitude, properties of fault plane solutions, the distance from the fault and local geologic conditions. The most intense shaking experienced during earthquakes generally occurs near the rupturing fault area, and decreases with distance away from the fault. Within a single earthquake event, however, the shaking at one site can easily be stronger than at another site, even when their distance from the ruptured fault is the same. The variability in earthquake-induced damage is mainly determined by the local lithological properties, thickness of the soil and lithologic unit layer, by hydrogeological and by geomorphological conditions (Fig.2).
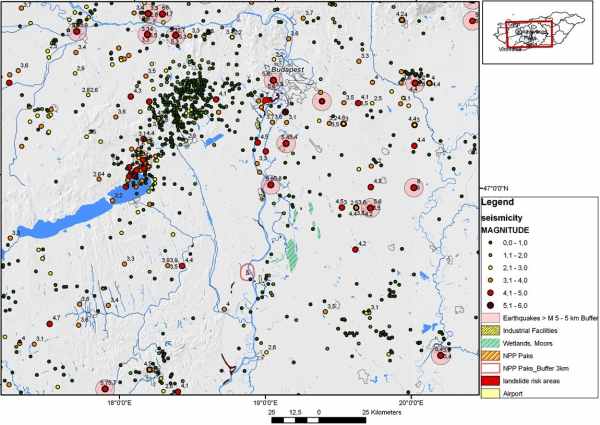
Figure 1: Seismicity in Central-Hungary
Earthquake data: ISC, World Stress Data, BGR, GeoRisk, ZAMG, GFU, USGS
Groundwater level variations and associated saturation changes in sand layers within near-surface aquifers can influence local response spectra of the ground motion, through modification of shear-wave velocity. Changes of the groundwater level can also have a considerable influence upon the liquefaction potential of a region due to to in-situ pore-water pressure responses in aquifers triggering mechanism of liquefaction during earthquakes (1). Liquefaction that affects the human-built environments is mostly limited to the upper 15 m of soil.
As a prerequisite for earthquake preparedness a detailed inventory of sites more susceptible to earthquake damage and to earthquake related secondary effects due to local site conditions has to be prepared.
Data and Methods
GIS integrated geodata analysis can be used to visualize factors that are related to the occurrence of higher earthquake shock and / or earthquake induced secondary effects, such as lithology (loose, unconsolidated sedimentary covers), faults, steeper slopes (landslide susceptibility) or higher groundwater tables (Figure 2).
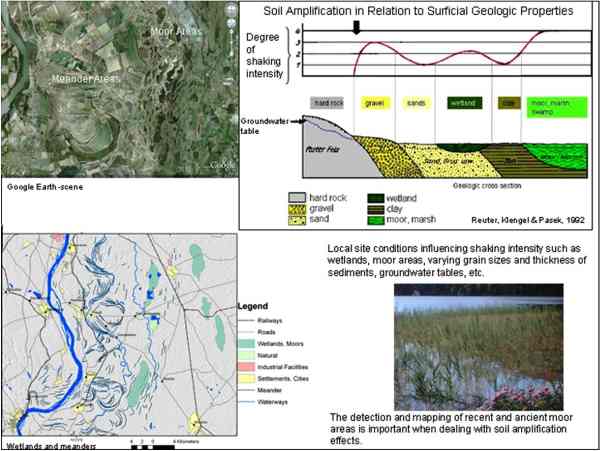
Figure 2: Local site conditions influencing ground motion such as wetlands and unconsolidated, sedimentary covers (Loose soils can amplify and prolong shaking)
Digital Elevation Model Data (DEM)
When searching for areas susceptible to soil amplification, liquefaction or compaction the so called causative or preparatory factors have to be taken into account such as height levels, slope gradients, terrain curvature, lithologic conditions and faults zones (3). Morphometric maps (slope gradient maps, drainage,etc.) derived from SRTM and ASTER DEM data are combined with lithologic and seismotectonic information in a GIS data base. Some of the causal factors can be determined systematically: From slope gradient maps those areas with the steepest slopes are extracted, and from curvature maps the areas with the highest curvature, as these are more susceptible to landslides. Height level maps help to detect topographic depressions covered by more recently formed sediments, which are usually linked with higher groundwater tables. In case of stronger earthquakes those areas often show the highest earthquake damage intensities. From ASTER DEM data the flat areas with no curvatures of the terrain and low to no slope gradients and the lowest areas are extracted (Fig.3).
An important step towards susceptibility mapping is the weighted overlay method in ArcGIS as the influence of the various factors on earthquake ground motion is different (Fig.4). The influence of the causal or preparatory factors can vary for example due to seasonal reasons. E.g., in very hot and dry seasons the risk of liquefaction or landslides is generally lower than in spring times.
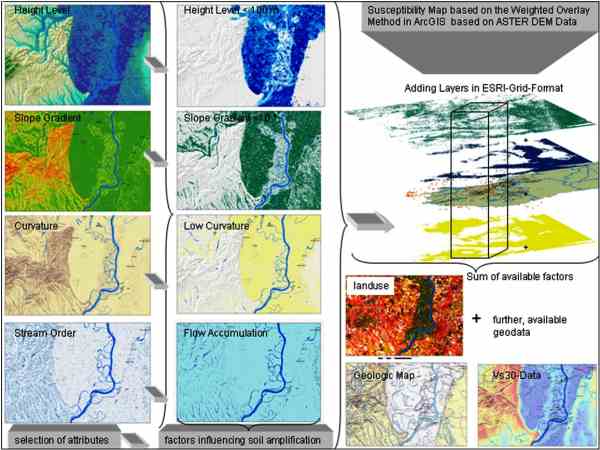
Figure 3: Extraction of causal or preparatory factors influencing earthquake shock
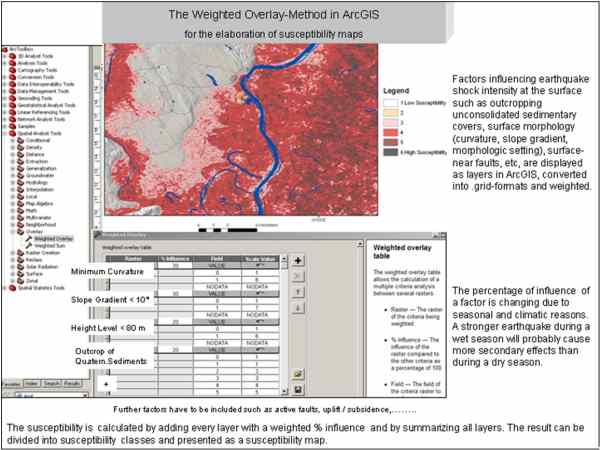
Figure 4: The Weighted Overlay approach in ArcGIS
Satellite Imagery
RapidEye- and LANDSAT-data are used as a further basic layer in the earthquake GIS, e.g. for the elaboration of actual land use maps (Fig.5). Some data layers, such as land use and forests, are dynamic in nature and need to be updated frequently. For disaster preparedness it is necessary to have a detailed and up-to-date documentation of settlements, infrastructure, industrial facilities etc. that might be exposed to earthquake and other hazards, especially with regard to their different exposure to soil amplification, landslides or active tectonic processes. RapidEye images serve as georeferenced data base for the mapping of landslide areas, wetlands and bogs.

Figure 5: Supervised classification of RapidEye data
Environmental changes have also to be considered when dealing with emergency planning. Figure 6 shows LANDSAT scenes from 1987 to 2010 visualizing environmental changes in land use such as growth of settlements and newly built roads, or flooding events due to flash floods after heavy rain falls. Central-Hungary was prone to extended flooding in May 2010. When planning evacuation routes, roads exposed to flooding have to be known and in case of flooding alternative routes have to be arranged. Fig. 7 visualizes the roads situated below 80 m height level that are susceptible to flooding.
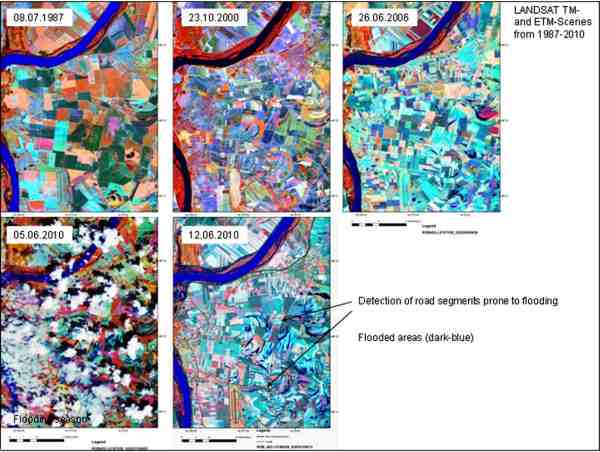
Figure 6: Environmental changes documented by LANDSAT scenes from the area east of Paks
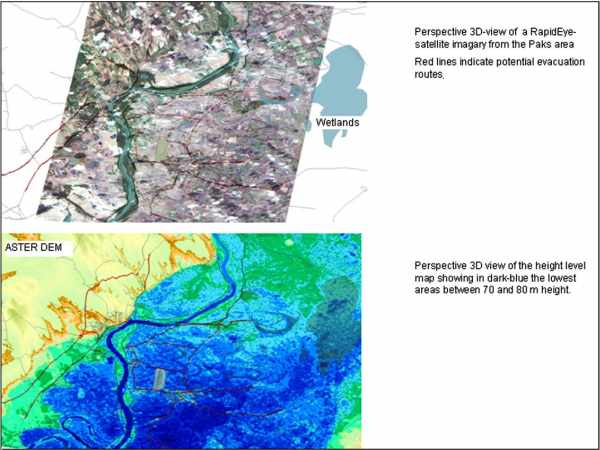
Figure 7: Roads susceptible to flooding
Contribution of Satellite Data to Emergency Preparedness
Analysis of satellite data can contribute to the assessment of potential areas of higher earthquake damage: When combining the results of the weighted overlay-approach (i.e. summarizing the factors with influence on earthquake shock) with high resolution satellite data a better understanding and visualization of differences can be achieved, allowing the identification of “islands” of higher earthquake damage risk (2, Fig.8).
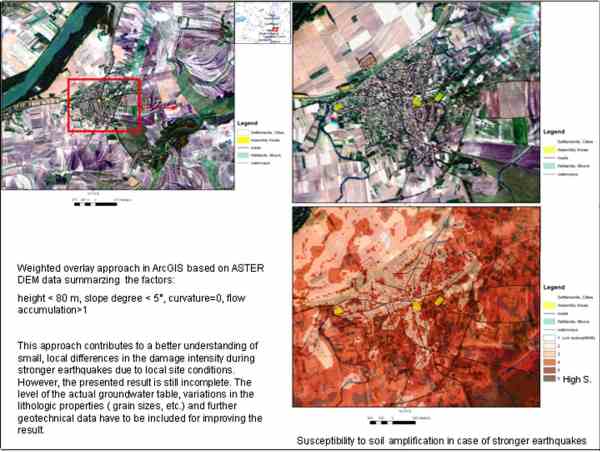
Figure 8: Combining RapidEye satellite imageries with the weighted overlay results
A major emergency preparedness and management demonstration is planned for May 2011 in Hungary, as part of a large collaborative EU-FP7 funded research project (Integrated European Industrial Risk Reduction System, IRIS). The framework for the IRIS demonstration comprises a large civil protection exercise based on innovative information collection and risk assessment. The entire data sets will be managed by a GIS program. A simulation based on the MAEViz software will be performed. It allows setting an earthquake scenario and computing the consequences. The output is a map showing the expected extent of damage to the constructed infrastructure. With this information priorities for the civil protection forces can be set. This information will create an updated emergency plan for the civil protection forces.
The exercise is designed as well to show how satellite images can improve civil protection measures in case of large scale disasters. It is planned to set markers which will subsequently be identified in Rapid Eye images on a daily basis. This will allow creating an up-to-date overview on the dimension of a potential disaster and provide the basis for an updated mitigation plan. It is intended to invite international participants and guests from all over Europe in order to demonstrate the technology and receive feedback on a high level.
A proposal to support the preparation of this demonstration was accepted by the German Aerospace Center (DLR). Within this proposal RapidEye satellite data with a spatial resolution of 5 m are provided, covering Central Hungary along the Danube River from north to south. Strategic databases are created: Data for hospitals and health centers, schools, governmental buildings, police, fire stations, industrial buildings, gas stations and infrastructure data are collected and stored as shapefiles in the GeoInformation System, as well as geological maps, earthquake and seismotectonic data. Fig.9 presents as example a map with a “distance to the next hospital”- calculation.
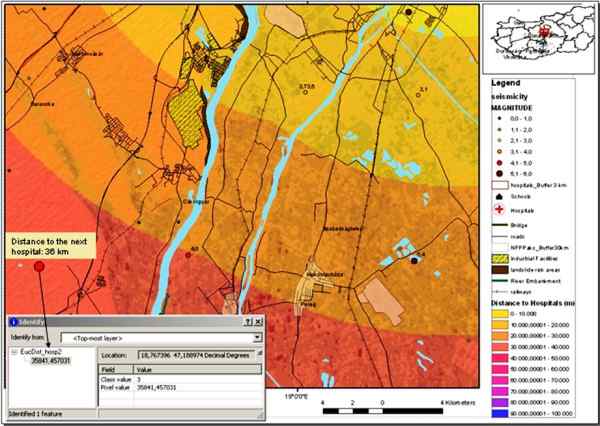
Figure 9: Calculation of the distance to the next hospital
Acknowledgments
The support of EU, FP 7, Large Collaborative Research Project, IRIS – Integrated European Industrial Risk Reduction System, CP-IP 213968-2, is kindly acknowledged.
References
- Hannich,D., Hötzl, H. & Cudmani,R., Einfluss des Grundwassers auf die Schadenswirkung von Erdbeben – ein Überblick. Grundwasser,Vol.11,4, 286-294 (2006).
- Theilen-Willige,B. and Wenzel,H., Local Site Conditions influencing Earthquake Shaking Intensities and Earthquake related Secondary Effects - A Standardized Approach for the Detection of Potentially Affected Areas using Remote Sensing and GIS-Methods. 10. Forum Katastrophenvorsorge, Katastrophen – Datenhintergrund und Informationen UN Campus, Bonn, 23. - 24. November 2009 (2009). http://213.23.39.218/download/forum/10/TheilenWillige_Wenzel_ExtAbst.pdf
- Theilen-Willige,B., Detection of local site conditions influencing earthquake shaking and secondary effects in Southwest-Haiti using remote sensing and GIS-methods, Nat. Hazards Earth Syst. Sci., 10, 1183–1196, 2010, www.nat-hazards-earth-syst-sci.net/10/1183/2010/, doi:10.5194/nhess-10-1183-2010
http://www.nat-hazards-earth-syst-sci.net/10/1183/2010/nhess-10-1183-2010.pdf