Matthias Zink, Dresden University of Technology
Juan Carlos Villagran de Leon, United Nations Office for Outer Space Affairs, United Nations Platform for Space-based Information for Disaster Management and Emergency Response (UNOOSA/UN-SPIDER)
Introduction
In many cities in developing countries there is a tendency for hazards associated with floods to increase as a consequence of inadequate urbanization processes. Unfortunately, it would seem that the two main driving factors responsible for this increase remain hidden from the view of actors such as developers, individual citizens seeking to establish themselves in urban areas, and city planners. The first factor is the shrinking of the width of channels in rivers flowing through urban areas when owners and developers construct houses and buildings along the shores of rivers at the expense of the channel. The net effect is an increase in the level of water during floods, because there is less space for retention areas. The second factor is the increasing degree of sealing or impermeability of the ground within the basin as a consequence of urban and industrial growth. This sealing of the ground leads to a higher rate of effective runoff, as less precipitation can be stored in the ground.
An important first component of flood management in urban areas is hydrological modeling. However, a typical challenge in the case of developing countries is the modeling of the ongoing hydrological processes with a very limited amount of data. This document presents the results of a case study focusing on the city of San Antonio de Belen in Costa Rica, which was conducted by the authors within the Risk Management Section of the Institute for Environment and Human Security of the United Nations University in 2008 (UNU-EHS). The document presents an example of the use of satellite imagery and aerial photographs to gather information which is essential to generate data that can be used to perform the hydrological modeling needed to explain emerging floods in urban areas due to improperly planned urban growth.
San Antonio de Belen, Costa Rica, and the Quebrada Seca Basin
As one of the municipal districts neighboring San Jose, which is the capital city of Costa Rica; and very close to the Juan Santamaria International Airport, San Antonio de Belen became host to large industrial establishments over the decades, and more recently to residential areas as well. Unfortunately, the decades of improper urban growth and industrialization have led to more frequent and more intense floods.
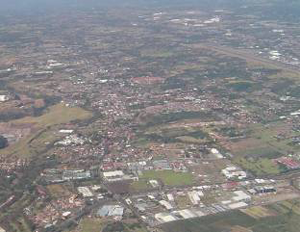
Figure 1: Aerial view of the city of San Antonio
The river provoking these floods is called Quebrada Seca and it has a watershed area of 20.2 km². While it can be considered a small river, in recent years it has provoked severe floods in San Antonio de Belen. San Antonio de Belen (figure 1) lies on the foothills of two volcanoes, one of them being the headwater of the Quebrada Seca river. So altitudes around 1700 m are dominating the upstream segment of the basin, while lower reaches are located in altitudes around 900 m. With an elongated shape, the length of the watershed is 19.5 km and the mean slope is 5.2%. Furthermore the two upstream river reaches have approximately the same river length of 8.5 km. As a consequence, the respective peak flows may reach the intersection at the same time. Figure 2 shows an overview of the watershed of the Quebrada Seca river.
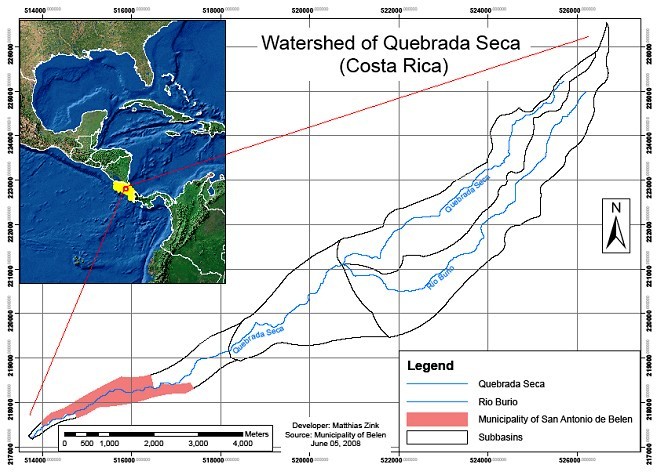
Figure 2: Watershed of the Quebrada Seca river.
Aerial photography and satellite imagery
A very important parameter related to the infiltration capacity is the type of land-cover. Because land cover information was not available, it was necessary to develop digital land-use maps using existing aerial photographs and recent satellite images. Aerial photographs taken in 1945 represent the situation of the basin before heavy industrialization took place. A satellite image from the year 2005 covering the lower and middle parts of the basin was complemented with Google Earth Images to generate the required information concerning land-cover and land-use. Using land-cover definitions related to the runoff curve number (USDA, 1986), land-cover types were developed for the watershed of the Quebrada Seca. Table 1 shows the definition of land-cover types corresponding to the spatial distribution of single land use classes. These land use classes correspond to those defined in the Curve Number (CN) method. The CN indicates the infiltration capacity of a given type of soil and thus the hydrological behavior of that particular soil. Together with the spatial weights of each land use class, the CN of the different land-cover types can be determined.
To conduct the hydrological modeling, the CN data corresponding to the different soil types had to be determined. The data were gathered from studies which have been conducted by local researchers in this watershed (Arguedas, Campos, & Ballestero, 2002 and Serrano, 2004). The volcanic ashes and sand-dominated region has a high fraction of soils which have a good to moderate permeability for water and clay contents less than 10%. As defined by the United States Department of Agriculture (USDA, 2007), these soils can be classified as type A, which show a good condition for high infiltration capacities. Nevertheless, it is important to keep in mind that there are high slopes in some segments of the watershed and high rain intensities which decrease infiltration and create higher flood potentials.
| Category | Land-Cover Type | Description |
|---|---|---|
| Agriculture-dominated land-cover | Agriculture | 100% crops |
| Agriculture and residential | 90% crops, 10% residential | |
| Greenland and crops | 80% crops, 20% greenland | |
| Agriculture, residential and greenland | 75% crops, 15% residential, 10% greenland | |
| Settlement-dominated land-cover | Low density of settlement | 35% residential, 65% woods and grass |
| Average density of settlement | 50% residential, 40% houses and industries, 9% greenland, 1% streets | |
| High density of settlement | 97% housing and industries, 3% streets | |
| Average density of residential | 70% residential, 20% industries, 9% greenland, 1% streets | |
| Residential | 100% residential | |
| Housing and industries | 100% housing and industries | |
| Natural-dominated land-cover (forests, tree-covered coffee plantations) | Woods and grass | 100% woods and grass |
| Very low density of settlement | 85% woods and grass, 15% residential | |
| Woods and grass, agriculture, residential | 60% woods and grass, 30% crops, 10% residential |
Table 1: Definition of land-cover types within the watershed as well as generalization into three categories of land-cover
Because of the high infiltration capacity of these soils, it can be assumed that the infiltration within the watershed is influenced mainly by two parameters: land-cover and the slope. Thus the determination of the land-cover becomes an important factor in relation to the accuracy of the hydrological model.
The land-cover types were summarized into three categories: agricultural, urban, and natural-dominated, to get a better visualization of the urbanization. The results of the processing of the aerial photographs and satellite imagery are presented in Figure 3 and manifest the large difference in the land-cover regimes between 1945 and 2005. The 2005 land-cover map shows that the watershed is dominated by urban areas. These areas cover 65% of the watershed. In comparison with the map of 1945 the urban dominated area increased to nearly double (increasing of urban area by 48%). The reason for this change has been a process of industrialization in the central part of the basin, (e.g. Bridgestone, Intel, and Coca Cola industrial plants for example) and a more recent urbanization in terms of residential neighborhoods throughout the basin. So, Belen has become one of the most developed municipal districts in Costa Rica. Unfortunately, throughout the decades, local authorities were not aware of the impacts of industrialization and urbanization in the context of floods.
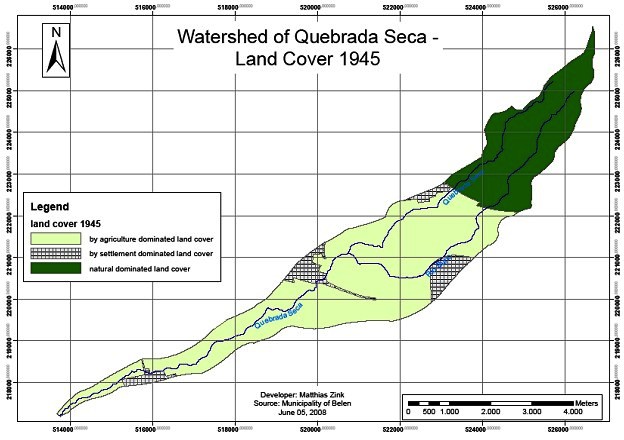
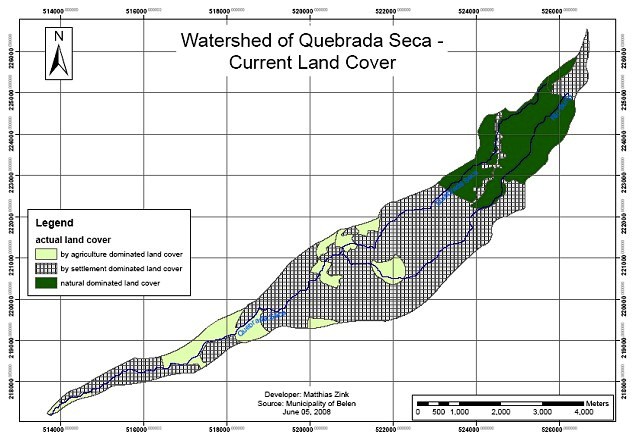
Figure 3: Land-use patterns in the Quebrada Seca basin. The upper map corresponds to 1945, while the lower one to 2005.
With the information on CN values, the HEC HMS software (Hydrologic Engineering Center – Hydrologic Modeling System) was used to generate a rainfall runoff model for the watershed of the river and the HEC-RAS software (Hydrologic Engineering Center – River Analysis System) was employed as a flood routing model within the downtown area of the city of San Antonio de Belen.
Results
The extreme change in the land cover within the watershed leads to the assumption that flood hazard in the downstream segment of the basin is increasing significantly. The simulations done with HEC-HMS prove this hypothesis. Figure 4 shows a comparison of the discharge simulated for both 1945 and 2005, taking as input data the precipitation of 13 July 2007, which generated a flood that lead to severe damages in the city, as well as in other regions of the basin.
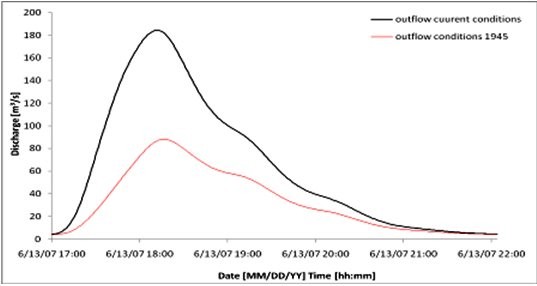
Figure 4: Simulations of discharge using both HEC-HMS and HEC-RAS. The red curve shows the simulated discharge corresponding to 1945, while the black curve shows the simulated discharge for 2005.
The comparison of the peak flows shows an increase from 88 m³/s in 1945 to 184 m³/s in 2005 due to the land cover changes. So the peak flow at this special event has more than doubled. But a much more interesting figure is the amount of water flowing during the flood event. The total amount of floodwater in 1945 would have been around 620,000 m³ while in 2005 it was calculated at 1,190,000 m³.
The increase in discharge is represented in the water levels simulated with HEC RAS as well. As it can be seen in Figure 5, the water level increased at specific cross sections in the downtown area by more than 1.5 m. The selected example shows that the same precipitation may not lead to overtopping of the bank in 1945, while in 2005 it does.
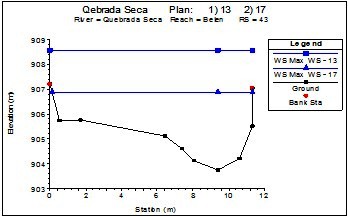
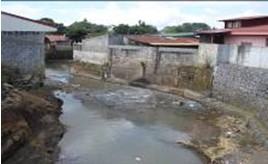
Figure 5: HEC RAS simulation of maximum of water levels at a cross section in the downtown area of Belen. The figure shows the simulation result while the photo shows this cross section as it looked in 2007.
Conclusions
The use of satellite imagery allows scientists to track land-use changes, and to generate quantitative information regarding land-cover that is required to run hydrological models. Without such information, quantitative estimations of the amount of water retained by the watershed itself are nearly impossible. The quantification of impacts of land-cover changes on the hydrological regime are of high interest in the current research. In this context the use of satellite imagery allows scientists to classify land-cover patterns and to quantify areas according to their land-cover type with standard GIS software. Such information can then be used e.g. by hydrologists to run rainfall-runoff models to assess the degree of flood hazard in particular geographical areas thereby helping local authorities and administrations to develop land-use plans in order to avoid the exposure of resources or lives to such floods.
References
- Arguedas, M. H.; Campos, G. L.; Ballestero, C. R.; 2002: Análisis de posibles soluciones al problema de las inundaciones, en el cantón de Belén, producto del desbordamiento de la Quebrada Seca.; Universidad de Costa Rica, Facultad de Ingeniería, Escuela de Ingeniería Civil.
- Serrano, L. S.; 2004: Modelación Hidráulica de la Quebrada Seca para el Control de Inundaciones en el Cantón de Belén; Universidad de Costa Rica, Facultad de Ingeniería, Escuela de Ingeniería Agrícola.
- United States Department of Agriculture (USDA); 1986: Urban Hydrology for Small Watersheds TR-55, Natural Resources Conservation Service.
- United States Department of Agriculture (USDA); 2007: National Engineering Handbook, Hydrologic Soil Groups; Natural Resources Conservation Service.
- US Army Corps of Engineers; 2000: Hydrologic Modeling System HEC-HMS, Technical Reference Manual; Hydrologic Engineering Center.
- US Army Corps of Engineers; 2008: Hydrologic HEC-RAS River Analysis System, Hydraulic Reference Manual; Hydrologic Engineering Center.