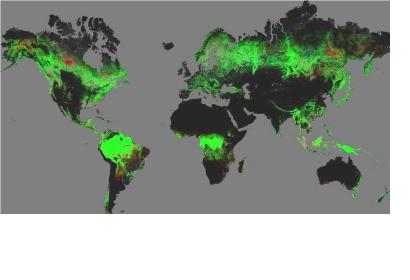
A new high-resolution global map has been created as an interactive online tool that shows forest loss and gain from 2000 to 2012. "This is the first map of forest change that is globally consistent and locally relevant," said Prof Matthew Hansen of the University of Maryland, who led the project team which developed the map with the additional help of Google Earth.
Based on 650,000 satellite images by Landsat 7, the map shows a number of key findings on forest change during 2000-2012 like an increasing in tropical forest loss by about 2,100 sq km per year. The map is publicly available and zooms in to a remarkably high level of local detail - a resolution of 30m. Green areas of the map represent forested areas; red suffered forest loss; blue showed forest gain; pink experienced both loss and gain.
Researchers expect to use the map to assess the effectiveness of forest management programmes and to monitor the impacts of deforestation - including biodiversity threats, carbon storage and climate change. "This new monitoring approach can for the first time provide - on a global scale - transparent accountability for monitoring progress toward achieving real declines in deforestation," said Daniel Zarin, of the Climate and Land Use Alliance.

