For decades, satellite remote sensing has provided fundamental insights in countless physical science fields such as ecology, geosciences, atmospheric physics, and chemistry. However, as it relates to human and socioeconomic processes, satellite remote sensing is an incredibly powerful tool that is underutilized. Human behavior and socioeconomic parameters have been successfully studied via proxy through remote sensing of the physical environment by measuring the growth of city boundaries and transportation networks, crop health, soil moisture, and slum development from visible and multispectral imagery.
The NASA/ NOAA image of Earth’s “Lights at Night” is routinely used to estimate economic development and population density. There are many examples of the conventional uses of remote sensing in humanitarian-related projects including the Famine Early Warning System Network (FEWS NET) and the UNITAR's Operational Satellite Applications Programme (UNOSAT), which provides remote sensing for humanitarian and disaster relief. Yet even with these successful applications, we've just begun to scratch the surface of what remotely sensed data can provide for prevention, mitigation and response to acute and chronic human crises.
Many successful remote sensing projects have focused exclusively on the visible spectrum - what one would see of they looked down from an airplane at the ground surface. Yet in order to discern objects or patterns of interest (buildings, markets, roads, vehicles, etc.), high spatial resolution remote sensing data are necessary. It's important to note up front, though, that two other types of data resolution are also critical in remotely sensing the Earth's surface: spectral resolution and temporal resolution.High spatial resolution remote sensing data have been utilized successfully in a number of recent disasters to rapidly and accurately map the developing situation on the ground during crises, such as earthquake, flood, landslide, and civil unrest events.
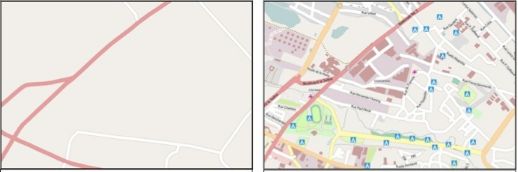
After the 2010 Haiti earthquake, volunteers used released GeoEye imagery to digitize roads into OpenStreetMap. High resolution imagery was key to assessing the situation and for the first time, released widely to the public through Google Earth and other outlets. The Satellite Sentinel Project is goes beyond imaging natural disasters and utilizes DigitalGlobe and other commercial imagery to serve as witness to potential humanitarian crises and human rights crimes in near real-time. Grassroots Mapping.org takes a participatory, public domain approach to monitoring crises with balloon and kite photography. They are using systems that involve attaching digital cameras and infrared sensors to weather balloons. GrassrootsMapping.org has been able to acquire imagery for monitoring the 2010 oil spill in the Gulf of Mexico and has developed a community around their DIY airborne environmental sensors.
Again, however, these projects (as well as many others in the humanitarian space) rely on high spatial resolution with limited utilization of higher spectral or temporal resolution. While high spatial resolution is necessary to "see" what is happening on the ground in the visible spectrum of light that our eyes detect, there are other kinds of data that can be obtained by using remote sensing to "see" in other parts of the electromagnetic spectrum (spectral resolution). Also, one must take into account how frequently these remotely sensed data are gathered (temporal resolution).
Spectral resolution can be the most difficult to understand since many lay users have only used imagery that looks like what their eye sees, such as the GeoEye imagery in Google Earth. There are many sensors that allow us to "see" the Earth's surface in ways other than the visible part of the electromagnetic spectrum. All passive sensors, whether they are in your digital camera or on a satellite, are measuring energy reflected or emitted from the surface of the Earth. This energy either comes from the sun or from the heat energy generated at the molecular level of materials on the ground. Active sensors, such as radar, send down energy (radio waves) to the Earth's surface and measure the returned signal. Spectral resolution refers to the coverage of the electromagnetic spectrum that a sensor can measure.
Many sensors that can detect visible light energy that also have a "band" that measures energy in the near-infrared part of the electromagnetic spectrum. These sensors can be used to measure the abundance of vegetation on the ground. Some have simple thermal detectors that can measure temperature. For more detailed analysis of the Earth's surface, the thermal infrared can be used to say what the composition of geologic and urban materials are on the ground and how those materials hold heat. This requires a higher spectral resolution than most sensors have. Some instruments like the NASA satellite Landsat have a "band" in the thermal infrared which can provide a proxy for surface temperature. The NASA satellite ASTER can has a higher spectral resolution than Landsat since it measure five bands or "slices" of the thermal infrared and so can be used to identify the composition of materials on the ground and measure surface temperature within 1.5 degrees C.
Temporal resolution is the rate at which a location on the ground is imaged by the sensor and how often a useful image can actually be obtained. An airborne sensor, acquiring imagery from an airplane or balloon, will usually have a lower temporal resolution than a satellite sensor, since the airborne sensor will not always be flying, while a satellite may be always acquiring new data. Commercial satellite sensors may effectively have a lower temporal resolution for a certain project than NASA or NOAA imagery, since the project may not be able to afford many images over time from a commercial sensor.
While high spatial resolution remote sensing is vital to responding to an immediate crisis, slow-onset disasters can often be better understood with a foundation of multi/hyper spectral data, with potentially higher temporal resolutions. These data can provide indicators of environmental health, such as water quantity and quality, air pollution, heat, biodiversity, and soil quality. As the world faces increasing major environmental challenges—most notably the threat of climate change—both immediate crises and slow-onset disasters result, but over different periods of time. Slow-onset disasters are often occurring alongside immediate crisis events, involving environmental, social, political, and economic factors that depress resilience and increase vulnerability over time. Multispectral data from NASA and NOAA satellite sensors, such as Landsat, ASTER, MODIS, and GOES, have been effectively used to understand human-environment interactions for these slow-onset disasters.
Since this data is acquired across the globe, in a synoptic view independent of political boundaries or government influence, at regular time intervals, this data can be used to compare cities and regions across time and on global and local scales.
These high spectral resolution data and advanced imagery from active sensors, such as radar, are often limited to researchers who have the skills and software to acquire and process the spectral imagery. Developing open-source Geographic Information System (GIS) platforms that can serve as hubs for both researchers and decision-makers to share data, learn from each others results, and visualize and analyze complex information across disciplines can lead to better understanding of human vulnerability and more useful mitigation/adaptation strategies.
NASA and the USGS have created some new, efficient online tools for data discovery, such as GLOVIS, Earth Explorer, and Reverb, however many of the higher-level analytical software tools for multispectral data have high barriers to entry. At the Mars Space Flight Facility at Arizona State University, we are adapting a NASA open-source GIS package called JMARS for the Earth (J-Earth) to allow for data discovery, sharing and analysis of remote sensing data and other numeric data with other GIS data.
Beyond expanding access to remote sensing data and the ability for decision-makers and the public to use this data, new NASA satellite sensors could be developed and launched to provide multispectral imagery at spatial and temporal resolutions useful to humanitarian uses and decision-makers. A satellite like this would not need an extended expensive mission, such as Landsat, but could be a lighter satellite that could be developed and launched for a fraction of the cost. There have been concepts proposed over the last few years to dedicate a NASA satellite to urban and humanitarian purposes, including from our NASA research group at ASU, however there is not currently a clear path to propose a satellite like this currently within NASA. As more data have become available to understand both sudden and slow-onset crises that have massively multi-variate problems it has become increasingly important to integrate many kinds of data from multiple sources and from fine to course resolutions. Leading the way are projects like Global Pulse that are integrating these multiple kinds of satellite remote sensing data- from high spatial to high spectral resolution - with other numerical models and vector data from official (i.e. ground based sensor networks, governmental and NGO data) and new data sources (i.e. mobile phone data, crowd-sourced inputs, and social networking) in near real time for multiple audiences - researchers, decision-makers, and the public.