
A recent report by the International Water Management Institute (IWMI), authored by Niranga Alahacoon, Sahana V., and Giriraj Amarnath, and developed under the CGIAR Climate Action Program, presents an approach to assessing drought risk in Zambia using open-source geospatial tools and freely available satellite and climate datasets. The study highlights how data-driven methods can support more effective drought monitoring and planning in a country frequently affected by drought, potentially enabling a shift from reactive measures to proactive drought risk reduction. With Zambia being a country highly susceptible to drought and open-source geospatial tools offering a cost-efficient approach to drought risk reduction, this study demonstrates that effective drought risk mapping is achievable despite data and resource limitations.
Drought is described as a slow-onset hazard with wide-ranging impacts on agriculture, water resources, and livelihoods. Unlike sudden onset hazards, its gradual development makes detection and response more complex. As noted by the authors, agricultural and hydrological droughts are frequently identified as the most economically damaging (Mishra & Singh, 2010). More particularly, agricultural droughts are characterised by crop yield losses, and hydrological droughts imply reduced water storage, both reinforcing the need for comprehensive and timely risk assessment.
Understanding Drought Risk: Hazard, Exposure and Vulnerability
The study applies an integrated framework that defines drought risk as the interaction between three components: hazard, exposure, and vulnerability. The authors define the three risk components as follows:
· Hazard refers to the probability of occurrence in a given period, in a given area under a certain intensity.
· Exposure reflects the extent to which people, assets, and resources are located in drought-prone regions.
· Vulnerability denotes the susceptibility and adaptive capacity of the affected population or system to withstand and recover from drought impacts.
By combining these elements, the analysis enables the identification of drought-prone areas and supports the development of targeted interventions. This approach also contributes to strengthening early warning systems and anticipatory action planning.
(Credit: CGIAR & IWMI)
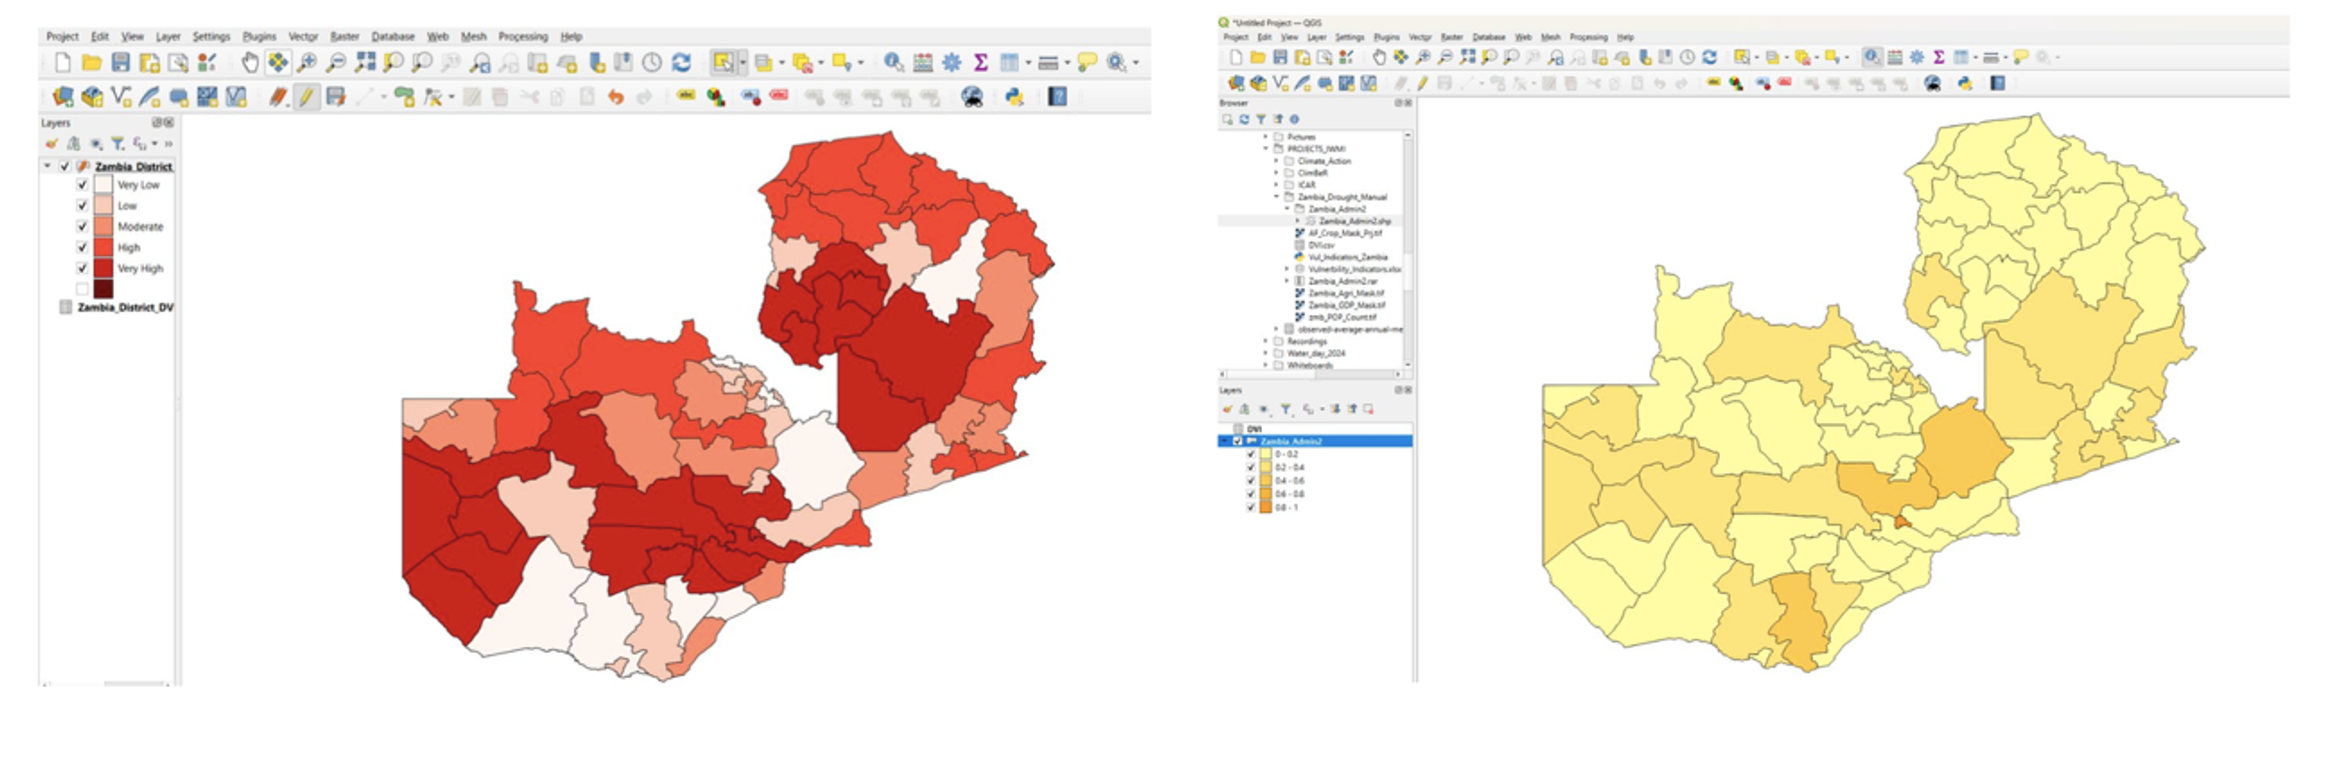
Open-Source Tools for Risk Mapping
At the core of the methodology is the use of QGIS, which allows for the integration and analysis of multiple datasets. The study demonstrates how meteorological indicators such as the Standardised Precipitation Index (SPI) and the Standardised Precipitation Evapotranspiration Index (SPEI), agricultural indicators including NDVI and the Vegetation Health Index (VHI), and hydrological indicators related to soil moisture and water availability can be combined within a single analytical framework.
These datasets are further complemented by exposure information, such as crop distribution and population data, as well as vulnerability indicators linked to socio-economic and environmental conditions. Through the integration of both raster and vector data, the study produces detailed spatial representations of drought risk at national and sub-national levels.
The use of open-source tools, together with satellite data, Python scripting within QGIS, cloud-based repositories, and Google Earth Engine, enables a scalable and reproducible process that can be applied in resource-constrained contexts.
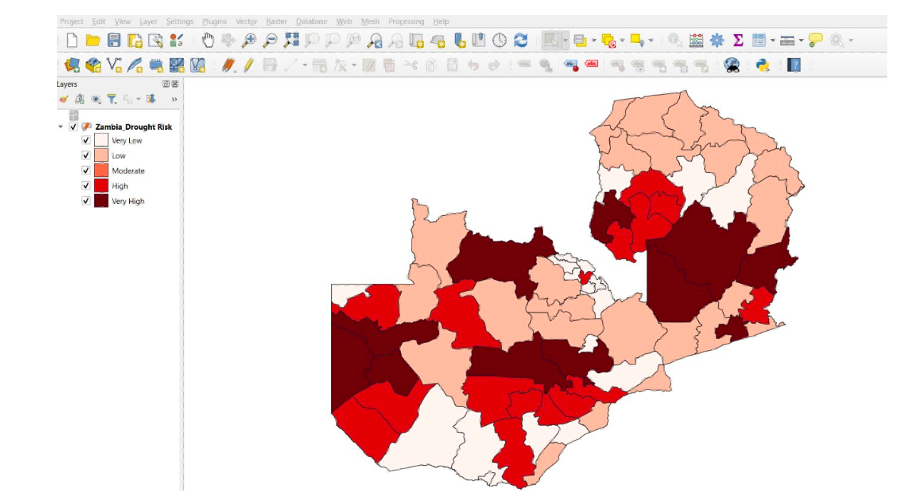
Findings from the Zambia Case Study and Implications for Drought Risk Management
According to the authors, drought in Zambia is both recurrent and spatially uneven, with certain districts facing significantly higher levels of risk due to the combined effects of hazard and vulnerability. By applying standardised indicators and integrating multiple data layers, the study identifies areas where drought impacts are most severe. These high drought risks were found to affect Serenje, Mpika, Mansa, Katete, Lundazi, Solwezi, Kalabo, Lukulu, Mongu, Mumbwa, and Chibombo districts.
One outcome of this study is that open-source geospatial methods can effectively support the generation of drought hazard maps, vulnerability indices, and comprehensive risk profiles. These outputs provide a foundation for improved planning, allowing decision-makers to prioritise high-risk areas and design more targeted responses.
Looking ahead, the report emphasises that open-source, data-driven approaches offer a practical and cost-efficient solution for drought risk assessment, particularly in contexts with limited resources. By enabling continuous monitoring and regular updates, these methods support more proactive approaches to drought management.
Furthermore, the findings underline the importance of integrating drought risk information into policy frameworks, strengthening early warning systems, and enhancing communication with affected communities. Combined with capacity development initiatives, data sharing, and institutional coordination, these factors can contribute to improved long-term resilience.
Towards Climate-Resilient Planning
Overall, the Zambia drought risk case study illustrates how combining geospatial tools with satellite and climate data can support evidence-based decision-making. By identifying risk patterns and informing targeted interventions, such approaches can contribute to improved preparedness and more effective responses to drought.
To strengthen the drought risk management framework in Zambia, the authors recommend the following strategies, which are further elaborated in the report:
1. Institutionalise Open-Source Geospatial Workflows
2. Enhance Data Integration and Accessibility
3. Strengthen Early Warning and Communication Systems
4. Promote Adaptive and Climate-Smart Practices
5. Enhance Socio-Economic Resilience
6. Continuous Monitoring and Policy Integration
As concluded by the authors, “by implementing these recommendations, Zambia can transition from reactive drought response toward proactive risk reduction and resilience-building, leveraging the full potential of open-source geospatial technologies for sustainable development and climate adaptation”. This study ultimately points to the value of open-source geospatial tools to support drought risk analysis with the overall aim to enhance resilience and contribute to sustainable development pathways.
Access the full report on Reliefweb: https://reliefweb.int/report/zambia/leveraging-open-source-geospatial-tools-drought-risk-analysis-zambia-case-study
Find out more about our Regional Support Office: International Water Management Institute