
Monitoring Water Stress from Space: The WARM Project
Access to clean, sufficient water is both a humanitarian imperative and a cornerstone of sustainable development. Yet for river basin managers, disaster risk officers, and environmental agencies, obtaining timely and reliable information on water availability and quality remains a persistent challenge; particularly in remote or cloud-prone regions. The WARM (Water Stress Monitoring) project, developed by Marple GmbH, addresses this gap by combining satellite Earth Observation (EO), machine learning, and open data sources to deliver integrated water quantity and quality assessments. Implemented on two rivers identified in the water mandate list, the Guadalquivir River in southern Spain and the Tana River in south-eastern Kenya, WARM demonstrates how space-based technologies can support all phases of the disaster management cycle, from early warning and risk reduction to long-term monitoring and preparedness.
Overview: Why Water & AI Matter Now
Water is life, and it is increasingly at risk. Around the world, rivers, lakes, and reservoirs face compounding pressures: extended droughts driven by climate change, flash floods of greater intensity, and worsening pollution from agriculture, industry, and urbanisation. These are not slow-moving problems; they unfold in days and weeks, threatening communities, harvests, infrastructure, and ecosystems.
Yet for much of the world, reliable, timely information about water, how much there is, where it is, and whether it is safe, remains out of reach. Ground-based monitoring stations are expensive to install and maintain, geographically sparse, and frequently absent in the regions most vulnerable to water-related disasters.
"Over 2 billion people live in countries experiencing high water stress, and about 4 billion people experience severe water scarcity during at least one month of the year." — United Nations
"25 countries — together home to roughly one-quarter of the world’s population — are now experiencing extremely high water stress on an annual basis, using more than 80% of their available freshwater supply each year." — World Resources Institute
"Water-related disasters have dominated the list of disasters over the past 50 years and account for 70% of all deaths related to natural hazards." — World Bank
This is where the convergence of satellite Earth Observation (EO) and Artificial Intelligence (AI) opens genuinely new possibilities. Satellites orbit continuously, observing the entire planet regardless of terrain, borders, or cloud cover. AI (and in particular machine and deep learning) can extract meaning from the vast volumes of raw satellite data that no human team could process alone: detecting the precise boundaries of a flooded river, estimating water levels from space, or identifying the early chemical signatures of an algal bloom before it becomes a public health crisis.
Integrating AI-powered satellite workflows into the disaster risk management cycle is no longer a research aspiration. It is becoming operational reality, and the WARM project is a clear example of what that looks like in practice.
The WARM Project: What It Does and Why It Was Built
WARM (Water Stress Monitoring) is a platform developed by Marple GmbH, a German start-up company specialising in machine learning and satellite imagery analysis. WARM was built to answer two fundamental questions about any given river:
How much water is there? Tracking surface water extent and estimated water levels over time.
How clean is the water? Assessing pollution levels and classifying water quality for human use and irrigation.
The project was piloted on two rivers selected from the water mandate list, rivers of strategic importance for water security and disaster risk management:
Guadalquivir River, southern Spain, one of the Iberian Peninsula's great rivers, flowing through major agricultural zones and UNESCO World Heritage cities.
Tana River, south-eastern Kenya, Kenya's longest river, a critical source of hydropower and water supply for millions of people, and highly vulnerable to seasonal flood and drought extremes.
WARM is designed to work with freely available Copernicus satellite data, meaning any national agency or regional support office can replicate and adapt the approach for their own river basins, at low cost.
Project Structure and Inputs
WARM operates from three core geospatial inputs:
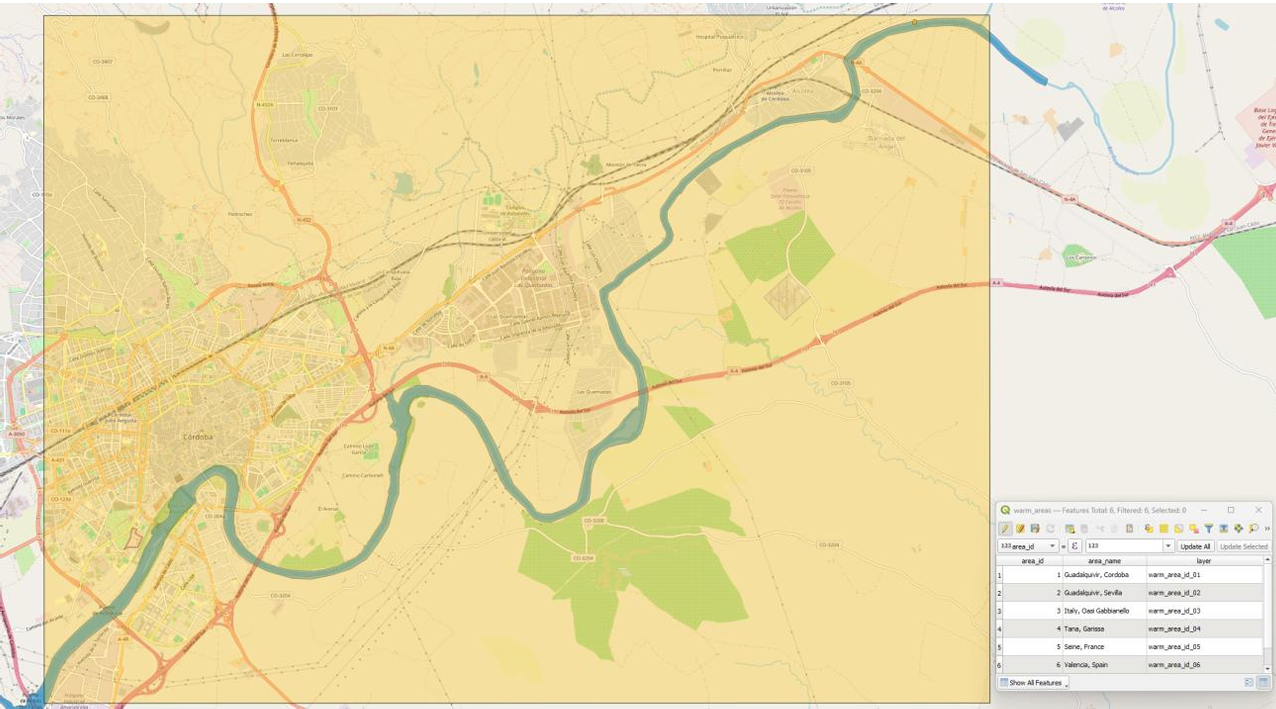
Analysis area: The target river basin or section selected for monitoring.
Nominal water geometry (optional): The outer boundaries of the water basin, used to filter detections and focus analysis on the main river course, reservoirs, and lakes.
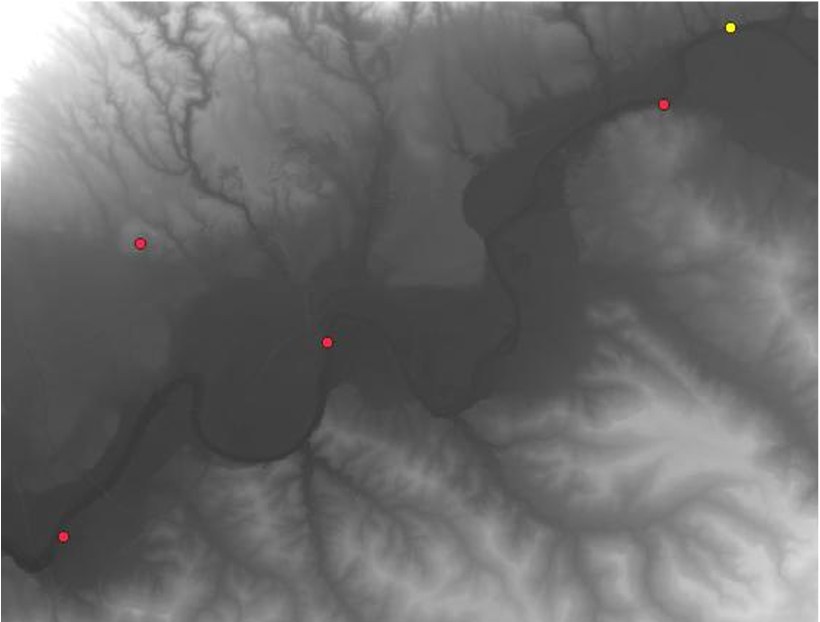
Elevation data: Sourced from open digital terrain models (DEMs) and local monitoring networks where available, used for water level estimation and water quality processing.
All workflow steps are encapsulated in modular scripts designed for reproducible execution, a key feature enabling operational deployment and audit.
Water Quantity Assessment: Knowing How Much Water Is There
Water quantity monitoring is the foundation of any flood or drought response system. WARM delivers two key metrics: surface water extent (where water is on the ground) and water level estimation (how high or low that water sits). Both are derived entirely from satellite data, with no requirement for ground-based gauging stations.
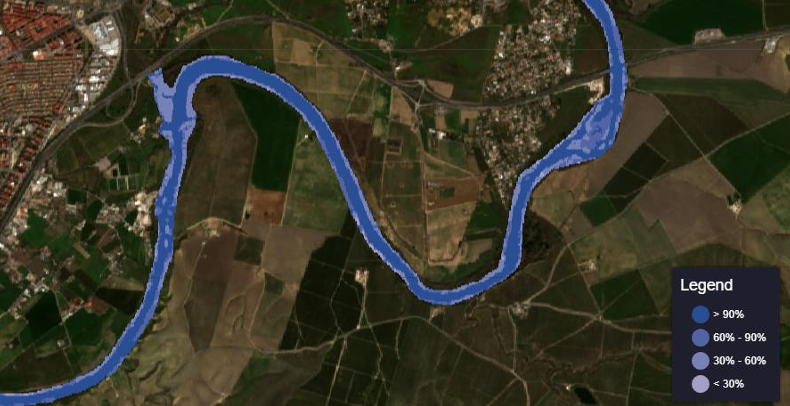
Surface Water Extent Detection
WARM maps surface water extent using two complementary satellite data streams:
Sentinel-2 (optical): Multispectral bands (blue, green, red, near-infrared) are used to compute the Normalized Difference Water Index (NDWI), which highlights water features. Cloud and shadow masking using cloud probability masks ensures only clear-sky scenes contribute to water detection. The Otsu automatic thresholding algorithm is then applied to NDWI to distinguish water from non-water pixels without manual calibration.
Sentinel-1 (radar / SAR): Synthetic Aperture Radar imagery is processed through noise removal, thermal noise correction, and terrain correction. Because radar penetrates cloud cover, it fills observational gaps during cloudy seasons, particularly critical for the Tana River in Kenya, where persistent cloud cover would otherwise render optical monitoring incomplete. Water surfaces are identified by their characteristically low radar backscatter relative to land.
Detections from both sensors are intersected with the nominal water mask (where provided) to constrain results to relevant water bodies. The process runs across time series of satellite acquisitions, enabling change detection and trend analysis over months and years.
Water Level Estimation
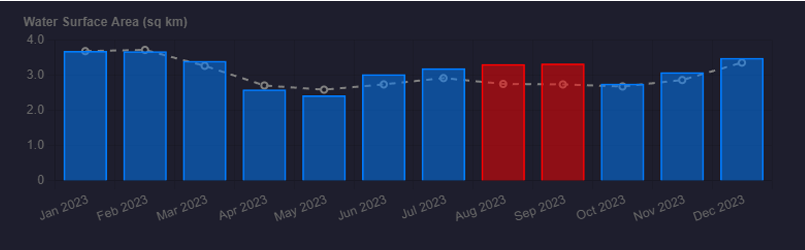
Building on detected water surfaces, WARM estimates water levels by extracting elevation data from DEMs along the perimeter of each detected water body. The median elevation of boundary pixels provides a proxy water level, while pixel-count-based area calculations (calibrated to Sentinel imagery resolution) yield surface water area estimates in square kilometres. Combined, these metrics enable tracking of reservoir storage changes, flood inundation extents, and low-flow drought conditions, all critical inputs for disaster risk and water resource management.
Water Quality: Knowing Whether the Water Is Safe
Knowing that a river holds water is not enough. The quality of that water determines whether it can be used for drinking, irrigation, or aquatic life, and a sudden deterioration in quality can constitute a disaster in its own right. WARM goes beyond quantity monitoring to assess pollution levels and classify water quality using satellite imagery and machine learning, entirely from space.
Why Standard Atmospheric Correction Cannot Be Used
Water quality analysis starts from Sentinel-2 MSI Level-1C data, raw, top-of-atmosphere (TOA) imagery that has not been atmospherically corrected. This is a deliberate choice: standard atmospheric correction processors such as sen2cor are calibrated for land surfaces and produce systematically wrong results when applied over inland water bodies. WARM instead uses a specialist processor, C2RCC, that handles both atmospheric correction and water quality retrieval in a single, water-optimised step.
Stage A: Raw Data Preprocessing
Before quality analysis begins, the raw Sentinel-2 imagery is prepared in two steps:
Spatial resampling: All spectral bands are resampled to 10-metre resolution, matching the resolution of Band 2, to ensure consistent pixel geometry across the full image.
Area subsetting: The imagery is clipped to the specific river section of interest, focusing all subsequent processing on the target area.
Stage B: Atmospheric Correction and Quality Retrieval via C2RCC
The preprocessed imagery is passed to the C2RCC (Case-2 Regional / CoastColour) processor, a deep learning model specifically designed for optically complex inland and coastal waters. C2RCC uses neural networks trained on a database of five million simulated water-leaving reflectance and top-of-atmosphere radiance cases to perform atmospheric correction and extract inherent optical properties of the water body in a single integrated step.
To run correctly, C2RCC requires locally sourced environmental parameters for each satellite acquisition:
Salinity: Set to 0.0001 for freshwater (the minimum value the processor accepts; true freshwater value is 0).
Temperature, ozone, and air pressure at sea level: Sourced from in-situ monitoring stations and global climate datasets, matched to the time of the Sentinel-2 pass.
Elevation: Derived directly from WARM's own DEM modelling output — linking the water quantity and quality workflows.
Water Quality Parameters Extracted
C2RCC produces a set of inherent optical properties from which WARM extracts four key water quality indicators:
conc_chl — Chlorophyll-a concentration (mg/m³): The primary indicator of algal biomass. Elevated chlorophyll signals eutrophication, excess nutrients feeding algal growth, which can deplete oxygen, kill fish, and produce toxins harmful to humans.
conc_tsm — Total Suspended Matter (g/m³): The concentration of particles suspended in the water column, sediment, organic matter, and pollutants. High TSM indicates turbidity, reducing water clarity and affecting treatment requirements.
iop_agelb — Gelbstoff absorption coefficient (m⁻¹): A measure of dissolved organic carbon, coloured dissolved organic matter associated with terrestrial runoff and organic pollution from agricultural or urban sources.
kd_z90max — Water clarity depth (m): The depth from which 90% of water-leaving irradiance originates, a direct measure of how deep you can 'see' into the water, describing overall transparency and optical water quality.
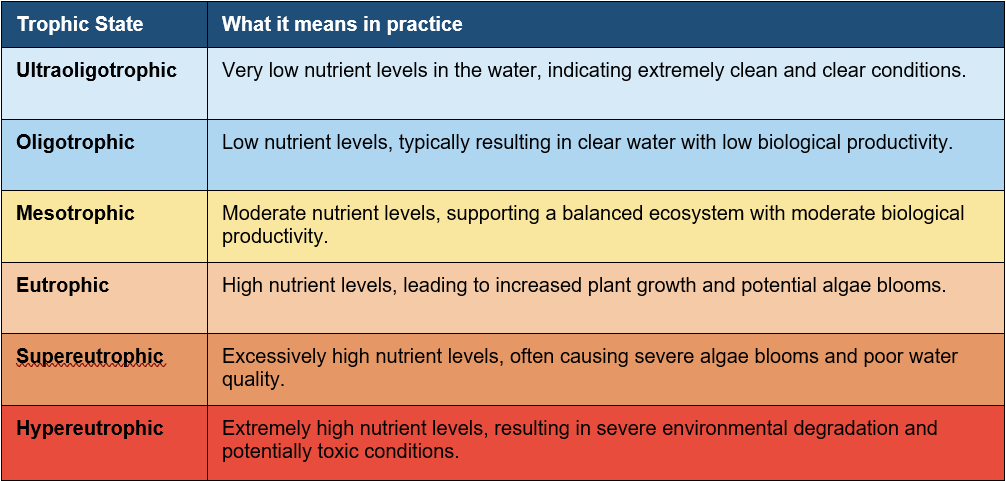
Trophic State Classification
Retrieved chlorophyll-a concentrations are mapped to the internationally recognised Trophic State Index (TSI), a six-level scale that translates a scientific measurement into a clear, actionable classification for water managers and authorities:
The System in Action: Two Rivers, Two Challenges
Córdoba, Spain: Detecting a Pollution Crisis on the Guadalquivir
In May 2021, residents living in the historic centre of Córdoba raised the alarm publicly. The Guadalquivir River, flowing through one of the world's most celebrated UNESCO World Heritage sites, was visibly polluted. Sewage and wastewater had accumulated near the Molino de Martos area due to failing spillways. Residents contacted UNESCO, concerned the contamination was putting the city's heritage status at risk (El Día de Córdoba).
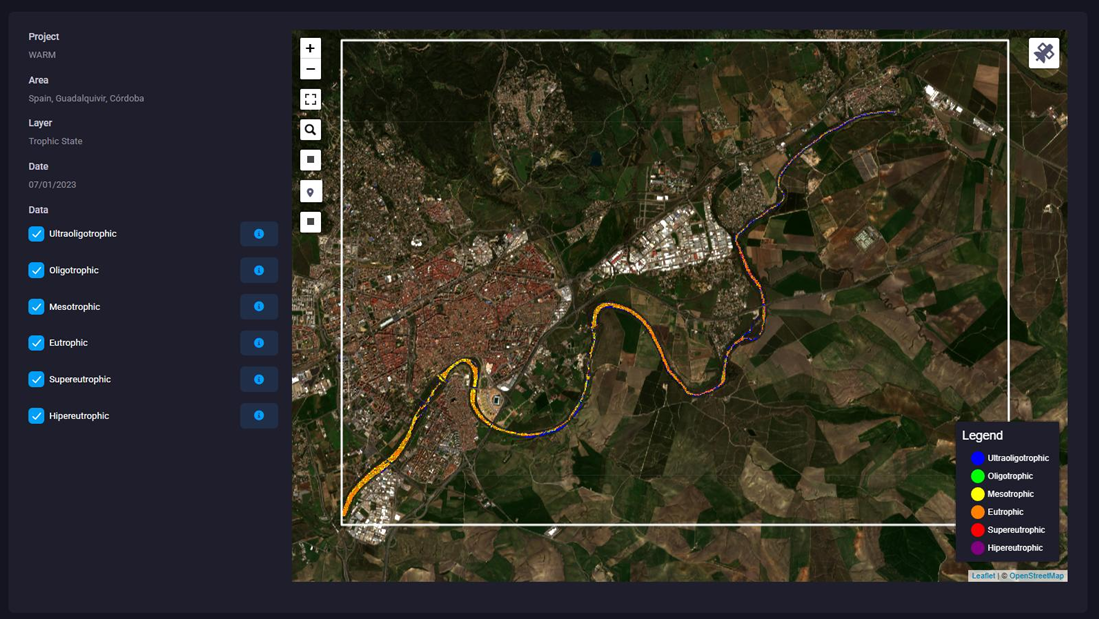
This kind of acute pollution event, sudden, localised, and with immediate public health and environmental implications, is exactly what WARM's water quality monitoring is built to detect and track. Satellite imagery acquired around the time of the incident shows the trophic state classification of the Guadalquivir shifting across dates, with eutrophic and supereutrophic zones spreading along the river course as pollution accumulated, and retreating as conditions improved. For water managers and civil protection authorities, this means moving from anecdotal resident reports to satellite-verified, spatially precise evidence, enabling them to identify source zones, assess severity, and monitor whether remediation measures are working, all from a desk.
Tana River, Kenya: Flood and Drought Monitoring Under Cloud Cover
The Tana River is Kenya's longest river, with a catchment area of approximately 126,208 km² and an estimated population of 6.96 million people (density of 55 persons/km²). The river supplies 95% of the water for Nairobi's 4 million residents plus an additional 5 million people in the watershed, and generates half of Kenya's hydropower output through the Seven Forks dams complex (Water Resource Authority). It also sustains one of East Africa's most biodiverse floodplain ecosystems, including two Critically Endangered primates endemic to the Tana Delta. The basin is a river of extremes: severe seasonal flooding in wet years, sharp water level declines and acute scarcity in dry ones.
The main challenges for satellite-based monitoring in the Tana Basin are twofold. First, persistent cloud cover during the rainy season, precisely when flood information is most needed, renders optical imagery (Sentinel-2) unusable for weeks at a time. Second, a lack of in-situ data limits access to complementary monitoring information not derivable from satellites, such as rainfall amounts, water speed, and other ground-based observations that would provide a more complete hydrological overview.
WARM directly addresses the first challenge through Sentinel-1 radar (SAR) integration. SAR imagery provides complete, cloud-independent surface water detection and level estimation during active flood events. Combined with long-term water quantity trend analysis, historical metrics, and water quality monitoring, WARM delivers a consistent, year-round operational toolset for Kenyan water authorities and disaster management agencies. Where in-situ data is available, it complements and enhances the satellite-derived information, offering a more integrated picture of the basin's water status.
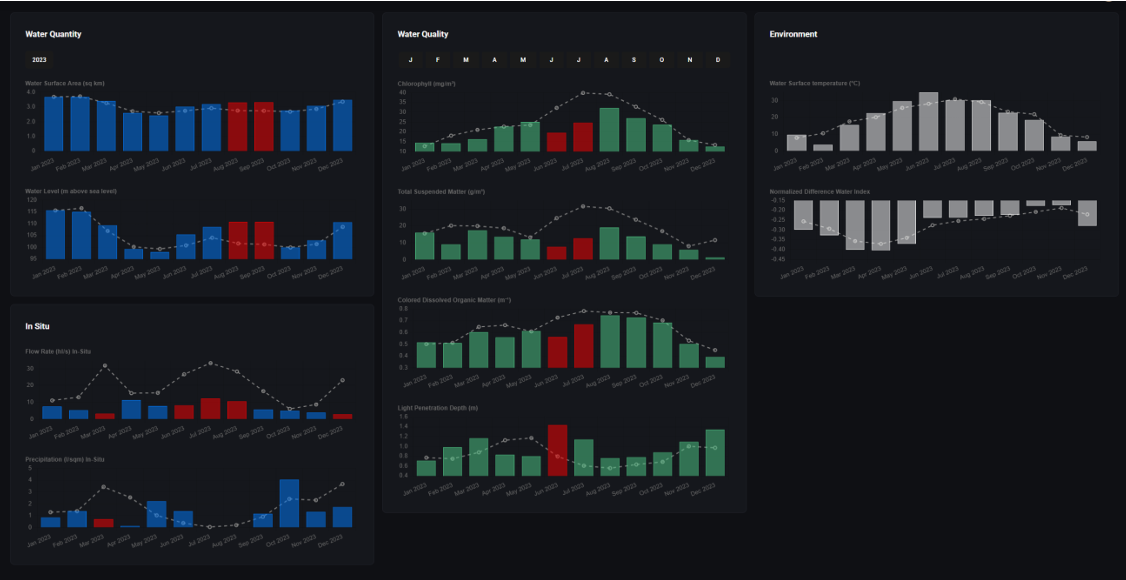
The Monitoring Application: Turning Data into Decisions
All WARM outputs, including water extent, water levels, and water quality classifications, feed into a purpose-built monitoring application designed for operational use by decision-makers who do not need to be remote sensing specialists. The application is not a data archive. It is a situational awareness and trend intelligence tool.
Yearly development charts: Visual timelines of how water extent, level, and quality evolve across each calendar year, with historic median and deviation bands that make anomalies immediately visible.
Seasonal pattern and trend analysis: Automated identification of wet-season and dry-season cycles, enabling authorities to anticipate what is coming rather than only react to what has happened.
Data fusion and multitemporal aggregation: Users can navigate across time periods and sensor types, comparing water states across weeks, months, or years.
Conclusion: A Replicable Model for Space-Based Water Security
The challenge of water monitoring, knowing how much water exists, where it is, and whether it is safe, is one of the defining information challenges of climate adaptation and disaster risk management in the twenty-first century. Traditional ground-based approaches cannot scale to meet it. The WARM project demonstrates what becomes possible when satellite Earth Observation and artificial intelligence are combined into an integrated, operational workflow.
From detecting an acute sewage pollution event at a UNESCO World Heritage site in Spain to mapping flood inundation across a Kenyan river basin under complete cloud cover, WARM delivers the kind of timely, reliable, and spatially precise intelligence that supports real decisions: when to issue a flood warning, when to restrict water use, when to investigate a pollution source, and where to invest in infrastructure resilience.
These innovative approaches directly align with the mandate of UN-SPIDER to ensure that space-based information supports all phases of the disaster management cycle:
Disaster Risk Reduction: Long-term water quantity and quality trend analysis identifies chronic drought-prone stretches, persistent pollution zones, and areas of declining water availability, enabling proactive investment in resilience before a crisis strikes.
Early Warning: Near-real-time surface water extent monitoring, particularly via radar for cloud-affected regions, supports timely detection of flood inundation and sudden water quality deterioration events.
Preparedness: Historical seasonal pattern analysis informs contingency planning: pre-positioning resources, establishing alert thresholds, and training response teams based on evidence rather than assumption.
Response and Recovery: Multitemporal satellite monitoring during and after a disaster provides authoritative spatial data to direct emergency operations and track the pace of recovery.
The tools exist. The data is free. The workflows are reproducible. The barrier to bringing space-based water intelligence to more river basins, more national agencies, and more communities at risk is lower than it has ever been.