Earth observation and geospatial information in support of risk and disaster management
Earth observation and geospatial information in support of risk and disaster management
Flood hazard assessment with the help of satellite imagery
Flood hazard assessment with the help of satellite imagery
Matthias Zink, Dresden University of Technology
Juan Carlos Villagran de Leon, United Nations Office for Outer Space Affairs, United Nations Platform for Space-based Information for Disaster Management and Emergency Response (UNOOSA/UN-SPIDER)
Introduction
In many cities in developing countries there is a tendency for hazards associated with floods to increase as a consequence of inadequate urbanization processes. Unfortunately, it would seem that the two main driving factors responsible for this increase remain hidden from the view of actors such as developers, individual citizens seeking to establish themselves in urban areas, and city planners. The first factor is the shrinking of the width of channels in rivers flowing through urban areas when owners and developers construct houses and buildings along the shores of rivers at the expense of the channel. The net effect is an increase in the level of water during floods, because there is less space for retention areas. The second factor is the increasing degree of sealing or impermeability of the ground within the basin as a consequence of urban and industrial growth. This sealing of the ground leads to a higher rate of effective runoff, as less precipitation can be stored in the ground.
An important first component of flood management in urban areas is hydrological modeling. However, a typical challenge in the case of developing countries is the modeling of the ongoing hydrological processes with a very limited amount of data. This document presents the results of a case study focusing on the city of San Antonio de Belen in Costa Rica, which was conducted by the authors within the Risk Management Section of the Institute for Environment and Human Security of the United Nations University in 2008 (UNU-EHS). The document presents an example of the use of satellite imagery and aerial photographs to gather information which is essential to generate data that can be used to perform the hydrological modeling needed to explain emerging floods in urban areas due to improperly planned urban growth.
San Antonio de Belen, Costa Rica, and the Quebrada Seca Basin
As one of the municipal districts neighboring San Jose, which is the capital city of Costa Rica; and very close to the Juan Santamaria International Airport, San Antonio de Belen became host to large industrial establishments over the decades, and more recently to residential areas as well. Unfortunately, the decades of improper urban growth and industrialization have led to more frequent and more intense floods.
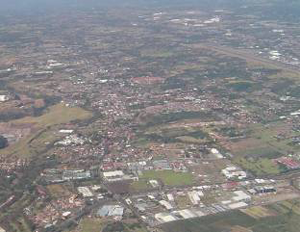
Figure 1: Aerial view of the city of San Antonio
The river provoking these floods is called Quebrada Seca and it has a watershed area of 20.2 km². While it can be considered a small river, in recent years it has provoked severe floods in San Antonio de Belen. San Antonio de Belen (figure 1) lies on the foothills of two volcanoes, one of them being the headwater of the Quebrada Seca river. So altitudes around 1700 m are dominating the upstream segment of the basin, while lower reaches are located in altitudes around 900 m. With an elongated shape, the length of the watershed is 19.5 km and the mean slope is 5.2%. Furthermore the two upstream river reaches have approximately the same river length of 8.5 km. As a consequence, the respective peak flows may reach the intersection at the same time. Figure 2 shows an overview of the watershed of the Quebrada Seca river.
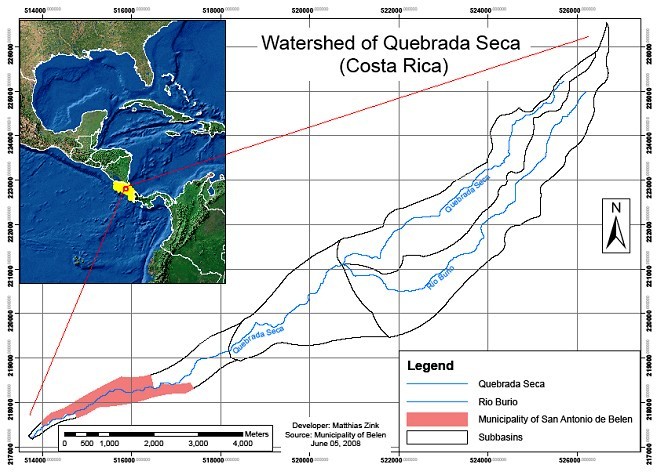
Figure 2: Watershed of the Quebrada Seca river.
Aerial photography and satellite imagery
A very important parameter related to the infiltration capacity is the type of land-cover. Because land cover information was not available, it was necessary to develop digital land-use maps using existing aerial photographs and recent satellite images. Aerial photographs taken in 1945 represent the situation of the basin before heavy industrialization took place. A satellite image from the year 2005 covering the lower and middle parts of the basin was complemented with Google Earth Images to generate the required information concerning land-cover and land-use. Using land-cover definitions related to the runoff curve number (USDA, 1986), land-cover types were developed for the watershed of the Quebrada Seca. Table 1 shows the definition of land-cover types corresponding to the spatial distribution of single land use classes. These land use classes correspond to those defined in the Curve Number (CN) method. The CN indicates the infiltration capacity of a given type of soil and thus the hydrological behavior of that particular soil. Together with the spatial weights of each land use class, the CN of the different land-cover types can be determined.
To conduct the hydrological modeling, the CN data corresponding to the different soil types had to be determined. The data were gathered from studies which have been conducted by local researchers in this watershed (Arguedas, Campos, & Ballestero, 2002 and Serrano, 2004). The volcanic ashes and sand-dominated region has a high fraction of soils which have a good to moderate permeability for water and clay contents less than 10%. As defined by the United States Department of Agriculture (USDA, 2007), these soils can be classified as type A, which show a good condition for high infiltration capacities. Nevertheless, it is important to keep in mind that there are high slopes in some segments of the watershed and high rain intensities which decrease infiltration and create higher flood potentials.
| Category | Land-Cover Type | Description |
|---|---|---|
| Agriculture-dominated land-cover | Agriculture | 100% crops |
| Agriculture and residential | 90% crops, 10% residential | |
| Greenland and crops | 80% crops, 20% greenland | |
| Agriculture, residential and greenland | 75% crops, 15% residential, 10% greenland | |
| Settlement-dominated land-cover | Low density of settlement | 35% residential, 65% woods and grass |
| Average density of settlement | 50% residential, 40% houses and industries, 9% greenland, 1% streets | |
| High density of settlement | 97% housing and industries, 3% streets | |
| Average density of residential | 70% residential, 20% industries, 9% greenland, 1% streets | |
| Residential | 100% residential | |
| Housing and industries | 100% housing and industries | |
| Natural-dominated land-cover (forests, tree-covered coffee plantations) | Woods and grass | 100% woods and grass |
| Very low density of settlement | 85% woods and grass, 15% residential | |
| Woods and grass, agriculture, residential | 60% woods and grass, 30% crops, 10% residential |
Table 1: Definition of land-cover types within the watershed as well as generalization into three categories of land-cover
Because of the high infiltration capacity of these soils, it can be assumed that the infiltration within the watershed is influenced mainly by two parameters: land-cover and the slope. Thus the determination of the land-cover becomes an important factor in relation to the accuracy of the hydrological model.
The land-cover types were summarized into three categories: agricultural, urban, and natural-dominated, to get a better visualization of the urbanization. The results of the processing of the aerial photographs and satellite imagery are presented in Figure 3 and manifest the large difference in the land-cover regimes between 1945 and 2005. The 2005 land-cover map shows that the watershed is dominated by urban areas. These areas cover 65% of the watershed. In comparison with the map of 1945 the urban dominated area increased to nearly double (increasing of urban area by 48%). The reason for this change has been a process of industrialization in the central part of the basin, (e.g. Bridgestone, Intel, and Coca Cola industrial plants for example) and a more recent urbanization in terms of residential neighborhoods throughout the basin. So, Belen has become one of the most developed municipal districts in Costa Rica. Unfortunately, throughout the decades, local authorities were not aware of the impacts of industrialization and urbanization in the context of floods.
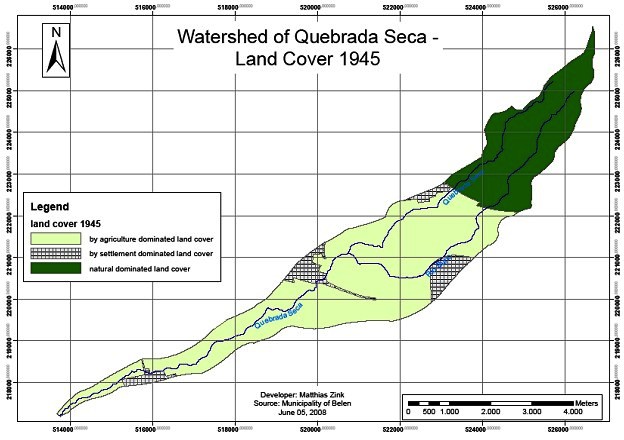
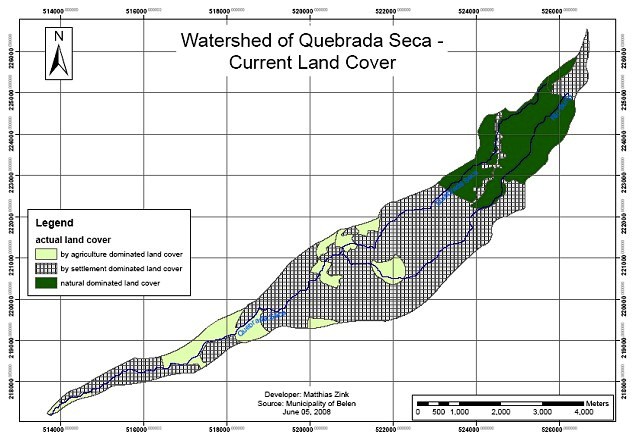
Figure 3: Land-use patterns in the Quebrada Seca basin. The upper map corresponds to 1945, while the lower one to 2005.
With the information on CN values, the HEC HMS software (Hydrologic Engineering Center – Hydrologic Modeling System) was used to generate a rainfall runoff model for the watershed of the river and the HEC-RAS software (Hydrologic Engineering Center – River Analysis System) was employed as a flood routing model within the downtown area of the city of San Antonio de Belen.
Results
The extreme change in the land cover within the watershed leads to the assumption that flood hazard in the downstream segment of the basin is increasing significantly. The simulations done with HEC-HMS prove this hypothesis. Figure 4 shows a comparison of the discharge simulated for both 1945 and 2005, taking as input data the precipitation of 13 July 2007, which generated a flood that lead to severe damages in the city, as well as in other regions of the basin.
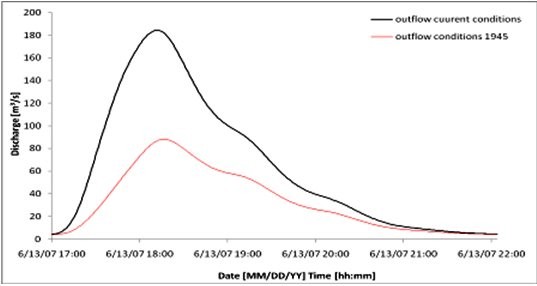
Figure 4: Simulations of discharge using both HEC-HMS and HEC-RAS. The red curve shows the simulated discharge corresponding to 1945, while the black curve shows the simulated discharge for 2005.
The comparison of the peak flows shows an increase from 88 m³/s in 1945 to 184 m³/s in 2005 due to the land cover changes. So the peak flow at this special event has more than doubled. But a much more interesting figure is the amount of water flowing during the flood event. The total amount of floodwater in 1945 would have been around 620,000 m³ while in 2005 it was calculated at 1,190,000 m³.
The increase in discharge is represented in the water levels simulated with HEC RAS as well. As it can be seen in Figure 5, the water level increased at specific cross sections in the downtown area by more than 1.5 m. The selected example shows that the same precipitation may not lead to overtopping of the bank in 1945, while in 2005 it does.
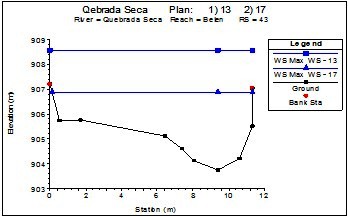
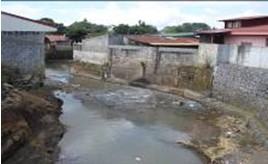
Figure 5: HEC RAS simulation of maximum of water levels at a cross section in the downtown area of Belen. The figure shows the simulation result while the photo shows this cross section as it looked in 2007.
Conclusions
The use of satellite imagery allows scientists to track land-use changes, and to generate quantitative information regarding land-cover that is required to run hydrological models. Without such information, quantitative estimations of the amount of water retained by the watershed itself are nearly impossible. The quantification of impacts of land-cover changes on the hydrological regime are of high interest in the current research. In this context the use of satellite imagery allows scientists to classify land-cover patterns and to quantify areas according to their land-cover type with standard GIS software. Such information can then be used e.g. by hydrologists to run rainfall-runoff models to assess the degree of flood hazard in particular geographical areas thereby helping local authorities and administrations to develop land-use plans in order to avoid the exposure of resources or lives to such floods.
References
- Arguedas, M. H.; Campos, G. L.; Ballestero, C. R.; 2002: Análisis de posibles soluciones al problema de las inundaciones, en el cantón de Belén, producto del desbordamiento de la Quebrada Seca.; Universidad de Costa Rica, Facultad de Ingeniería, Escuela de Ingeniería Civil.
- Serrano, L. S.; 2004: Modelación Hidráulica de la Quebrada Seca para el Control de Inundaciones en el Cantón de Belén; Universidad de Costa Rica, Facultad de Ingeniería, Escuela de Ingeniería Agrícola.
- United States Department of Agriculture (USDA); 1986: Urban Hydrology for Small Watersheds TR-55, Natural Resources Conservation Service.
- United States Department of Agriculture (USDA); 2007: National Engineering Handbook, Hydrologic Soil Groups; Natural Resources Conservation Service.
- US Army Corps of Engineers; 2000: Hydrologic Modeling System HEC-HMS, Technical Reference Manual; Hydrologic Engineering Center.
- US Army Corps of Engineers; 2008: Hydrologic HEC-RAS River Analysis System, Hydraulic Reference Manual; Hydrologic Engineering Center.
A prototype design for a Web-GIS disaster support system: The Bolivia Amazon case study
A prototype design for a Web-GIS disaster support system: The Bolivia Amazon case study
Vicente García García, Humberto L. Perotto-Baldivieso, Stephen Hallett
Natural Resources Department, Cranfield University, United Kingdom
Introduction
Frequency and severity of natural disasters are reportedly increasing worldwide, partially due to population increase and increasing concentration of populations in hazard-prone environments (1). Their effects are related to the vulnerability of the affected area and the proximal human population (2). Flooding is one of the most serious and common natural disasters. Flooding statistics show how in the last 20 years there have been more than 2,800 flooding events with over 2,000,000,000 people affected and over 190,000 people killed (Table 1).
| Number of flood events | 2,887 |
| Number of people killed | 195,843 |
| Average number of people killed per year | 6,753 |
| Number of people affected | 2,809,481,489 |
| Average number of people affected per year | 96,878,672 |
Table 1: Flood statistics (1980 – 2008) (3)
Geospatial data can be used to develop analytical modelling, risk mapping and vulnerability area mapping as well as to support and execute emergency response plans. Morover, GIS can serve as a spatial inventory system for coordinating recovery activities (4), (5).
Although GIS and spatial data play an important role in disaster management, data formats and data standards can also prove a limiting factor in the deployment of GIS infrastructure. The number of organizations, agencies and private companies around the world that produce and use spatial data (geospatial data) is continuously increasing; therefore there is a need for GIS interoperability to share geospatial data, services and functionality (6). An effective strategy to achieve the GIS interoperability is by creating a Spatial Data Infrastructure (SDI).
SDI is defined as the combination of technology, policy and institutional arrangements that facilitate the availability and access to spatial data. SDI provides a basis for spatial data discovery, evaluation, and application for users and providers within all levels of the government, the commercial sector, the non-profit sector, the academic sector, and by the public(7). SDI as an information infrastructure can help by providing spatial data and supporting decision-making for disaster management. Designing an SDI model for a disaster management, utilizing important spatial data, non-spatial, semantic data, associated metadata and communication technologies (ICT) in disaster management can improve decision-making and increase the efficiencies and effectiveness of all level of disaster management activities from mitigation to preparedness, response and recovery phases (8).
The use of Web-based platforms for SDI provides the capability of delivering GIS information and functionality to a wide number of users via the Internet. A recent development is the increasing deployment of Free or Open Source GIS tools (FOSS-GIS). In adopting FOSS-GIS, users do not need to have proprietary GIS software installed, thereby reducing software costs and software installation troubles. In applications such as disaster magagement the use of Web-based GIS tools can prove extremely effective. Such a prototype ‘platform’ can comprise components which include a Web server (eg. Apache), as well as the software for publishing spatial data and interactive mapping applications to the Web. Given the wide number of FOSS-GIS server applications and GIS platforms now available, there is a need to assess their feasibility for disaster management applications in areas where data standards can be a limiting factor.
Bolivia is subject to periodical flooding in the tropical lowlands (on the eastern plain, or “Llanura oriental”) and every year there are signigificant losses in livestock and property. Most of the water that floods the “Llanura oriental” originates from the valleys and mountains in the upper reaches of the Amazon watershed. The first two floods to be widely documented using GIS and remote sensing were the flooding events of 2007 and 2008 (9). Data for these events is made publicly available at the Bolivian Natural Resources Digital Center (BNRDC, http://essm.tamu.edu/bolivia). The first SDI with standardized formats for Bolivia was created by the BNRDC in 2004. Data was formatted and prepared to meet scale and projection standards at the national level using the Bolivian legal framework. Since this time, the BNRDC has provided the most comprehensive repository for spatial data at the national level. Data offered by BNDRC includes social (e.g. infrastructure, political boundaries) and natural (e.g. ecosystems, soils, digital elevation models) spatial information and it is made available to the public at no cost. However, data is managed in a GIS-native format and therefore the use may be limited to users with relevant GIS experience.
The idea of developing a prototype for a Web-GIS disaster support system therefore emerged as a means to combine the existing SDI with contemporary Web-GIS developments for the design and implementation of spatially explicit online decision support systems for disaster management. This paper presents the development of an online disaster support system designed to provide key information to end-users and policy makers where a massive flood event is occurring or has occurred. The specific project objectives were firstly to evaluate the applicability of different Web-GIS platforms for the implementation of the disaster support system, and secondly to assess its acceptance among scientists, decision makers, and the general public.
Methodology
Case Study and Data collection
The 2007 and 2008 floods in the Bolivian Llanura oriental were chosen as a suitable case study for the development of a prototype disaster support system, given the extensive data available for these events, and the willingness of the Bolivian Natural Resources Digital User Group to participate in an applicability survey, conducted via an online questionnaire. Data used in this project was provided by BNRDC in ESRI Shapefile format (10). The spatial data available on BNRDC is in a geographic coordinate system WGS84 (decimal degrees latitude, longitude). Data provided was divided into five categories: administrative (departments, provinces, municipalities and department capitals), infrastructure (hospitals, airports, harbours, primary roads, and railways), natural spatial data (rivers, geology, protected areas, and watershed information) and flooding data (2007 and 2008 flooding, potential floods areas and potential draught areas).
Platform selection and platform design
The system platform selected for the disaster support system was based on the choice of the Web client for the Web-GIS. The Web client provides the interface that allows the users to visualize, navigate and analyze the geospatial data via the Web. We selected three Web clients to test the online disaster support system, namely: ‘p.mapper’, ‘OpenLayers’ and ‘Chameleon’ (11). The selection of the Web client was based on the following criteria:
- Free or open source software (FOSS);
- Quality of navigation tools provided;
- Management tool provided for hierarchical layer management;
- Capabilities of query and measurement tools;
- Capabilities for scale management and search functionality;
- Ease of interface customization, plug-ins and functions compatibility;
- Programming languages supported;
- Established community of users and developers;
- Support for the OGC-compliant services, WMS and WFS; and
- Data interoperability (vector, raster, PostGIS).
Based on the above criteria, p.mapper was selected as it meets the majority of the requirements, and a prototype tool was developed, a detailed explanation of which is presented in the results section below. The p.mapper server is a MapServer application based on PHP/Mapscript. The freely available MapServer for Windows package (MS4W) was selected, installing the pre-configured Web server environment required to establish a p.mapper application (comprising the Apache Web server, MapServer, PHP, Mapscript, and the Geospatial Data Abstraction Library, or GDAL). Once installed MS4W provides the possibility for updating individual components without affecting or modifying the rest of the installed applications – a concern for managing ongoing support for such an application platform.Once MS4W was established, the object-relational database system PostgreSQL and its extension PostGIS was also installed to provide the underlying data repository for the platform. A key stage then involved the conversion and export of the Bolivian geospatial data, from shapefiles, into the PostGIS database format. Finally the p.mapper application was customized to meet the needs of the prototype (Fig. 1).Detailed information about the development of the Web-GIS platform is provided by (12).
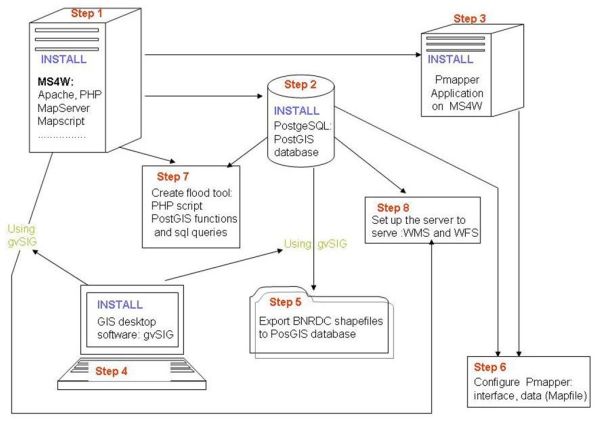
Figure 1: Platform design for the disaster support system prototype.
User group acceptance
The finalized Web-GIS prototype (http://ccmap-dmz.dmz.cranfield.ac.uk/index.phtml) was next presented to the BNRDC user group who were then able to provide feedback via an online questionnaire (12). The questionnaire adopted was divided into 6 sections and totalling 23 questions. The questions were categorised as: general overview; tools; symbology and legend; map; download and print; and conclusions and recommendations, with respondees being invited to complete a questionnaire reflecting their experience of running the prototype. Scoring for each question ranged from 1 (being very poor) to 5 (being excellent). Questionnaire results were analysed and interpreted using boxplots (13).
Results
Platform selection and platform design
The p.mapper tool was selected as a Web client as it was found to address substantially the technical requirements of the prototype. A comparative review between p.mapper and the other comparable FOSS tools Chameleon and OpenLayers is reported in Table 2. Some of the main characteristics that defined the choice for the final selection include:
- Significant number of navigation tools: ease of ability to zoom in, zoom out, select full extent, pan forward and backward, and zoom to selected points;
- Information tools: strength of layer attribute queries;
- Area and distance measurements;
- Bookmarking and selection tools;
- Data export reporting (e.g. pdf file production) and printing tools;
- Hierarchcial layer arrangement and layer visualization;
- Interface customization; and
- Access to open source software.
| Web client | Program. language | Data support | OGC support | Server dependency | Nav. control tools | Layer info tools | Search tools |
|---|---|---|---|---|---|---|---|
| Chameleon | Javascript; PHP | PostGis Web Map Context | WMS | Yes UMN MapServer | good | some problems | good |
| p.mapper | Mapscript; PHP | PostGis Shapefile Tiff ECW | WMS; WFS | Yes UMN MapServer | very good | very good | very good |
| OpenLayers | Javascript | GML, KML, Shapefile | WMS; WFS | No | good | no | no |
Table 2: Technical Characteristics API
The software selected to implement the Web component was MapServer because the p.mapper application is complementary to MapServer. Map Server was integrated with the installation of the Apache HTTP Server. Once the system was established, it was made publicly available online via Cranfield University’s Web servers (http://ccmap-dmz.dmz.cranfield.ac.uk/index.phtml) (Fig. 2).
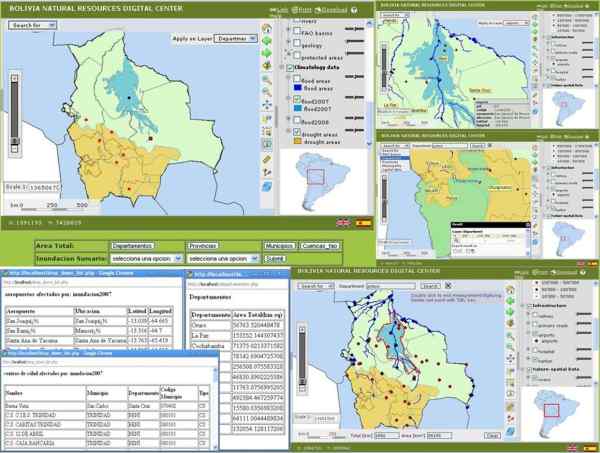
Figure 2: Disaster Support System Web-GIS application finalized. The screens portray several snapshots of the flooding management support system in Bolivia.
In this Web-GIS users are able to navigate through the data with the zoom and pan tools, select features, extract information from the features, export data, print the map, analyse and interpret the data, search for attributes and obtain information about the spatial parcels affected by the floods.
User group acceptance
A total of 23 BNRDC users provided feedback via the online questionnaire. The median answer across the questionnaire for all questions was found to be equal or greater than 3, indicating a general positive acceptance of the Web-GIS platform used as a flooding support system. Questions relating to the ease of use of the interface, the speed of use, and the overall appearance had medians equal or greater to 3 with the highest scores given to the graphical interface and general appearance of the user interface (Fig. 3).
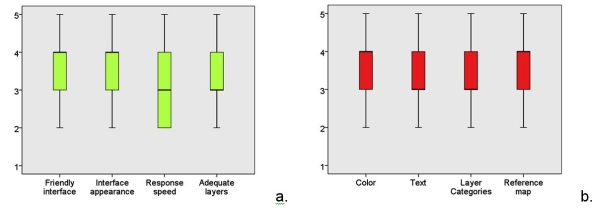
Figure 3: User response box plots summarising acceptance questionnaire results for (a) General overview, and (b) Lay out. Note, values in the Y axis represent the degree of acceptance with 1 being very poor and 5 being excellent.
Download and printing capabilities received average scores while most display tools received average to good scores. Map composition capabilities and expectations received good scores. Most users who participated reported themselves as satisfied with the interface and several suggestions were proposed to improve the Web-GIS platform. Overall satisfaction scores indicate that 22 % of the users were not satisfied with the application, 59 % were satisfied and 18% were very satisfied.
Discussion and Conclusions
The selection criteria adopted for identifying the component parts of the prototype platform were based on the provision of powerful tools for Web-GIS disaster management and decision support. The platform selection was based primarily on the Web client interface. A comparison and evaluation was conducted for three Web client platforms, namely: Chameleon, p.mapper, and OpenLayers. Whilst the first two possess some similar features (MapServer dependency, PostGIS data and WMS support, open source) and have a significant number of users and developers, it was concluded that p.mapper offered more possibilities with user on-screen navigation, and data query tools, as well as more advanced layer management options and wider data support formats. One of the limitations observed is that when customizations were required in the interface, a medium level of knowledge in PHP and Javascript was required, thus making the process more complex.
The questionnaire proved a useful tool in assessing the acceptance and overall satisfaction of the users who tested the prototype. The results indicated medium to good acceptance overall, together with feedback that provided important information for future improvements to the disaster support system. An important aspect observed among the participants is that most of them were looking for information beyond solely the map. Tools used to analyse and gather information were ranked very high in acceptance scores, indicating that users were seeking more than just mapping functionality. Users were seeking the means to quantify the infrastructure impacted by the flooding as well as identifying available infrastructure and they were using the full potential of the GIS tools offered in order to assess the damage and seeking then to use the information to develop informed decisions. Some of the feedback provided by the BNRDC user group included a clear operational requirement for the future use of remote sensing data with real or near-real time satellite information to assess the progress of floodings. Future developments in this area will include the integration of raster formats in the disaster support system presented here.
The Web-GIS platform p.mapper was selected as the mapping engine as it satisfied best the operational criteria. The questionnaire results provided key insights as to stakeholder requirements for receiving spatial displays and maps, as well as to the infrastructure information required in order to develop effective, time bound strategies for disaster management. The final prototype system exhibits several advantages for its ongoing implementation. Firstly, it does not require specialist software such as GIS to be pre-installed on user computers. Secondly, it adopts open-source ‘FOSS’ software tools, which reduce significantly the costs of implementation. Thirdly, it can operate with both vector and raster spatial data formats, making its integration with wider raster models and future satellite imagery possible. Key user feedback suggested the need for future integration of Aster DEM datasets and real time or near-real-time satellite imagery. The approaches adopted are consistent with such future enhancement and were also found to have relevance in addressing other disaster management application themes such as droughts and landslides, as well as other wider areas, such as management of biodiversity and conservation monitoring.
References
- S. Cutter, and C. Emrich, Are Natural Hazards and Disaster Losses in the U.S. Increasing? EOS/Transactions of the Amer. Geophys. Union 86, 381–396 (2005).
- M. Hussain,M. H. Arsalan, K. Siddiqi B. Naseem, and U. Rabab, Emerging Geo-Information Technologies (GIT) for Natural Disaster Management in Pakistan: an Overview. Recent Advances in Space Technologies, 2005, 487 – 493 (2005).
- EM-DAT, The OFDA/CRED International Disaster Database, Université Catholique de Louvain, Brussels, Belgium (2008).
- FEMA - Federal Emergency Management Agency, Information Technology Architecture, Version 2.0 – The road to e-FEMA (Volume 1), Washington, U.S.A. (2001).
- T. J. Cova, GIS in Emergency Management, in Geographical Information System: Principles, Applications, and Management (P.A. Longley, M.F. Goodchild, D.J. Macguire, D.W. Rihind, Eds.) Jonh Wiley & Sons, New York, p.p. 845-858 (1999).
- OGC, OpenGIS Web Map Server Cookbook Version 1.0.2, Open Geospatial Consortium Inc. http://portal.opengeospatial.org/files/?artifact_id=7769 (2004).
- GSDI, the SDI cookbook, http://www.gsdi.org/docs2004/Cookbook/cookbookV2.0.pdf (2004).
- A. Rajabifard, A. Mansourian, M. J. V. Zoej, and I. Williamson, Developing Spatial Data Infrastructure to Facilitate Disaster Management. In proceeding of GEOMATICS83 6 p. (2004).
- MDRAyMA Ministerio de Desarrollo Rural, Agropecuario y Medio Ambiente., Mapa de Areas y Predios Afectados por las Inundaciones de La Niña 2007- 2008 (2008).
- CDRNB - Centro Digital de Recursos Naturales de Bolivia, http://essm.tamu.edu/bolivia/ (2004).
- MapTools, http://www.maptools.org (2010).
- V. García García, A Prototype Design for a Web-GIS Disaster Support System: The Bolivia Amazon Case Study, M.Sc. thesis, Cranfield University, Cranfield, U.K. (2010).
- R.L. Ott, An Introduction to Statistical Methods and Data Analysis. Belmont, CA: Duxbury Press (1992).
Contact
Humberto L. Perotto-Baldivieso
Natural Resources Department
Cranfield University
Cranfield, MK43 0AL
United Kingdom
(T): + 44 1234 750111
(F): + 44 1234 752970
(E): h.perotto [at] cranfield.ac.uk
Earthquake emergency preparedness in Central-Hungary - Preparing rapid response measurements using Remote Sensing and GIS-methods
Earthquake emergency preparedness in Central-Hungary - Preparing rapid response measurements using Remote Sensing and GIS-methods
Barbara Theilen-Willige, TU Berlin, Institute of Applied Geosciences, Department of Hydrogeology, Germany
Helmut Wenzel, VCE Holding GmbH, Vienna, Austria
Introduction
As prerequisite for earthquake emergency planning there is a strong need to improve the systematic, standardized inventory of areas that are more susceptible to earthquake ground motions or to earthquake related secondary effects such as landslides, liquefaction, soil amplifications, or compaction. A uniform data base with a common set of strategies, standards and formats should be implemented. The evaluation of satellite imageries, digital topographic data and open-source geodata can contribute to the acquisition of the specific tectonic, geomorphologic / topographic settings influencing local site conditions.
GIS is used as a tool to represent the earthquake hazard parameters as far as possible - in the form of geographical maps, which is most useful for government agencies, non-governmental organizations, business communities and public when planning emergency preparedness and hazard management.
Earthquakes in Hungary
Seismicity in Hungary is relatively low comparing to the adjacent areas. However, magnitude 6.0-6.5 earthquakes are documented. Fig.1 shows the distribution of earthquake epicentres in Central-Hungary, emphasising earthquakes with magnitudes M > 4. As cities and settlements, infrastructural facilities, and numerous industrial plants are concentrated along the Danube river, the necessity of earthquake awareness and preparedness is evident.
Earthquake hazards in Hungary mainly occur due to
- ground shaking
- soil amplification because of local site conditions
- liquefaction and compaction
- landslides
- movements along active fault zones and aseismic movements in the subsurface (horizontal and vertical).
It has been observed that at many sites surface motions are influenced primarily by the internal conditions within the top 20-30 m sub-surface layer. These conditions influence amplitude, frequency and duration of ground motion at a site. Local site conditions play an important role when considering earthquake shaking and damage intensities and their local variations: The ground-shaking during an earthquake predominantly depends on factors such as the magnitude, properties of fault plane solutions, the distance from the fault and local geologic conditions. The most intense shaking experienced during earthquakes generally occurs near the rupturing fault area, and decreases with distance away from the fault. Within a single earthquake event, however, the shaking at one site can easily be stronger than at another site, even when their distance from the ruptured fault is the same. The variability in earthquake-induced damage is mainly determined by the local lithological properties, thickness of the soil and lithologic unit layer, by hydrogeological and by geomorphological conditions (Fig.2).
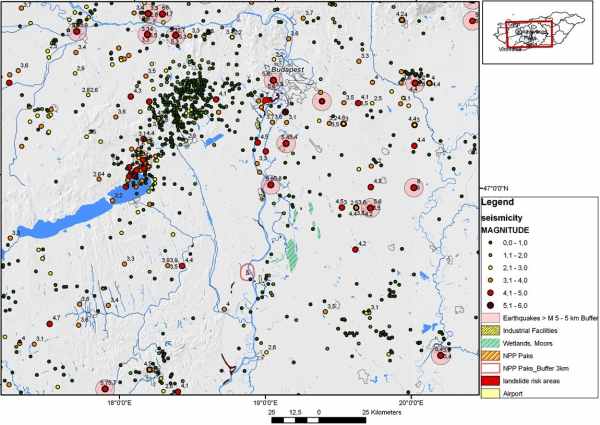
Figure 1: Seismicity in Central-Hungary
Earthquake data: ISC, World Stress Data, BGR, GeoRisk, ZAMG, GFU, USGS
Groundwater level variations and associated saturation changes in sand layers within near-surface aquifers can influence local response spectra of the ground motion, through modification of shear-wave velocity. Changes of the groundwater level can also have a considerable influence upon the liquefaction potential of a region due to to in-situ pore-water pressure responses in aquifers triggering mechanism of liquefaction during earthquakes (1). Liquefaction that affects the human-built environments is mostly limited to the upper 15 m of soil.
As a prerequisite for earthquake preparedness a detailed inventory of sites more susceptible to earthquake damage and to earthquake related secondary effects due to local site conditions has to be prepared.
Data and Methods
GIS integrated geodata analysis can be used to visualize factors that are related to the occurrence of higher earthquake shock and / or earthquake induced secondary effects, such as lithology (loose, unconsolidated sedimentary covers), faults, steeper slopes (landslide susceptibility) or higher groundwater tables (Figure 2).
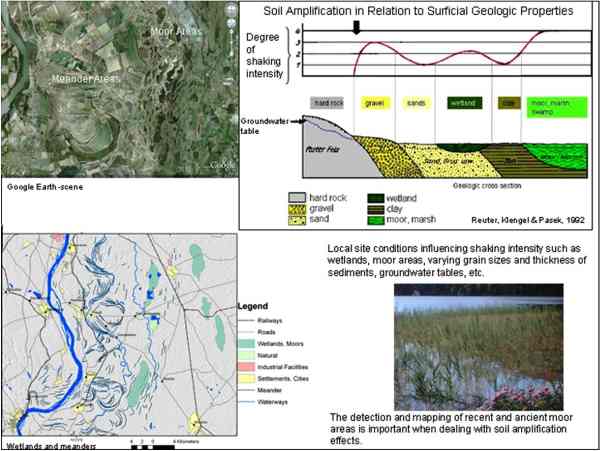
Figure 2: Local site conditions influencing ground motion such as wetlands and unconsolidated, sedimentary covers (Loose soils can amplify and prolong shaking)
Digital Elevation Model Data (DEM)
When searching for areas susceptible to soil amplification, liquefaction or compaction the so called causative or preparatory factors have to be taken into account such as height levels, slope gradients, terrain curvature, lithologic conditions and faults zones (3). Morphometric maps (slope gradient maps, drainage,etc.) derived from SRTM and ASTER DEM data are combined with lithologic and seismotectonic information in a GIS data base. Some of the causal factors can be determined systematically: From slope gradient maps those areas with the steepest slopes are extracted, and from curvature maps the areas with the highest curvature, as these are more susceptible to landslides. Height level maps help to detect topographic depressions covered by more recently formed sediments, which are usually linked with higher groundwater tables. In case of stronger earthquakes those areas often show the highest earthquake damage intensities. From ASTER DEM data the flat areas with no curvatures of the terrain and low to no slope gradients and the lowest areas are extracted (Fig.3).
An important step towards susceptibility mapping is the weighted overlay method in ArcGIS as the influence of the various factors on earthquake ground motion is different (Fig.4). The influence of the causal or preparatory factors can vary for example due to seasonal reasons. E.g., in very hot and dry seasons the risk of liquefaction or landslides is generally lower than in spring times.
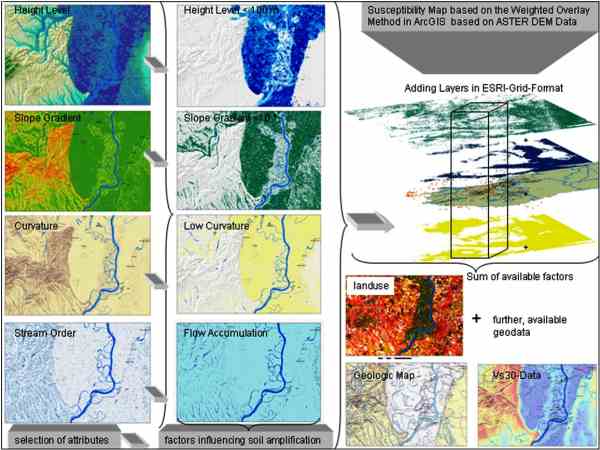
Figure 3: Extraction of causal or preparatory factors influencing earthquake shock
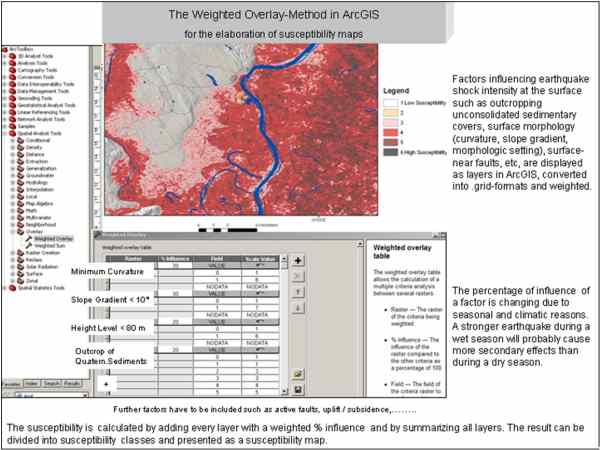
Figure 4: The Weighted Overlay approach in ArcGIS
Satellite Imagery
RapidEye- and LANDSAT-data are used as a further basic layer in the earthquake GIS, e.g. for the elaboration of actual land use maps (Fig.5). Some data layers, such as land use and forests, are dynamic in nature and need to be updated frequently. For disaster preparedness it is necessary to have a detailed and up-to-date documentation of settlements, infrastructure, industrial facilities etc. that might be exposed to earthquake and other hazards, especially with regard to their different exposure to soil amplification, landslides or active tectonic processes. RapidEye images serve as georeferenced data base for the mapping of landslide areas, wetlands and bogs.

Figure 5: Supervised classification of RapidEye data
Environmental changes have also to be considered when dealing with emergency planning. Figure 6 shows LANDSAT scenes from 1987 to 2010 visualizing environmental changes in land use such as growth of settlements and newly built roads, or flooding events due to flash floods after heavy rain falls. Central-Hungary was prone to extended flooding in May 2010. When planning evacuation routes, roads exposed to flooding have to be known and in case of flooding alternative routes have to be arranged. Fig. 7 visualizes the roads situated below 80 m height level that are susceptible to flooding.
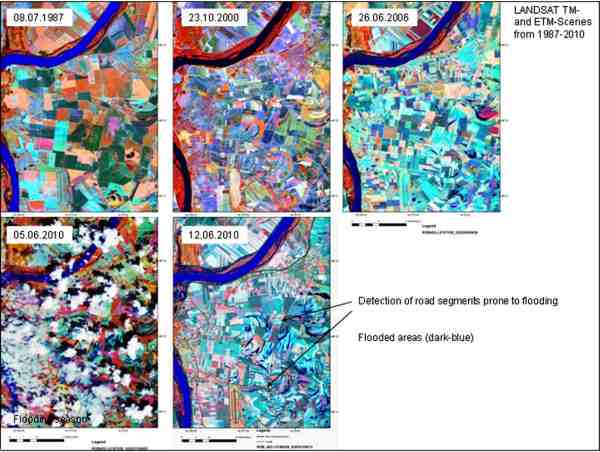
Figure 6: Environmental changes documented by LANDSAT scenes from the area east of Paks
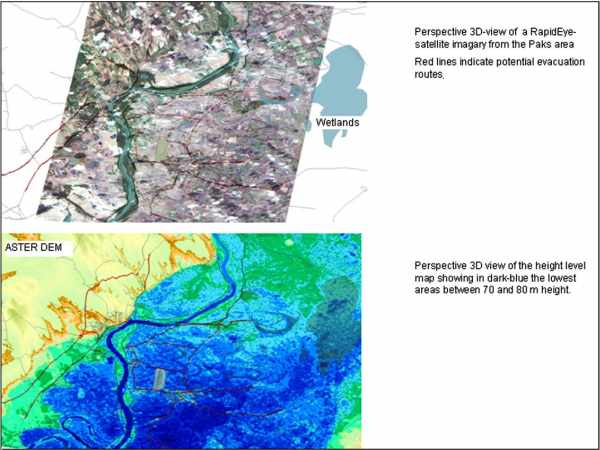
Figure 7: Roads susceptible to flooding
Contribution of Satellite Data to Emergency Preparedness
Analysis of satellite data can contribute to the assessment of potential areas of higher earthquake damage: When combining the results of the weighted overlay-approach (i.e. summarizing the factors with influence on earthquake shock) with high resolution satellite data a better understanding and visualization of differences can be achieved, allowing the identification of “islands” of higher earthquake damage risk (2, Fig.8).
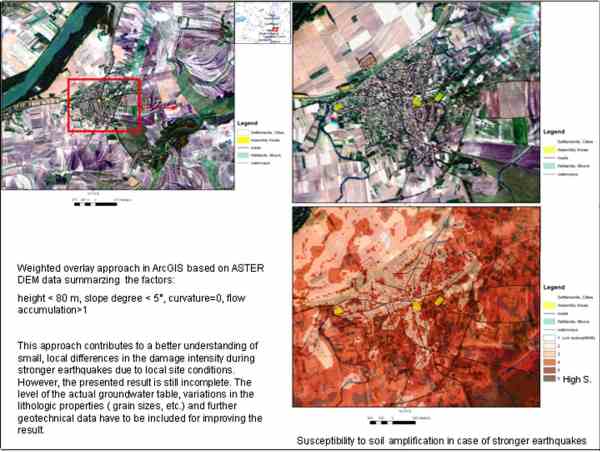
Figure 8: Combining RapidEye satellite imageries with the weighted overlay results
A major emergency preparedness and management demonstration is planned for May 2011 in Hungary, as part of a large collaborative EU-FP7 funded research project (Integrated European Industrial Risk Reduction System, IRIS). The framework for the IRIS demonstration comprises a large civil protection exercise based on innovative information collection and risk assessment. The entire data sets will be managed by a GIS program. A simulation based on the MAEViz software will be performed. It allows setting an earthquake scenario and computing the consequences. The output is a map showing the expected extent of damage to the constructed infrastructure. With this information priorities for the civil protection forces can be set. This information will create an updated emergency plan for the civil protection forces.
The exercise is designed as well to show how satellite images can improve civil protection measures in case of large scale disasters. It is planned to set markers which will subsequently be identified in Rapid Eye images on a daily basis. This will allow creating an up-to-date overview on the dimension of a potential disaster and provide the basis for an updated mitigation plan. It is intended to invite international participants and guests from all over Europe in order to demonstrate the technology and receive feedback on a high level.
A proposal to support the preparation of this demonstration was accepted by the German Aerospace Center (DLR). Within this proposal RapidEye satellite data with a spatial resolution of 5 m are provided, covering Central Hungary along the Danube River from north to south. Strategic databases are created: Data for hospitals and health centers, schools, governmental buildings, police, fire stations, industrial buildings, gas stations and infrastructure data are collected and stored as shapefiles in the GeoInformation System, as well as geological maps, earthquake and seismotectonic data. Fig.9 presents as example a map with a “distance to the next hospital”- calculation.
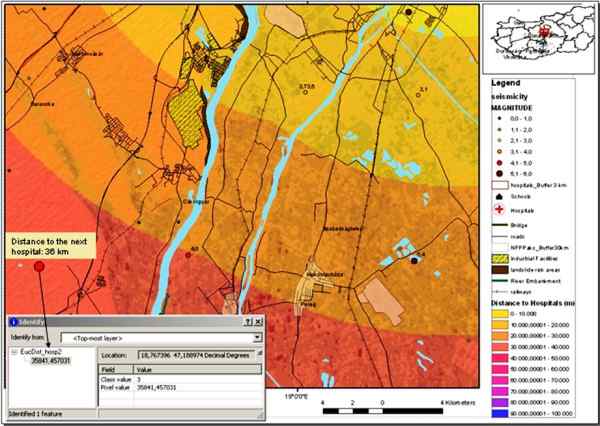
Figure 9: Calculation of the distance to the next hospital
Acknowledgments
The support of EU, FP 7, Large Collaborative Research Project, IRIS – Integrated European Industrial Risk Reduction System, CP-IP 213968-2, is kindly acknowledged.
References
- Hannich,D., Hötzl, H. & Cudmani,R., Einfluss des Grundwassers auf die Schadenswirkung von Erdbeben – ein Überblick. Grundwasser,Vol.11,4, 286-294 (2006).
- Theilen-Willige,B. and Wenzel,H., Local Site Conditions influencing Earthquake Shaking Intensities and Earthquake related Secondary Effects - A Standardized Approach for the Detection of Potentially Affected Areas using Remote Sensing and GIS-Methods. 10. Forum Katastrophenvorsorge, Katastrophen – Datenhintergrund und Informationen UN Campus, Bonn, 23. - 24. November 2009 (2009). http://213.23.39.218/download/forum/10/TheilenWillige_Wenzel_ExtAbst.pdf
- Theilen-Willige,B., Detection of local site conditions influencing earthquake shaking and secondary effects in Southwest-Haiti using remote sensing and GIS-methods, Nat. Hazards Earth Syst. Sci., 10, 1183–1196, 2010, www.nat-hazards-earth-syst-sci.net/10/1183/2010/, doi:10.5194/nhess-10-1183-2010
http://www.nat-hazards-earth-syst-sci.net/10/1183/2010/nhess-10-1183-2010.pdf
Interoperability - A key requirement for emergency and disaster management
Interoperability - A key requirement for emergency and disaster management
Athina Trakas, Director, European Services, Open Geospatial Consortium (OGC)
(Note: Portions of this paper are excerpted from a longer paper by Mark Reichardt, President & CEO, OGC, titled “Open standards-based geoprocessing Web services support the study and management of hazard and risk,” submitted for publication in the Geomatics, Natural Hazards and Risk Journal.)
Introduction
In recent years, providers of geospatial software and online services – GIS, Earth imaging, navigation, location services, map browsers, etc. – have implemented interfaces and encodings based on a robust framework of open geoprocessing and sensor web enablement standards developed by the OGC. The OGC is an open, consensus-based standards development organization. Products and services implementing these standards are coming into wide use in domains such as ocean observation, defense and intelligence, and civil protection, and they are beginning to be used in many other domains, including emergency and disaster management. Some of the OGC members who are involved with emergency and disaster management are working to advance the use of these standards in applications that also involve new computing models like cloud computing.
This article provides information about the relevant standards used in emergency and disaster management, a list of OGC interoperability initiatives to illustrate the value of open standards in studying and managing natural risks and hazards, and a short introduction to the OGC Emergency and Disaster Management Domain Working Group (E&D DWG).
Cooperation between the geospatial community and the science community is particularly important in studying natural hazards and risks, because observations from multiple disciplines and multiple data collection activities need to be considered together. Arguably, all disciplines that produce and use geospatial data have a need for more data sharing and collaboration. Standardization is a key factor for accessibility of data. It is the definition and adoption of common interfaces and encodings that enables interoperability.
OGC Standards
Twenty-eight member-approved OGC standards are currently available. The summary descriptions of some OGC standards below provide the current scope:
- The OGC® Web Map Service Interface Standard (WMS) provides a simple HTTP interface for requesting geo-registered map images from one or more distributed geospatial databases. A WMS request defines the geographic layer(s) and area of interest to be returned as one or more geo-registered simple map images (JPEG, PNG etc.) that can be displayed in a browser application. The interface also supports the ability to specify whether the returned images should be transparent so that layers from multiple servers can be visually overlaid.
- The OGC® Web Feature Service Interface Standard defines the interface to a data access service that enables features from multiple feature collections (as in a vector GIS) to be queried and managed using HTTP. It additionally defines operations that enable clients to discover feature collections available through the service, access features and their attributes, and enable editing, locking and a range of operations against features and attributes.
- The OGC® Web Coverage Service Interface Standard (WCS) defines a standard interface and operations that enables interoperable access to geospatial "coverages". The term "grid coverages" typically refers to content such as satellite images, digital aerial photos, digital elevation data, and other phenomena represented by values at each measurement point.
- The OGC® Geography Markup Language Encoding Standard (GML) defines a data encoding in XML for geographic data and a grammar to express models of such data. Clients and servers with interfaces that implement the OGC WFS standard read and write GML data. GML is also an ISO standard (ISO 19136:2007). Styling and data schema are clearly separated.
- The OGC® Symbology Encoding Standard (SE) defines an XML language for styling information that can be applied to digital geographic feature and coverage data.
- The OGC® KML Interface Standard, brought into the OGC by Google, is a language for geographic visualization, including annotation of maps and images. Geographic visualization includes not only the presentation of graphical data on the globe, but also the control of the user's navigation in the sense of where to go and where to look. KML is complementary to most of the key existing OGC standards including GML, WFS and WMS.
The full set of OGC standards, including Sensor Web Enablement (SWE) standards described below, along with reference models, standards profiles, public engineering reports, best practices documents, discussion papers and white papers are available at http://www.opengeospatial.org/standards.
A Glossary of Terms is available at http://www.opengeospatial.org/ogc/glossary/.
OGC Sensor Web Enablement (SWE) Standards
Most geospatial data is created by means of sensing and measurement devices (gauges, satellite-borne imaging cameras etc). Most sensors have a location that is pertinent to the sensor’s purpose. For these reasons, OGC members have developed a set of “Sensor Web Enablement” (SWE) standards that provide a Web services framework for working with sensors and sensor data. The following descriptions of some of these standards provides a sense of the scope of this set of free and open resources for the emergency and disaster management community:
- The OGC® Sensor Model Language (SensorML) Encoding Standard defines the general models and XML encodings for sensors. SensorML enables:
- Discovery, processes and plug-and-play operation of sensors. SensorML is the means by which sensors and processes make themselves and their capabilities known, describe inputs, outputs and taskable parameters.
- Observation lineage. SensorML provides history of measurement and processing of observations and supports quality knowledge of observations.
- On-demand processing. SensorML supports on-demand derivation of higher-level information (e.g. geolocation or products) without a priori knowledge of the sensor system.
- Intelligent, autonomous sensor network. SensorML enables the development of taskable, adaptable sensor networks, and enables higher-level problem solving anticipated from the Semantic Web.
- The OGC® Observations and Measurements (O&M) Encoding Standard defines the general models and XML encodings for sensor observations and measurements.
- The OGC® Sensor Observation Service (SOS) Interface Standard provides an open application programming interface (API) for managing deployed sensors and retrieving sensor data and specifically “observation” data.
- The OGC® Sensor Planning Service (SPS) Interface Standard provides an open application programming interface (API) for a service by which a client can determine the feasibility of collecting data from one or more mobile sensors/platforms and submit collection requests to these sensors/platforms.
Examples of projects using OGC standards
Taiwan Debris Flow Warning System
A scenario in the 2008/2009 OGC Web Services 6 (OWS-6) Testbed activity involved an actual implementation of SWE standards in Taiwan and chained Web services in a working debris flow monitoring system. In parts of Taiwan - due to the steep terrain, severe weather (frequent typhoons) and geology (unstable soils and frequent earthquakes) - upland river valleys are subject to sudden and dangerous flows of earth and boulders. Therefore it is important to provide alerts and warnings. This scenario involved alerts, notifications, grid processing and real-time event architecture.
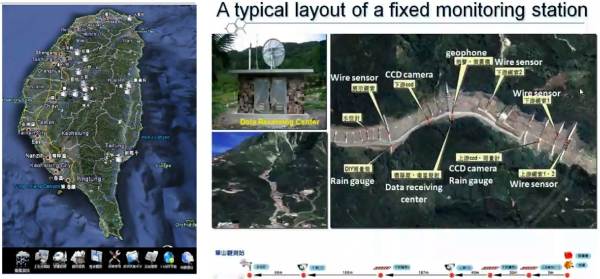
Figure 1. OGC standards have been implemented in a real-time debris flow warning system in Taiwan. (Figure from Geographic Information Systems Research Center at Feng Chia University in Taiwan)
Development and deployment of this system was carried out by researchers and engineers at the GIS Research Center, at Feng Chia University in Taichung, Taiwan and at the Industrial Technology and Research Institute (ITRI). Deployment of an operational Taiwan Debris Flow Monitoring System proceeded throughout 2009, resulting in a working system that supports monitoring of critical conditions. This system provides significantly increased protection for citizens and businesses in thirteen of the river valleys in Taiwan that have the highest potential for debris flows.
At thirteen fixed locations, sensors such as rain gauges, geophones, wire sensors and water level meters provide observation data through ADSL networks or satellite links. Two mobile vehicles equipped with monitoring devices can be dispatched to areas where debris flows are likely.
Web services that implement the OGC Sensor Observation Service (SOS), Sensor Planning Service (SPS) and Sensor Alert Service (SAS) Interface Standards enable communication between the various parts of the system. Components that provide alert notices use the OGC Web Notification Service (WNS). Applications, including one that provides Short Message Service (SMS) alerts, can access stored and real-time data. In some applications, users can click on sensor icons in graphical 3D terrain views to check on the status and outputs of sensors.
The Feng Chia University and ITRI team have provided a comprehensive OGC Best Practices document that serves as a cookbook for implementing SWE, including schemas, examples and working code.
SANY - “Sensors Anywhere”
As a major “Integrated Project” in the Sixth Framework Programme of the European Commission (IST-FP6), SANY extended the interoperability advances of the earlier European project, ORCHESTRA, into the domain of environmental sensor networks and standards-based sensor web enablement to support decision-making.
OGC SWE standards were applied in SANY to three innovative risk management applications involving air pollution, marine risks and geohazards. These efforts yielded valuable reference implementations of sensor web services and geospatial processing Web services for decision support and data fusion.

Figure 2: This book summarizes the approaches and results of the SANY project.
Further information and details on the open architecture for sensor networks is available at http://www.sany-ip.eu/publications/3317.
Sensor Webs: The German tsunami warning system for the Indian Ocean
Open source software that implements SWE standards is being used in a number of real-world systems, including a monitoring and control system for the Wupper River watershed in Germany, an Advanced Fire Information System (AFIS), and a wildfire monitoring system in South Africa. Another is the German Indonesian Tsunami Early Warning System (GITEWS), a 35 million Euros project of the German Aerospace Agency (DLR) and the GeoForschungsZentrum Potsdam (GFZ). GITEWS uses SWE services for sharing tsunami related information among GITEWS software components. Real-time sensors and simulation models provide data for GITEWS.
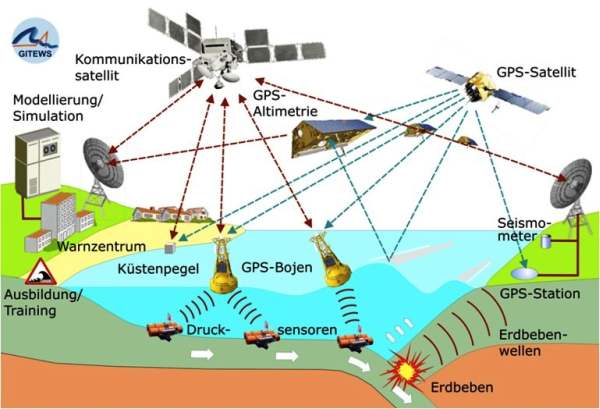
Figure 3: GITEWS provides indicators of a tsunami and its dimensions by the analysis of different measurements at a very early stage.
More detailed information is available at http://www.gitews.org.
The OGC Interoperability Program
http://www.opengeospatial.org/ogc/programs/ip
The OGC, through its Interoperability Program (IP), facilitates testbeds, pilot projects and interoperability experiments in which standards are created and tested. Many of these interoperability initiatives, as shown in the examples below, have had at least a partial focus on hazards and risk, both natural and man-made.
- OWS-6 brought together 10 sponsor organizations and 32 participating organizations to advance standards in five major technology focus areas or “threads”, including: Sensor Web Enablement (SWE), Geo Processing Workflow, Aeronautical Information Management, and Decision Support Services.
- OWS-7 focuses on Sensor Fusion Enablement, Feature and Decision Fusion, and aviation information systems. Fusion is defined as “the act or process of combining two or more pieces of data or information regarding one or more entities to improve the capability for detection, identification or characterization of that entity.” For example, if a power plant has been flooded, advanced fusion capabilities will enable rapid combination of information from many sources for the purposes of assessing the risks inherent in the situation.
- The Geo-interface for Atmosphere, Land, Earth, and Ocean netCDF Interoperability Experiment (GALEON IE) has produced reports that describe how OGC Web services were used in applications that involve netCDF data, a data format used widely in meteorology and climatology. The goal of GALEON IE is to improve interoperability among diverse geospatial information systems used in studying and responding to major storm events, tsunamis and earthquakes.
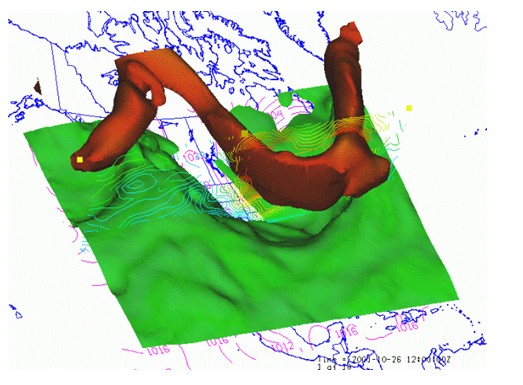
Figure 4: Visualization of Weather Forecast Model Output
- The GEOSS Architecture Implementation Pilot (AIP), a multi-year OGC Interoperability Initiative, brings together technical contributions from over 120 organizations. Their task is to provide the architecture for the Global Earth Observing System of Systems (GEOSS) being developed by the Group on Earth Observations (GEO). The participating governments seek to make a very large collection of geospatial data available on Web servers, including live sensor data and stored geodata of many kinds. The goal is to improve understanding and capacity in dealing with challenges involving disasters, health, energy, climate, water, weather, ecosystems, agriculture and biodiversity.
- OGC is a member of the EO2HEAVEN team that is executing a Collaborative Project of the European Commission Seventh Framework Program (FP7). EO2HEAVEN will contribute to a better understanding of the complex relationships between environmental changes and their impact on human health. The project will monitor changes induced by human activities, with emphasis on atmospheric, river, lake and coastal marine pollution. EO2HEAVEN will specify and implement the Spatial Information Infrastructure (SII) as an open architecture based upon international standards and adaptive geospatial Web services in alignment with the large-scale initiatives INSPIRE (European directive for an Infrastructure for Spatial Information in the European Community) and GMES (the European Earth observation program for Global Monitoring for Environment and Security). The SII will include bridging capabilities at the syntactic and semantic levels to and between environmental and health systems.
Other OGC interoperability initiatives that are directly relevant to emergency and disaster management include: a series of Critical Infrastructure Protection Initiatives, Emergency Mapping Symbology, Fusion Standards Study, Geospatial Fusion Pilot Project, Geospatial Fusion Testbed, Kentucky Watershed Modeling Information Portal, Multihazard Mapping Initiative, Open Location Services Testbed and Sensor Alert Service Interoperability Experiment.
OGC’s Working Groups
The OGC Technical Committee’s 26 domain working groups (DWG) bring together experts from various fields of activity to review and develop standards that meet their domains’ requirements. Domain working groups also sometimes focus on domain-specific data models and schemas that facilitate discovery, access, sharing, analysis, visualization and processing of information among stakeholder organizations. The Technical Committee’s 28 standards working groups (SWG) each have a charter to work on a specific candidate standard prior to approval as an OGC standard or to work on making revisions to an existing OGC standard.
The OGC Emergency and Disaster Management Domain Working Group (EDM DWG) (http://www.opengeospatial.org/projects/groups/edmdwg) provides a forum for uniting communities of users including government agencies, industry, research organizations, Non Governmental Organizations and others whose work involves emergency and disaster management. Like the other Domain Working Groups, the EDM DWG promotes and supports the establishment of requirements, standards and best practices for web service interfaces and encodings.
An example of a standards working group of interest to the EDM community is the Geo Short Messaging Service (GeoSMS) Standard Working Group, which is advancing the OGC Candidate Open GeoSMS Standard as an OGC adopted standard. This candidate standard, currently an OGC Discussion Paper, defines an SMS format to exchange GPS information for different location services devices and applications. The GeoSMS SWG will ensure that the standard is consistent with the OGC baseline, that is, the set of adopted OGC abstract standards, reference models and implementation standards. This is critical, because it will be important in the EDM world for location information from mobile devices and social networking applications to be useable in decision support applications that also involve much more complex types of geospatial data and processing.
The OGC has several committees besides the Technical Committee. A new Business Value Committee has been chartered in the Technical Committee to, as its charter states, “…identify, coordinate and promote the business value of OGC standards and programmes through engaging member senior managers, commercial, sales marketing professionals as well as policy makers and strategic decision makers. The goal is to build a Standard Value Model supported through case studies, reference implementations and business cases for the development and use of geospatial standards in various industry domains and across the community.”
Conclusions
Through open standards – TCP/IP, HTTP, HTML and others – the Internet and the Web connect computers in an extraordinary communications network. The open standards developed by the OGC build on this platform to connect, among other resources, the geospatial software products used in emergency and disaster management. OGC standards have become well established in the marketplace and it is now quite feasible for purchasers of geospatial software to select products whose interfaces and encodings match those of products used by data sharing partners – that is, the products are compliant with the same OGC standards. The standards make it much easier for developers to create interoperable systems, such as sensor webs for early warning, and they make it much easier for decision makers to obtain information from multiple sources at any stage in crisis management. The use of standards considerably reduces investment risks.
Much opportunity remains, however, for information community leaders to contribute requirements into the standards development process and to develop best practices for the communication of geospatial information in their communities. Membership in the OGC helps communities collaborate and exchange knowledge, and it provides opportunities to influence the direction of standards development in important environmental and other arenas.
Monitoring and prediction of natural disasters in Kyrgyzstan
Monitoring and prediction of natural disasters in Kyrgyzstan
Teshebaeva Kanayim and Bolot Moldobekov
Central Asian Institute for Applied Geosciences (CAIAG)
Abstract
The Kyrgyz Republic is a disaster-prone country due to its geographical location in an active seismic zone and its mountainous landscape. Earthquakes, landslides, mudflows, avalanches etc. cause serious damage to both human life and country economy: earthquakes, landslides and floods are of special concern. Kyrgyzstan counts annually some 3,000 tremors and about 10-12 earthquakes, ten to hundreds landslides and around 60 glacier lake outburst. During the last decade space technology played a key role in contributing to the efficient mitigation of disasters. Earth observation satellites provide required geospatial data to support disaster response, monitoring activities and post-disaster damage assessment, and reconstruction, and rehabilitation. This paper describes the role of earth observations satellites on emergency observation, monitoring and assessment of disasters in Kyrgyzstan.
Background
In Central Asia and particularly in Kyrgyzstan as in a mountainous region there have always been specific processes both of natural and anthropogenic origin which bear a threat to human lives and economic losses. Today they have all been well studied enabling us to use effective organizational and engineering solutions for their prevention and reduction of a negative impact.
The most dangerous hazard is an earthquake which causes possible great human life and economic losses. This hazard has a stochastic character both in time and space and can be predicted only with certain probability therefore a permanent readiness to its occurrence is essential. Risk degree is connected directly with the quality and earthquake-proof of living and social and infrastructure constructions. This is the most vulnerable aspect in our region and therefore we need to place high emphasis on it. Today in CAIAG we are working on a program in expanding the automatic seismic stations network and in the near future we will start working on precision of the cities seismic microzoning which can afford to more fairly assess possible damages of different types of constructions in different engineering and geological conditions and to rationally plan preventive risk reducing measures.
Current status and situation
Earth remote sensing methods are very efficient for improving the understanding of the temporal and spatial evolution tendencies of these phenomena and allows, together with ground methods, to more effectively define parameters of the considered processes. This is a key research direction of CAIAG where we use GPS survey, radar and multi-sensor measurements data interpretation to solve tasks of natural objects monitoring and determining their evolution features and the automatic weather stations, hydro and seismic stations which will allow to predict main climatic, hydrologic, glaciological and seismological mechanisms of the region.
Landslides, floods, mud-flows, outburst of glacial lakes, avalanches, ground water flooding, land erosion and salinization are the next by the risk degree considering their spatial expansion. Although these processes have a stochastic character they have exact enough spatial localization that allows us to define areas of possible impact and to undertake preventive measures. The natural hazards distribution map (Fig. 1) gives an overview on natural disasters in Kyrgyzstan. In the first nine months of 2010 there have been 142 floods, 60 landslides, 41 snow avalanches and 13 earthquakes.
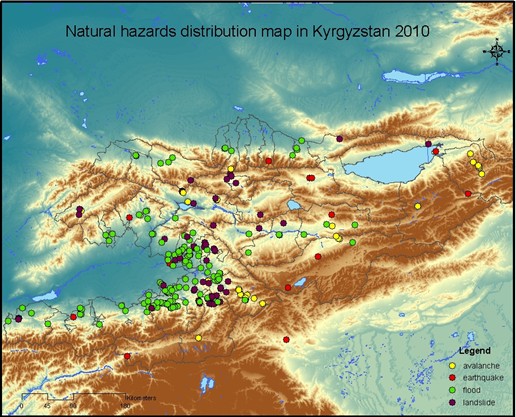
Figure 1: Natural hazards distribution map in Kyrgyzstan 2010.
With the progress in modern technology it has become possible to monitor natural disasters using satellite data. One of the promising initiatives the Sentinel Asia initiative. Sentinel Asia is a voluntary basis initiative led by the APRSAF (Asia-Pacific Regional Space Agency Forum) to support disaster management activity in the Asia-Pacific region by applying the WEB-GIS technology and space based technology, such as earth observation satellites data.
Sentinel Asia provides a great opportunity for developing countries like Kyrgyzstan to monitor natural hazards in the region. CAIAG joined the Sentinel Asia project in 2009 to work in cooperation with Ministry of Emergency Situations (MES). In the frame of the Sentinel Asia project there have been several emergency requests in the Central Asian region.
On March 12, 2010 there was a flood in Kazakhstan due to break of the dam at Kyzyl-Agash village. The death toll from the flood was 34 and thousands were evacuated as informed by the Ministry of Emergencies. Spring flooding is frequently occurs in Central Asia but a sudden rise in temperatures following weeks of heavy snow storms has exacerbated the problem this year (Fig.2).
Disaster area maps were created by visual interpretation from ALOS data together with topographic maps (scale 1:100 000) and information from Ministry of Emergency Situations. The flooding zone of the Balhash sea area is 2 604 square kilometres and Kyzyl Agash flood area is 1 128 square kilometres.
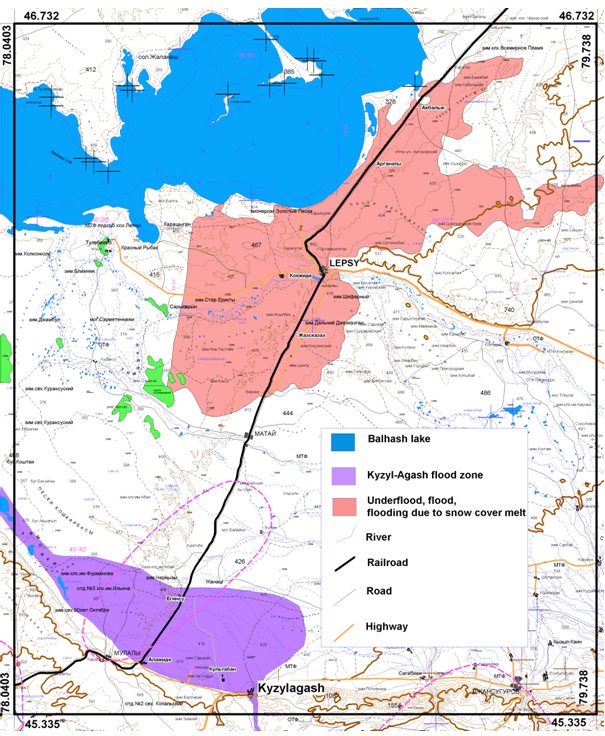
Figure 2: Flood map, Kazakhstan 2010.
ALOS data were used in a project during 2009-2010 supported by Japan Aerospace Exploration Agency (JAXA). The study was on deformation in the Pamir-Alai area for Nura 2008 earthquake with potential use of ALOS satellite data (Fig.3 and Fig.4). Figure 4 shows first preliminary results on using Radar Interferometry techniques in order to define surface deformations for Nura and Kochkor earthquakes.
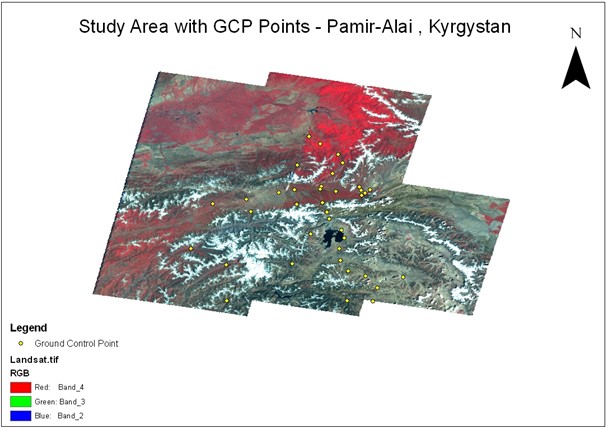
Figure 3: ALOS AVNIR data with resolution of 10 meters Pamir-Alai, Kyrgyzstan.
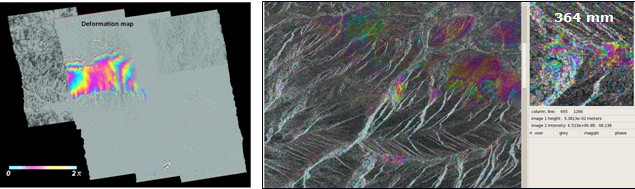
Figure 4: Preliminary results from ALOS PALSAR data on Nura 2008 and ENVISAT data for Kochkor 2006 earthquakes in Kyrgyzstan.
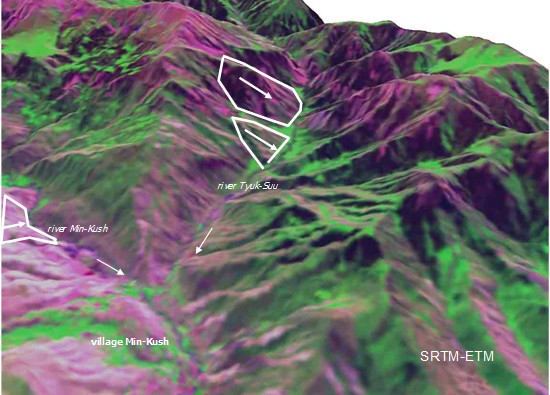
Figure 5: SRTM-ETM data with landslides bodies the arrows shows falling slope.
Active landslides are a special concern which CAIAG monitors in cooperation with the MES. One the active landslide is the Min-Kush which is located next to radioactive tailing. In 2004 deep cracks were formed with the land subsidence in underlying gully and later that year the amplitude of vertical removal along cracks up to 1 m on the upper platform and up to up to 0,3 m along northern border, with extension not less than 200 m sub-parallel to general falling of slope were observed (Fig.5). In 2007 new cracks were formed. GPS monitoring has proven to be efficient to monitor the landslide area.
Discussions and conclusion
The main peculiarity of all the processes considered above is their stochastic character caused by the specificity of the objects–factors interaction in the geospheres conditions. A practical possibility of the precise forecast is impossible due to the stochastic character of the negative processes evolution and the probabilistic assessment allows only defining of risk degree and problematic when it concerns human lives. There is no ample risk reduction strategy choice in this situation. One of the evident strategies is a strategy of adaptation when we use data of the negative processes impact area and avoid it or minimize our activities in its bounds. And the second is the strategy of the engineering protection. All the other strategies like, for example, creation of early warning system for increase of population awareness of dangerous processes reduce risks to a slight degree.
The main obstacle in Central Asia for the efficient realization of minor strategies listed above is the lack of financial resources.
Although there is no opportunity to quickly and fully accomplish these strategies we at least need to constantly understand their importance in the current economic activity. And a strong government control is necessary over the implementation of these measures as only the government makes resources available for it and in case of the strategy non-observance and disaster occurrence the main expenses burden is incumbent on it.
This paper undoubtedly refers to the anthropogenic risk component as there is an opportunity of monitoring and creation of risk control here. The practice shows that preventive actions in the anthropogenic component field reduce risks much and cost much cheaper than clean-up operations of short-sighted and ignorant economic activity. The notorious examples of ecological disasters mainly connected with human activity are the dehydration of Aral Sea basin, uranium and rare-earth production dump-tail problem and soil degradation and desertification.
Regarding changes due to climate change it can be said undoubtedly that it is occurring presently and will occur in the future. These changes are different and will always have both positive and negative components. Today we are a witness of global warming with all its accompanying negative consequences but being aware of secular cyclic recurrence of the temperature motion and disposing data of paleoclimate reconstruction we can imagibe a global chill. Periods of these changes as well as amplitudes of climate parameters irregular due to the mentioned above stochastic nature of all the planetary processes and the precise forecast here is unachievable in principle. Therefore we must be ready to resist, regardless of climate tendencies direction and its rate, building our technological and energy capacity – there is no other way. And obviously our progress will be more impressive if we join efforts and resources.
References
- Usupaev Sh.E., Moldobekov B.D., Aitaliev A.M., Meleshko A.V., Erohin C.A., Ibatulin H.V. Basics of engineering geonomy and natural hazards. (Ministry of education and science of Kyrgyzstan study materials. Bishkek, 662 (2006).
- Havenith H.B., Torgoev I.A., Meleshko A. et al. Landslides in the Mailuu-Suu valley, Kyrgyztsan. Hazard and impacts, Landslides, vol.3, no.2 (2006).
- Rossener S., Wetzel H.U., Xia Y., Meleshko A.V., Sarnogoev A. Investigation of landslide processes in Southern Kyrgyzstan using optical and radar remote sensing in a GIS environment. EGS 24th General Assembly the Hague, Geophysical Research Abstract, vol. 1, no.2 (1999).
Support of remote sensing for natural disaster risk maps in Leyte, Philippines
Support of remote sensing for natural disaster risk maps in Leyte, Philippines
Olaf Neussner, Chief Advisor for Disaster Risk Management, German Technical Cooperation (GTZ), Philippines
Katharina Wilkin, cand. Dipl. Ing., Technical University Dortmund, Faculty of Spatial Planning
Introduction and background
Due to its geographic location the Philippines is highly prone to the occurrence of natural hazard events, such as earthquakes, volcanic eruptions, tropical cyclones and floods, making it one of the most disaster prone countries in the world. 2009 demonstrated this again with consecutive tropical cyclones hitting the country and causing almost a thousand casualties as well as economic damage estimated to about 2.7 percent of the GDP (1).
An average of one person in 100,000 inhabitants dies from natural disaster per year (2). Next to the loss of human life, the frequently occurring damages are an enormous burden to the country’s economy. On average, the costs of disasters are annually as much as approximately 0.5% of the GDP (3). Disasters do not only obstruct development efforts and industrial growth but have severe effects especially on the livelihood of vulnerable rural communities that have to face these hazards on a regular basis.
Global warming and the resulting climate change will particularly affect the Philippines, especially with regard to weather induced disasters. There are indications that rain patterns are changing and are becoming more irregular. This would increase the occurrence of droughts and floods. In addition, the predicted rise of sea level will increase wave action induced erosion and damages to coastal habitats and settlements.
The exposure to hazards alone does not necessarily result in severe disasters. It depends on the vulnerability of communities and assets. The vulnerability is to a large extent determined by the stage of development of a society. For example, a typhoon of the same strength would have a 17 times stronger impact on the Philippines than on Japan (2). The combination of an insufficient prepared country and high exposure results in disasters with an avoidable high death toll and significant losses of assets affecting the development of the country.
Vulnerabilities are specific to hazards. A rice field may be very vulnerable to floods but not to an earthquake while a building can collapse under the forces of an earthquake ground shaking but withstand a flood with only very minor damages. Therefore, typical assets or land uses have to be assessed locally and their vulnerability to likely hazards determined in order to adapt the land uses to the existing hazards.
Most important for such assessments is the knowledge of regional/local disaster risks, in particular the exposure to hazards and the conditions of vulnerability. Both need to be examined to arrive at reliable information suitable for decision making. Resources for such assessments, particularly for ground surveys in remote areas, are limited. Hence, space-based technologies are gaining ground to close these information gaps.
Given the above mentioned needs and available technological means, German Technical Cooperation (GTZ) used satellite-based land use maps to produce natural disaster risk maps in Leyte Island, Philippines. In the following, the different steps in developing these maps are explained in more detail.
Vulnerability assessment
Land use map as basis for the assessment
The determination of vulnerabilities requires detailed knowledge of land use. Therefore a land use map had to be produced (Fig. 1). GTZ acquired satellite images with high resolution. Since one part of Leyte Island could not be covered a lower resolution image had to be utilized.
Preprocessing involved georeferencing to correct the spatial reference of the satellite images (SPOT 5 Level 2A, ASTER Level 1B, and LANDSAT ETM+). The process involved a one-by-one registration with the acquired satellite images. The registration was done in ENVI 4.2 with the 2nd degree polynomial nearest neighbor method.
As a next step, the raw data format was loaded (for SPOT the DIMAP, for ASTER the HDF, and for LANDSAT the GeoTiff). ASTER Images were first oriented to the North before the image-to-image registration could take place. Bands number 1, 2, and 3N were used as these bands comprise the Visible and Near Infrared (VNIR) bands and are also equivalent to the SPOT bands.
LANDSAT Images were first loaded as different bands and were later stacked. Bands 1 to 5 were used since these have the same spatial resolution (30 meters). Then an image-to-image registration was done.
Clearly visible Ground Control Points (GCP) were employed during the registration. With image-to-image registration, visible structures on both of the images were examined and were used as GCPs. The Root Mean Square (RMS) error was kept to 0.8 for all images. All satellite images were saved to an ENVI native file and also as a GeoTiff file.
Before the actual classification, the sea, settlement areas, fishponds, roads, clouds and shadows, and rivers were manually masked as these are easily distinguishable on the images. A mask was created specifically for each image. The mask was saved in ENVI native file format to be used later in the classification.
Images were loaded to ENVI and training areas were identified using the ROI (Regions of Interest) tool. At least 20 polygons of training and test areas were selected per class per image to obtain a result in an acceptable error frame.
GPS ground truthing data were also loaded as vector files to facilitate recognition of land cover in a certain area. Two sets of ROIs were prepared: one for the training set and one for the test set for the later classification accuracy testing. Statistics were calculated in the process of choosing ROIs in order to note the number of pixels per class over the different image bands. A minimum of 20 polygons per class was made for each training and test ROIs. ROI separability was also made to assess the separability of each class; a value of 1.8 to 2.0 per class denoted that each class is properly separated (with minor exceptions) from each other.
A supervised classification with the maximum likelihood method was used, and the pre-processed mask per image was applied as a mask band in the classification process. The Land cover classification and definitions used were derived from the Philippines National Forest Inventory Manual (4).
The classes were converted to vector files and further processed with ArcGIS and Manifold 8.0.
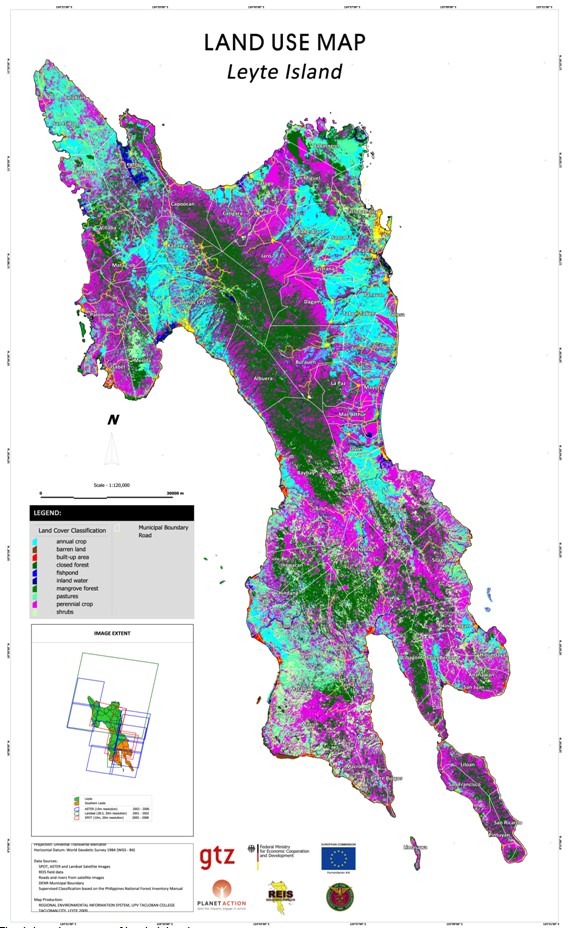
Fig. 1: Land use map of Leyte Island
In order to demonstrate further steps a small area in Leyte Island was selected. It covers part of the city of Tacloban and the municipality of Palo. For better orientation roads and rivers are included.
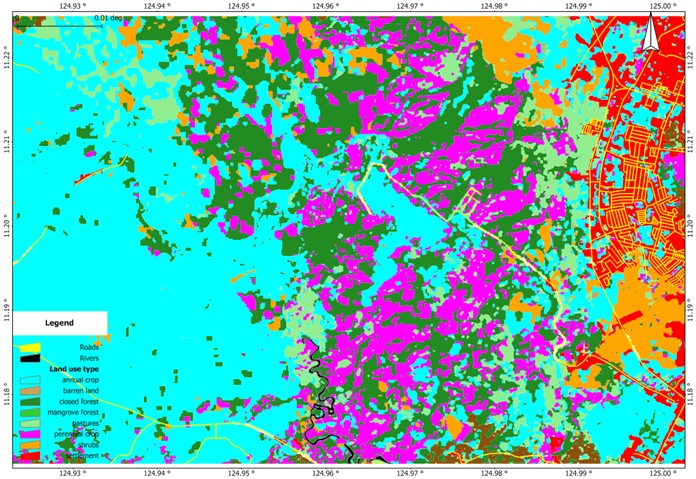
Fig. 2: Land use map of Tacloban City and the municipality of Palo, Leyte Island
Vulnerabilities
According to ISDR, vulnerability is defined as “the characteristics and circumstances of a community, system or asset that make it susceptible to the damaging effects of a hazard” (5). Usually the direct physical susceptibility to the impact of a hazard event is distinguished from secondary effects, which might be social, economic or environmental factors. In this paper only the direct physical vulnerability is addressed.
Vulnerabilities are specific to type and strength of hazards and the characteristics of the exposed assets. This is described in vulnerability curves displaying a function of damage and increasing strength of the hazard. With a few exceptions no vulnerability curves exist on a local level in the Philippines. The authors relied on interviews with local experts, mostly from government institutions in Leyte Island, to collect data on vulnerabilities. Table 1 shows an example of the impact of typical local floods on wooden buildings in Leyte.
| Flood Damage in % | Flood characteristics | Impact inside buildings | Impact on buildings |
|---|---|---|---|
| 5 (very low) | 0.3m, 4hours, very little current | People had to move objects to higher elevation, mop and clean. | No damage, wall paint deteriorated. |
| 5-10 (low) | 1m, 2-4days, slow current | Minor losses, particularly kitchen cupboards, clothes, shoes and mattresses. Mop and clean. | No structural damage, wall plaster may need repair and painting. Wooden frames need to be treated. |
| 10-50 (moderate) | 2m, 5days, medium current | Almost total loss of the furnishings, esp. furniture equipment, kitchen cupboard, etc. People had to remove dirt and mud from inside. | Considerable structural damage to wooden doors and frames, plaster and painted walls. |
| 50-80 (high) | 3m, 7 days, strong current | Total loss of furnishings. | Partial destruction of foundation, wall and doors. |
| 80-100 (very high) | not experienced | Total loss of furnishings. | Total destruction of the dwelling. |
Table 1: Vulnerability of Wooden Buildings to Floods
The same type of data were collected for major land use forms, but some were regarded to be almost not susceptible to natural hazards (pastures, barren land and to a lesser degree bushes). Vulnerability includes both factors, the replacement costs as well as the susceptibility of the particular land use form.
In a second step the economic value of different forms of land use was gathered from local experts. The current replacement costs (Table 2) are taken as a basis for further calculations. They are expressed in Philippine Pesos (1 US$ approximately 43 Philippine Pesos).
| Land use | Replacement cost per hectare in Philippine Pesos |
|---|---|
| Annual crops | |
| Rice | 30,000-40,000 |
| Corn | 18,000-24,000 |
| Perennial crops | |
| Coconut | 27,000 |
| Banana | 36,300 |
| Natural sites | |
| Mangroves | 15,700 |
| Closed forest | 51,200 |
| Settlements | |
| High quality houses | 9,900,000 |
| Low quality houses | 3,850,000 |
Table 2: Replacement costs
Different crops within a land use class were weighed according to their percentage in agricultural areas (data from the Department of Agriculture). Different housing quality was weighed according to municipal statistics of the distribution of houses. The basis for the value of houses was floor area. As only 11% of settlements are actually buildings in Leyte (based on a sample from Palo, Leyte) the replacement costs per hectare were adjusted accordingly. Figure 3 shows an example of a small area of Leyte.
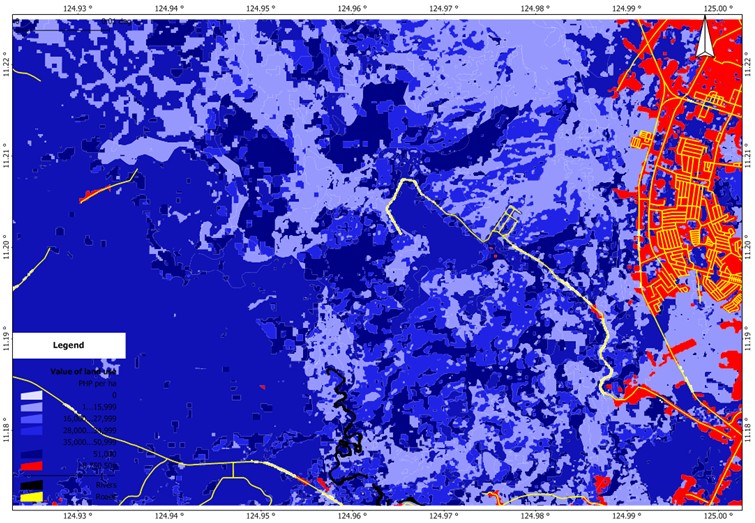
Fig. 3: Map of land value (replacement cost of land use)
The physical vulnerability of different forms of land use to a hazard (here floods) are displayed in Fig 4. Rice paddies are the most vulnerable form of land use because a whole harvest may be lost due to the flood. It may be noteworthy that the map illustrates that vulnerabilities are not limited to hazard-prone areas.
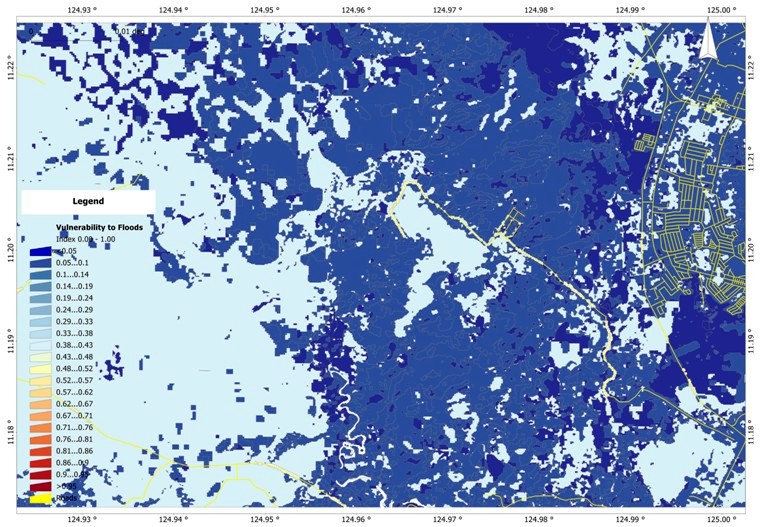
Fig. 4: Map of vulnerability to landslide
Hazard assessment
Determining vulnerabilities alone is of little value without considering the hazards threatening an area. ISDR defines a hazard as “a dangerous phenomenon, substance, human activity or condition that may cause loss of life, injury or other health impacts, property damage, loss of livelihoods and services, social and economic disruption, or environmental damage” (5). Natural hazards are characterized by three features: spatial distribution, strength or magnitude, and probability of occurrence.
For Leyte Island different sources and qualities of information are available for the different hazards. Typhoon hazards are described in terms of affected area, severity and probability by the reinsurance company Munich Re (6). Floods, liquefaction from earthquakes, and storm surges are described only regarding their spatial distribution (susceptibility) by the Mines and Geoscience Bureau (MGB) and the Philippine Institute of Volcanology and Seismology (PHIVOLCS) of the Philippine Government. MGB and PHIVOLCS describe other hazards (rain-induced and earthquake-induced landslides, ground shaking from earthquakes) with three different classes of susceptibility (high, medium, low) apart from the potentially affected area and in the tsunami hazard map some maximum wave heights are indicated.
The available data rarely cover strength and probability. Therefore local investigations had to be conducted. It appeared to be difficult and cumbersome to gather reliable data on strength and probability. Further research will refine initial findings.
For the Tacloban/Palo area in Leyte a return period of 1.2 per year was derived from interviews with a maximum height of 1m and a duration of 2-4 days (Figure 5).
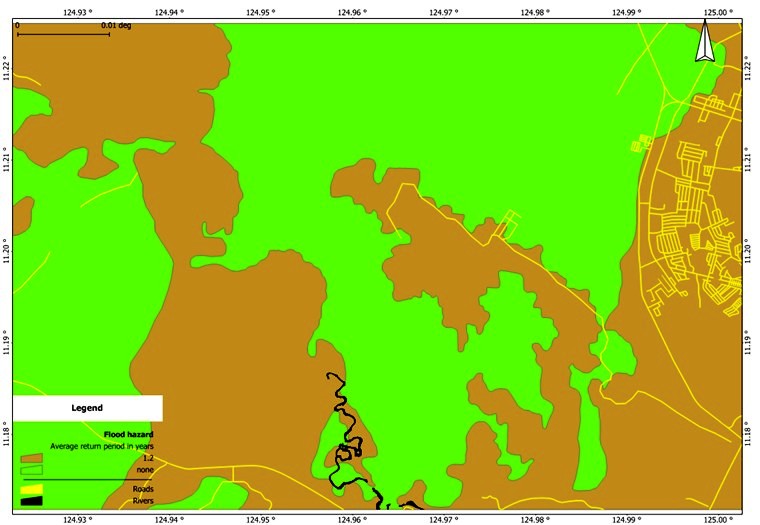
Fig. 5: Map of flood hazard for a flood with a maximum height of 1m and duration of 2-4 days
Landslides proofed to be more difficult to quantify in terms of probability. MGB estimates approximately 30% of Leyte Island as highly susceptible to rain-induced landslides (RIL), while approximately 20% are categorized as moderate and low susceptible respectively. This equals 2,200km2 for high, 1,400km2 for moderate and 1,400km2 for low susceptible areas. Landslides are not recorded systematically on the Island. A derivation from known landslides suggests that 0.8km2 of highly susceptible area are moving as landslides every year. This means a return period of 2.25 years.
The National Economic Development Authority (NEDA) describes the probability of the moderate RIL susceptible area as one fifth of the highly susceptible area and the low susceptible area as one quarter of the moderate area (3). This results in 11.25 and 45 years, respectively, as a return period for RIL in moderate and low susceptible areas (Figure 6).
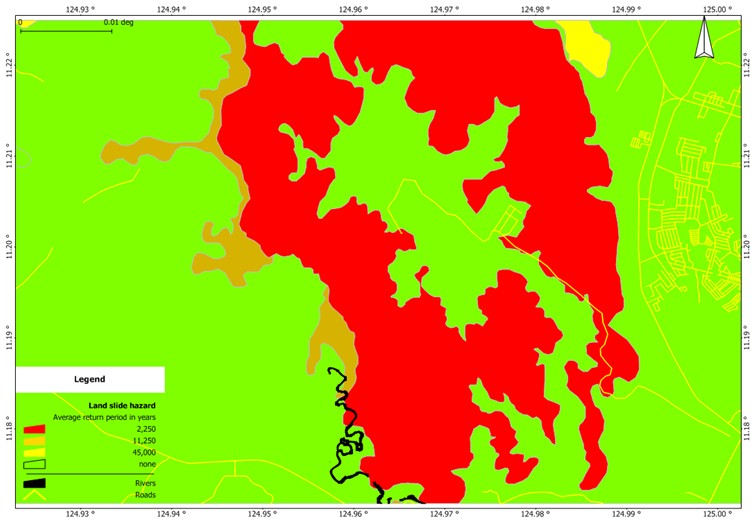
Fig. 6: Map of rain-induced landslide hazard
There are relatively small overlaps of the two hazard areas, which is to be expected because landslides happen on steep slopes while floods occur in plains.
Risk assessment
Risk is defined as “the combination of the probability of an event and its negative consequences” (5). It is calculated by multiplying the vulnerability of an exposed element with the probability of a hazard of a certain severity. In order to get an encompassing risk assessment, different categories of a hazard (different severities and responding probabilities) have to be compiled to arrive at the total risk of a particular hazard. Risks of different hazard types have to be calculated one by one and then added to arrive at a total risk estimate of all hazards.
Figure 7 shows the expected average damage per hectare and year caused by rain-induced landslides. As the return period for low susceptible areas is assumed to be 45 years, the resulting cost per year is very low and only significant for settlements because of their high value per hectare.
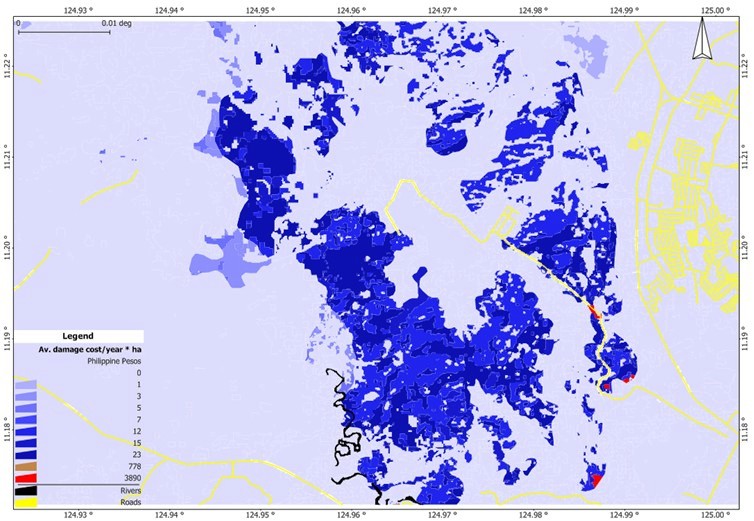
Fig. 7: Map of expected average damage per hectare and year caused by rain-induced landslides
The same kind of calculations was used for other hazards (floods, wind/storm, and earthquake). Adding these four risks (damages in Pesos/year/ha) resulted in a multi-hazard map (Fig. 8). The map shows that a considerable part of the area has no risk of financially significant damages because there is either no hazard or the value of the land use is negligible. The high calculated costs of damage in the flood-prone settlement area do not necessarily mean that this amount of money has to be raised every year. For example, many inhabitants who experience floods do not repaint walls after they were affected by flood waters and damaged furniture might lose value but can still be used.
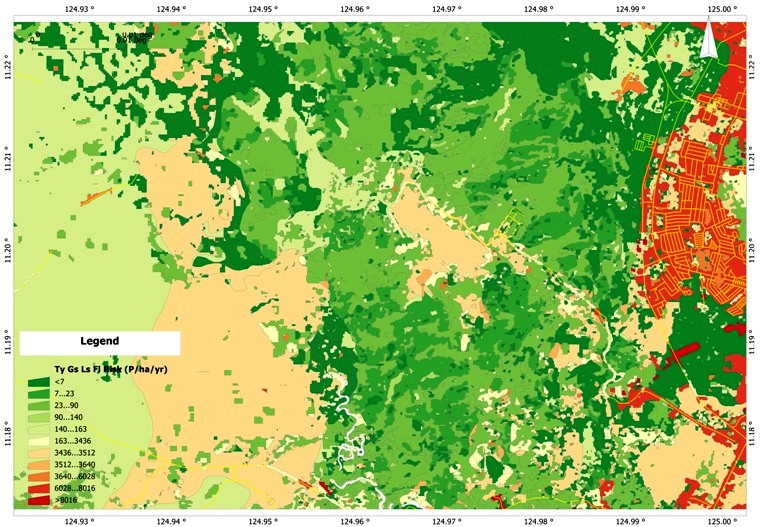
Fig. 8: Map of expected average damage per hectare and year caused by rain-induced landslides, ground shaking, wind/storm and floods
Conclusions
Land use maps with a spatial resolution of 5-15m are sufficient for a province level assessment of natural hazard risks and in the absence of good alternatives they also provide valuable information on municipal level, although not sufficient for planning as 1:10,000 is the desired scale.
Using medium resolution satellite imagery for the production of land use maps appears to be the most efficient way of solving this task. Aerial photography and ground surveys are too expensive and/or labor intensive for large rural areas. Limiting factors in the case of Leyte in the Philippines are the availability of archive images with a low cloud cover and the expertise and time needed to convert images into useful vector information.
Information from different sources on vulnerabilities are still quite incomplete and probably in some cases subjective overestimations of hazard impacts. A more systematic compilation leading towards vulnerability curves for common hazards is needed in order to arrive at more precise vulnerability estimations.
Similarly hazard maps and data on severity and probability appear to need verification.
Although the limitations in hazard and vulnerability assessments are reflected in the risk assessment the risk maps are a significant step forward for local governments in Leyte, because for the first time they are provided with quantitative natural hazard risk maps. These maps serve as a basis for the identification of current high risk areas needing priority interventions like structural protection or adaptation measures. The maps also enable the local governments to estimate the risk in potential development areas in order to avoid dangerous places and promote safer areas.
Acknowledgement
Financial support was granted from the Commission of the European Union under the DIPECHO programme and the German Federal Ministry for Economic Cooperation and Development, and the German Academic Exchange Service (DAAD). Planet Action provided SPOT images.
References
- Republic of the Philippines (RP) & Global Facility for Disaster Reduction and Recovery (GFDRR), (2009), Typhoons Ondoy and Pepeng: Post-Disaster Needs Assessment, Manila, p. 2.
- International Strategy for Disaster Reduction, ISDR, (2009), Global Assessment Report on Disaster Risk Reduction. United Nations, Geneva, Switzerland, pp.7, 50.
- National Economic and Development Authority, NEDA, (2009), Mainstreaming Disaster Risk Reduction in Subnational Development and Land Use/Physical Planning in the Philippines, Manila, pp. 20, 275.
- Branthomme, A.; Saket, M.; Altrell, D.; Vuorinen, A.P., National Forest Inventory, Philippines, Field Manual, (2002), FAO, Forestry Department.
- International Strategy for Disaster Reduction, ISDR, (2009), UNISDR Terminology on Disaster Risk Reduction, Geneva, pp. 7, 11, 12.
- Munich Reinsurance Company, Geo Risks Research Department, Munich Re, (2008), Natural Hazards Assessment Network, http://mrnathan.munichre.com/, accessed 2008.
Use of satellite-based information and Geographic Information System for geo-referencing of thematic maps: Applications for risk-sensitive land use planning and emergency escape route planning in Kathmandu Metropolitan City, Nepal
Use of satellite-based information and Geographic Information System for geo-referencing of thematic maps: Applications for risk-sensitive land use planning and emergency escape route planning in Kathmandu Metropolitan City, Nepal
Tabassam Raza, Associate Dean, Graduate School of Business, Philippine School of Business Administration, Quezon City and Post Graduate Student, School of Urban and Regional Planning, University of the Philippines, Diliman, Quezon City
Leigh G. Lingad, Graduate Student, Department of Geography, University of the Philippines, Diliman, Quezon City
Abstract
This paper provides a step-by-step procedure in identifying and modifying a projection/coordinate system of shapefiles with little or no metadata using satellite information. It also aims to apply a developed procedure to achieve further modification to the system’s parameters for higher projection and coordinate system accuracy using ArcMap’s Affine Transformation tool. To demonstrate the applicability of the proposed procedure, examples on how to integrate satellite and GIS-based information in Risk-Sensitive Land Use (RSLU) planning and Emergency Escape Route (EER) planning, are presented.
Introduction
Background
In developing risk-sensitive land use plans, the locational precision of thematic maps for planning plays a vital role. It is imperative to have accurate information about real conditions on the ground at the time of planning. Lack of such may lead to the development of an inappropriate land use plan – especially when people and property are vulnerable to disasters. It is therefore essential to have accurate geo-referencing of thematic maps and supporting satellite information.
During the development of Kathmandu Metropolitan City’s (KMC) RSLU Planning, shapefiles from various sources such as the Japan International Cooperation Agency (JICA), Kathmandu Valley Town Development Committee (KVTDC) and KMC offices were used. However, the shapefiles were found to be based on an unknown coordinate system. This necessitated adjustment to achieve more suitable coordinate system for the shapefiles.
Previous studies show that the most frequently encountered problems are related to missing information on projection modification and the absence of metadata information. For example, in a study on vehicular carbon-monoxide pollution in Kathmandu Valley, Google Earth was used to transform the shapefiles to a correct projection (1).
Furthermore, earth observation techniques through Remote Sensing (RS) are proven to be more cost-effective than ground-based techniques over a large area. There has been an emergence of high-resolution satellite data in recent years, with greater degree of spatial and temporal variation (2).
The main objective of this study is to come up with a procedure to identify and modify a projection/coordinate system of shapefiles. This study also aims to apply the procedure to check its workability to KMC’s land use and other thematic maps and to provide examples on integrating satellite- and GIS-based in the preparation of RSLU and EER plans.
The developed procedure is considered to be cost-effective because satellite imagery is freely available at Google Earth. One can import GIS data into Google Earth for visualizations. The procedure is thus imperative and can be adapted to similar cases or/and when paper maps need to be digitized, customized and corrected. Extra modification to the system’s parameters can still be made to improve accuracy using additional GIS tools (Spatial Adjustment) and other satellite information.
Conceptual Framework
The Conceptual Framework (Figure1) shows that collected secondary data will go through preliminary GIS analysis and organization, as a prerequisite for the development and application of the methodology. Then, the methodology will be developed and implemented to come up with adjusted thematic maps. With satellite- and GIS-based information, the modified maps will then be used as inputs for the RSLU and EER planning processes.
Methodology
Davis et al. (1991) collated and outlined three benefits from combining GIS and remote sensing in various studies, namely, (a) satellite imagery: improving positional accuracy of thematic maps vis-à-vis satellite imagery; (b) remotely sensed image classification using GIS data; and(c) calibration of remotely sensed data and overlay on thematic maps for spatial process modeling. They summarized the synergistic involvement of cartography, remote sensing, and GIS as follows:
- Remote sensing measures and monitors surface electromagnetic variation.
- GIS organizes and analyses the measurements.
- Cartography improves the modeling of surface processes using spectral data (3).
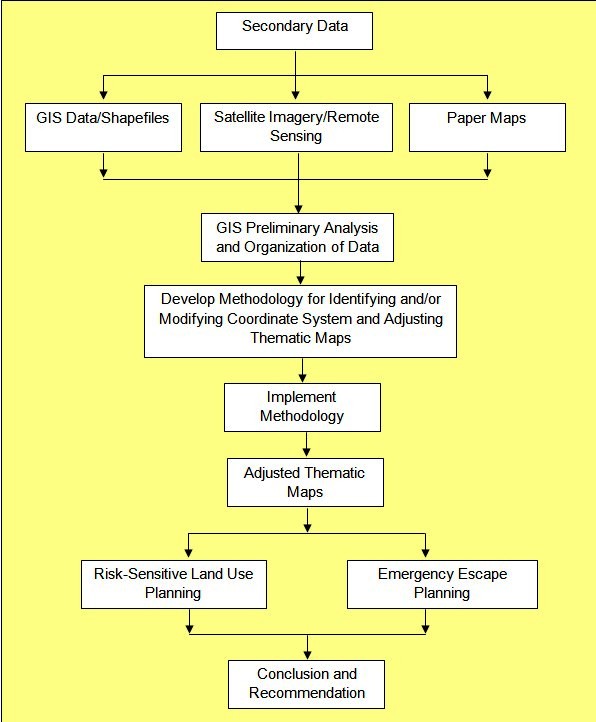
Figure 1: Conceptual framework
The overlaying of thematic maps for spatial modeling is similar to the process involved in delineating suitable areas in land use planning and in formulating emergency escape routes. Recent advances in satellite imagery and Internet (i.e. Google Earth) allow for more than just surface electromagnetic variations such that high-resolution photographic images of the ground are readily available. In addition to abstract modeling of surface processes, these can now be used in risk-sensitive land use planning and emergency escape route planning processes along with the proper use of networking analyses methods and application of land use planning theories.
Identification and modification of a Coordinate System
The following procedure demonstrates how the positional accuracy of thematic maps with incorrect or no metadata can be improved using geo-referenced satellite imagery. Figure2 illustrates the flow of the activities involved in the procedure.
Step 1. Collect secondary data available from various sources.
Step 2. Select a shapefile and check the metadata for the coordinate system information. If the metadata is available proceed to Step 3. If not (Figure3), proceed to Step 5.
Step 3. Validate the information by plotting the selected shapefile on a reference shapefile (Figure4) acquired from credible sources.
Step 4. If the shapefile fits with reference shapefile, it is ready for geodatabase (Figure2); if not, proceed to next step.
Step 5. Identify appropriate coordinate systems from available coordinate system list in ArcGIS (Figure5a) based on the proximity of the area.
Step 6. Select the system that fits closest to the reference shapefile by trial and error method (Figure5b). In this study, the coordinate systems in the Indian subcontinent group were chosen because of their proximity to Nepal.
Step 7. If the selected coordinate system enables the shapefile to fit with the reference shapefile, it is ready for geo-database (Figure2). If not, proceed to next step.
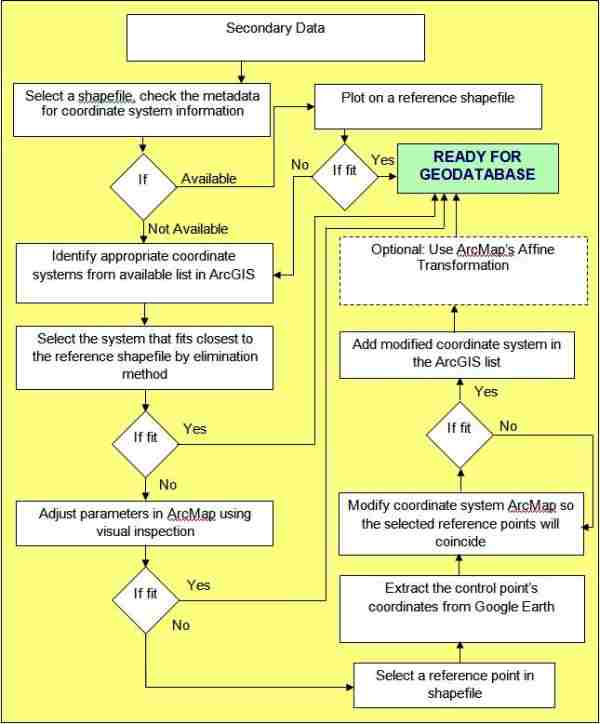
Figure 2: Procedure Activity Flow Paradigm
Figure 3: No metadata in ArcCatalog
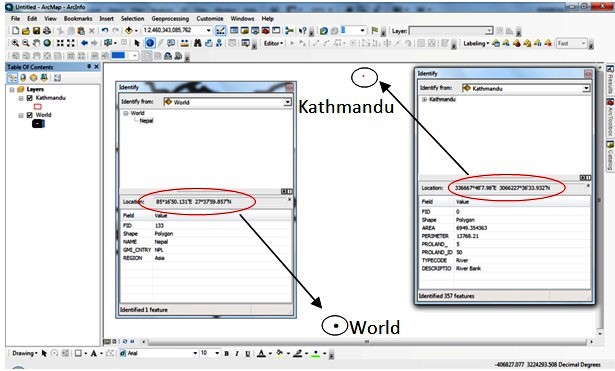
Figure 4: Dislocation of Kathmandu shapefile from reference world shapefile
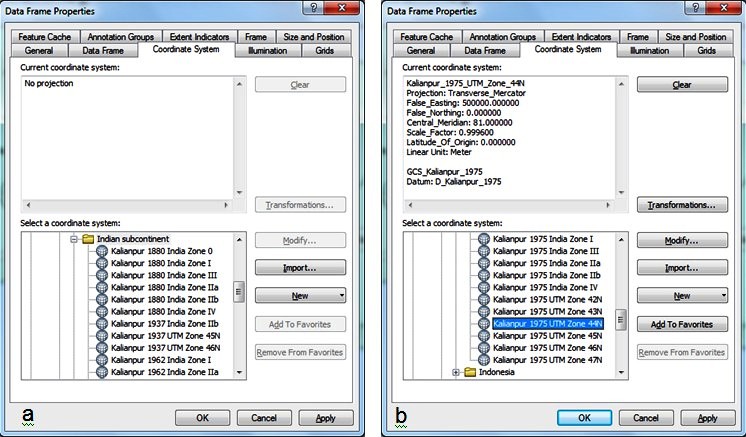
Figure 5: appropriate coordinate systems and selected coordinate system in the data frame properties
Step 8. In the Data Frame Properties, modify the datum parameters of the selected coordinate system so that the shapefile will coincide with the reference shapefile (Figure6). If the selected coordinate system enables the shapefile to fit with the reference shapefile, it is ready for geo-database (Figure2). If not, proceed to next step.
Step 9. Select the reference point in the shapefile, one that is easily discernible, such as road intersections or familiar places.
Step 10. Locate the same point in Google Earth. Extract the coordinates and then plot that point in ArcMap. This becomes the control point. Return to the Modification window and adjust the parameters accordingly so the two reference points will coincide. Once the two points coincide, stop modification.
Step 11. Convert the shapefile into Google Earth format. Check for accuracy by matching the shapefile’s features in the satellite imagery. If the features fit to an acceptable degree based on the purpose the map, save the modification and add to the list (Figure7). If not, proceed to the next step.
Step 12. For higher accuracy, use ArcMap’s Affine Transformation in the Spatial Adjustment tool (Figure8).
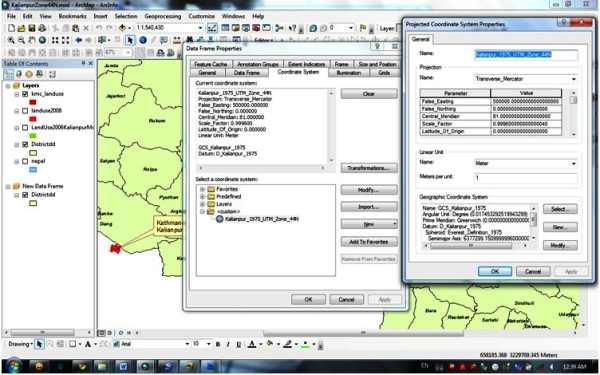
Figure 6: modification of Coordinate systems in Data Frame Properties
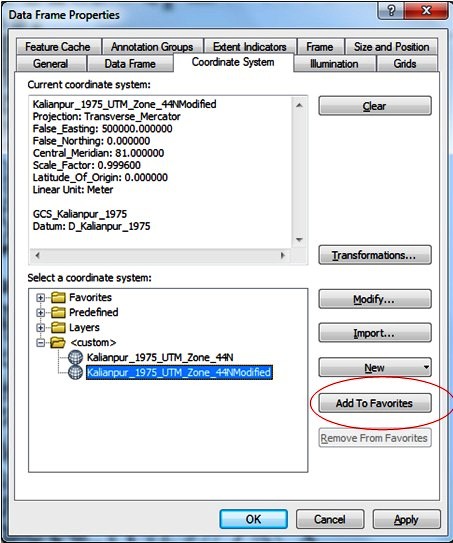
Figure 7: Adding to the list in data frame properties
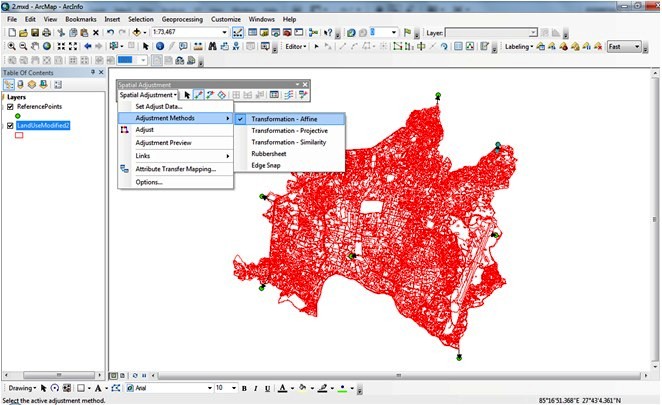
Figure 8: Spatial adjustment method of the shapefile with control points
Integrating Satellite and GIS Data
Once the shapefiles are adjusted, the satellite and GIS can be integrated towards Risk Sensitive Land Use (RSLU) and Emergency Escape Route (EER) planning.
Mechanism Towards RSLU Planning
Step 1. Plot the adjusted proposed development areas shapefile in ArcMap to select the priority area for a particular development e.g., residential.
Step 2. Export the adjusted shapefile to Google Earth to validate if the proposed areas are still suitable for proposed development.
Step 3. Update the shape file based on the new information extracted from the satellite imagery.
Mechanism Towards EER Planning
Step 1. Delineate an area of study.
Step 2. Upload the adjusted shapefile of critical facilities (e.g. hospitals) to Google Earth.
Step 3. Update the road shapefile by digitizing on Google Earth.
Step 4. Identify vacant areas as Emergency Crisis Centers during disasters.
Step 5. Export the roads and Emergency Crisis Centers back to ArcMap for network analysis.
Step 6. Export back to Google Earth for overlay on real-time satellite imagery.
Implementation and application of procedure
Planners need to rely on the mandated guidelines for more realistic plans especially for RSLU and the development of EER plans. A number of important aspects should be taken into consideration to ensure the proper planning and implementation of possible safety measures in the event of disasters.
Therefore, many countries provide a comprehensive, step-by-step process for the preparation of plans at all levels—from municipal to provincial to regional and national. A guideline at city/municipality level, “A Guide to Comprehensive Land Use Plan Preparation” brings to fore the importance of analyzing the current situation of a given planning area. Part of the analysis involves technical and participatory methods (4). For instance, sieve mapping allows for a systematic assessment of the landscape and condition. This is a prerequisite for setting the goals and objectives of the planning area, which directs the identification of development thrust and spatial strategies, and the preparation of corresponding land use plans.
It is therefore prudent to validate the geo-referencing and actual land uses of the planning area. Several techniques may be employed here. The methodology developed in this study emphasizes the use of satellite imagery and GIS technology to derive and analyze land use data. It intends to address incorrect geo-referencing and unidentified projection/coordinate systems, leading to inappropriate decision-making, potentially endangering the environment, infrastructure, and human lives.
Identification and Modification of Coordinate Systems
Following is the output of the procedure described above using the shapefile of proposed land use in 2001from KMC (5).
The Kathmandu City shapefile is selected to identify appropriate coordinate systems from available list in ArcGIS. The selection of the system that best fits the reference shapefile used elimination method. It was found out that the best fit among the known coordinate systems is the Kalianpur 1975 UTM Zone 44N. However, it locates KMC off by about 3° longitude to the west and 10” to the south (Figure9).
The chosen system’s parameters were then modified by visual inspection on reference shapefiles. This changed the false_easting to 210,000 and the latitude_of_origin to 0.2 (Figure10).
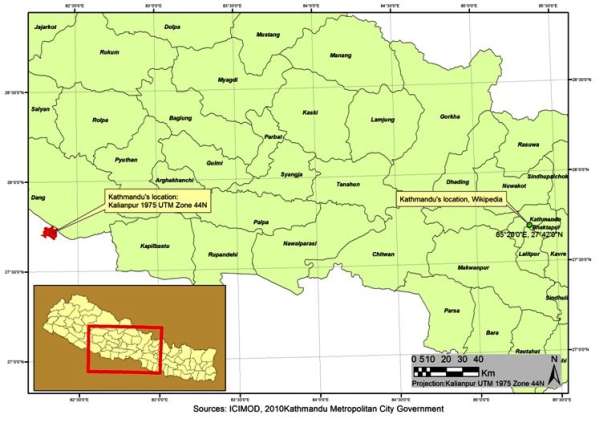
Figure 9: Kalianpur 1975 UTM Zone 44N relative to the reference shapefile
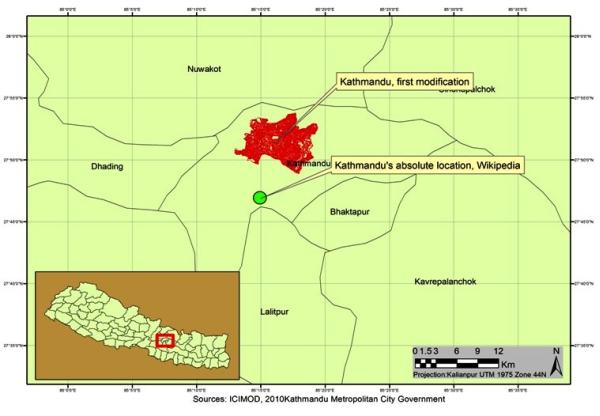
Figure 10: First modification output
Further modification was necessary to improve accuracy vis-à-vis geo-referenced points. One was extracted from Google Earth (Figure11).
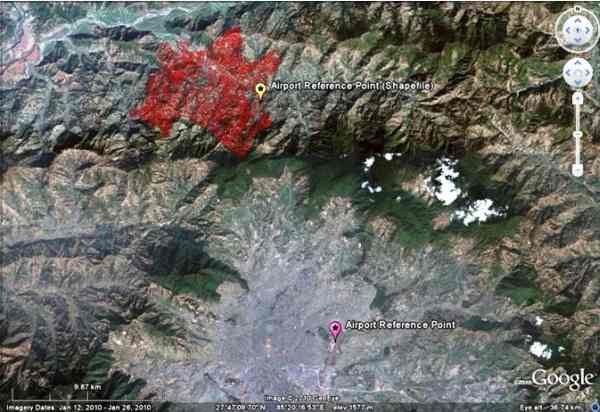
Figure 11: Reference point from Google Earth
Based on the reference point, parameters were adjusted. The false_easting and standard_parallel_1 were modified to -8491750.00 and 16.191700, respectively (Figure12).
This increased the accuracy, but it still has approximately 400m offset at different parts of the area. To achieve even higher accuracy the shapefile was transformed using ArcMap’s Affine Transformation in the Spatial Adjustment tool (Figure13).This further decreased the offset leaving approximately 150 meters discrepancy elsewhere.
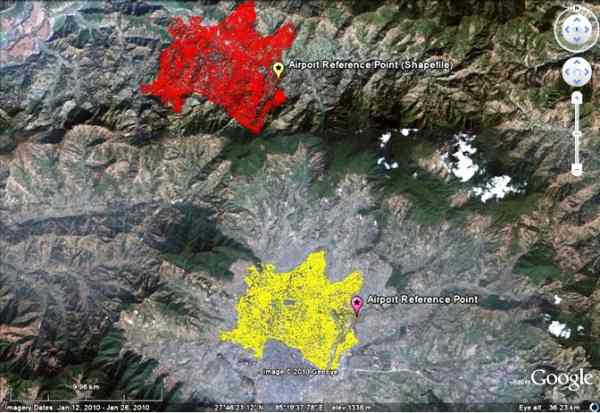
Figure 12: Two modifications of Kalianpur 1975 UTM Zone 44N. Red is the first modification and yellow is the second modification.
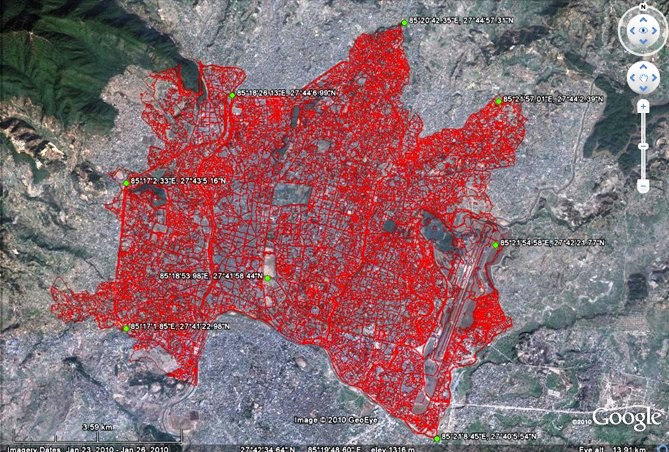
Figure 13: Final transformation using the Affine adjustment.
Application 1: GIS and Satellite Imagery for RSLU Planning
Following is the output of the step-by-step procedure described above, using the adjusted shapefile of proposed development areas by Earthquake Disaster Mitigation in the Kathmandu Valley, 2002 (6) (Figure14).
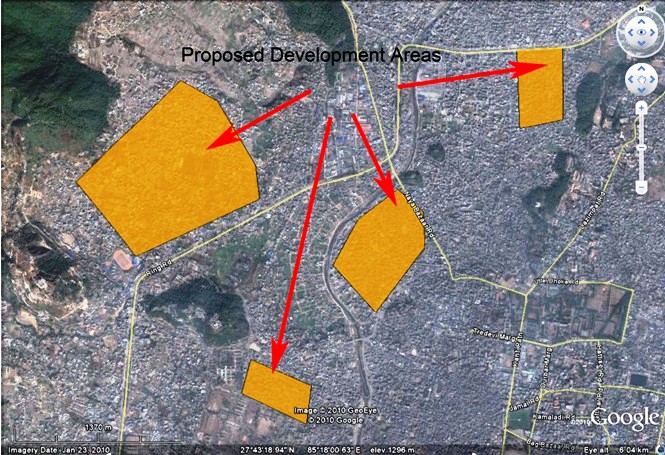
Figure 14: Zoom in of proposed development areas for updates
Application 2: GIS and Satellite Imagery for EER Planning
Following is the output of the procedure described above, using the adjusted shapefile of critical facilities and roads KMC 2002 (7) (Figure15).
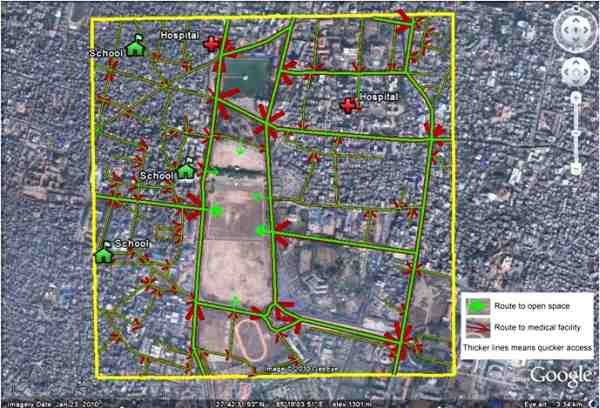
Figure 15: EER example
Conclusion and recommendations
The methods used in adjusting shapefiles are simple enough for those without sufficient training in geodesy but are capable of operating GIS software. This simplicity comes with the trade-off of accuracy. Davis, et. al. (1991) warn of various trade-offs including the imposition of thematic map errors and remote sensing measurements. In this study, the level of precision achieved may be sufficient for planning and analyses at larger levels, such as city/municipality, provincial, regional and national levels. For larger scale implementation, i.e. ward, village, or barangay level programs, projects and activities, there is a need to have detailed groundtruthing for higher levels of accuracy. Furthermore, the methods used are very cost effective, saving logistics expenses for field workers.
Further studies are recommended to gather more empirical data to refine and develop the methods used in this paper.
Acknowledgements
The authors are grateful to Earthquakes and Megacities Initiative, Inc, German Federal Foreign Affairs Office, and the Kathmandu Metropolitan City Office for the development of the Mainstreaming Disaster Risk Reduction in Megacities: A Pilot Application in Metro Manila and Kathmandu: Risk-Sensitive Land Use Plan, Kathmandu Metropolitan City, Nepal. This work gave the authors the opportunity to explore this study.
They are also grateful to the Philippine School of Business Administration for the logistics and resources.
Gratitude is also extended to Harold A.M.P. Lim and other individuals and organizations who contributed in one way or another in the development of this paper.
References
- S.Gurung, Modeling the dispersion of vehicular carbon-monoxide (CO) pollutionin Kathmandu valley, Nepal:A CALINE4 approach combined with GIS Techniques. University of Calgary. (2010).
- K.Poudel. The thread of Space, Time, and Event: An Implication in Media Studies, Bodhi, 3(1), 92-98. Kathmandu University. (2009).
- F.Davis, et.al. Environmental analysis using integrated GIS and remotely sensed data: some research needs and priorities. Photogrammetric engineering and remote sensing. No.6, vol 57.pp 689-697 (1991).
- Housing and Land Use regulatory Board, A Guide to Comprehensive Land Use Plan Preparation, New Edition, Volum I, pp. 38, 200. Philippines. (2006).
- Kathmandu Metropolitan City Office
- Japan International Cooperation Agency and the Ministry of Home Afairs of Nepal. The Study on Earthquake Disaster Mitigation in the Kathmandu Valley, Kingdom of Nepal, Volume III. (2002).
- T. Pradhan. Kathmandu Metropolitan City GIS Office. (2006).
- F.W. Davis et al. Ibid.