The 4C-Challenge: Communication - Coordination - Cooperation - Capacity Development
The 4C-Challenge: Communication - Coordination - Cooperation - Capacity Development
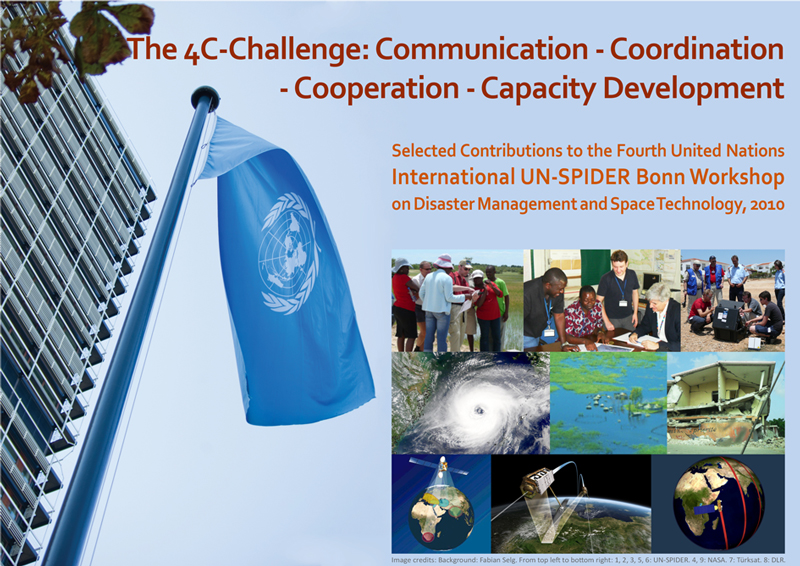
Image credits: Background: Fabian Selg. From top left to bottom right: 1, 2, 3, 5, 6: UN-SPIDER. 4, 9: NASA. 7:Türksat. 8: DLR.
Reference: Robert Backhaus, Lorant Czaran, Natalie Epler, Michael Leitgab, David Stevens, Joerg Szarzynski (Eds.): The 4C-Challenge: Communication - Coordination - Cooperation - Capacity Development. Selected contributions to the Fourth United Nations International UN-SPIDER Bonn Workshop on Disaster Management and Space Technology, 2010, http://www.un-spider.org/4c-challenge-communication-coordination-cooperation-capacity-development (2011).
Introduction by the Board of Editors
Introduction by the Board of Editors
For the first time in the four-year history of the UN-SPIDER programme, we are happy to present a volume of Workshop Proceedings. This online publication contains a number of selected papers which were presented during the sessions of the Fourth United Nations International UN-SPIDER Bonn Workshop, as well as a few additional papers that were submitted by professionals who could unfortunately not attend the event and/or did not have the chance to present their findings to the workshop audience. Nonetheless we found these contributions to be fitting the overall frame of this publication and worth sharing with the interested readership.
The papers are arranged according to the session topics of the workshop, with slight alterations. Accordingly, there are four chapters focusing on International support mechanisms and the SpaceAid Framework, Satellite communication for disaster management, Earth observation and geospatial information in support of risk and disaster management, and the UN-SPIDER Network and its activities.
- International support mechanisms and the SpaceAid Framework: This session aimed at discussing the strengthening of the international coordination with regard to access to existing mechanisms that provide space-based information to support emergency response, such as the International Charter Space and Major Disasters, GMES/SAFER, Sentinel Asia, SERVIR and the UN-SPIDER SpaceAid Framework. Participants were invited to discuss and provide feedback on the utility and timeliness of space-based support for the response and recovery efforts following recent mega-disasters, including direct and fast availability of satellite data and services to the responding organizations, and to provide feedback for improving such support. Key providers and users of space-based data made contributions to this discussion, helping evaluate the present state and making suggestions for better future response efforts. Some of these lines of discussion are reflected in the first chapter of this booklet.
- Satellite communication for disaster management: During this session, presentations and discussions on satellite communications services, namely satellite phones, VSAT's, and BGAN's for emergency telecommunications were held by the service providers and technology developers. This publication includes three examples of applications that were recently developed in this field.
- Earth observation and geospatial information in support of risk and disaster management: The third session saw presentations of relevant space-based solutions for risk and disaster management support and emergency response, including on-going and planned initiatives, case studies and best practices, available geospatial data for disaster studies and capacity building opportunities. The papers in this chapter provide an overview of the topic with a focus on case studies.
- The UN-SPIDER Network and its activities: Session number four included presentations from UN-SPIDER Regional Support Offices and other supporting institutions, demonstrating the dynamically growing international network of the UN-SPIDER programme. The corresponding chapter portrays the work of a selection of UN-SPIDER partners and of the Programme itself.
As a general framework, the workshop contributed to the coordination of the various initiatives that are supporting developing countries to access and use space-based technologies for disaster management and risk reduction, and to explore possibilities of capacity development and institutional strengthening.
Workshop participants and authors
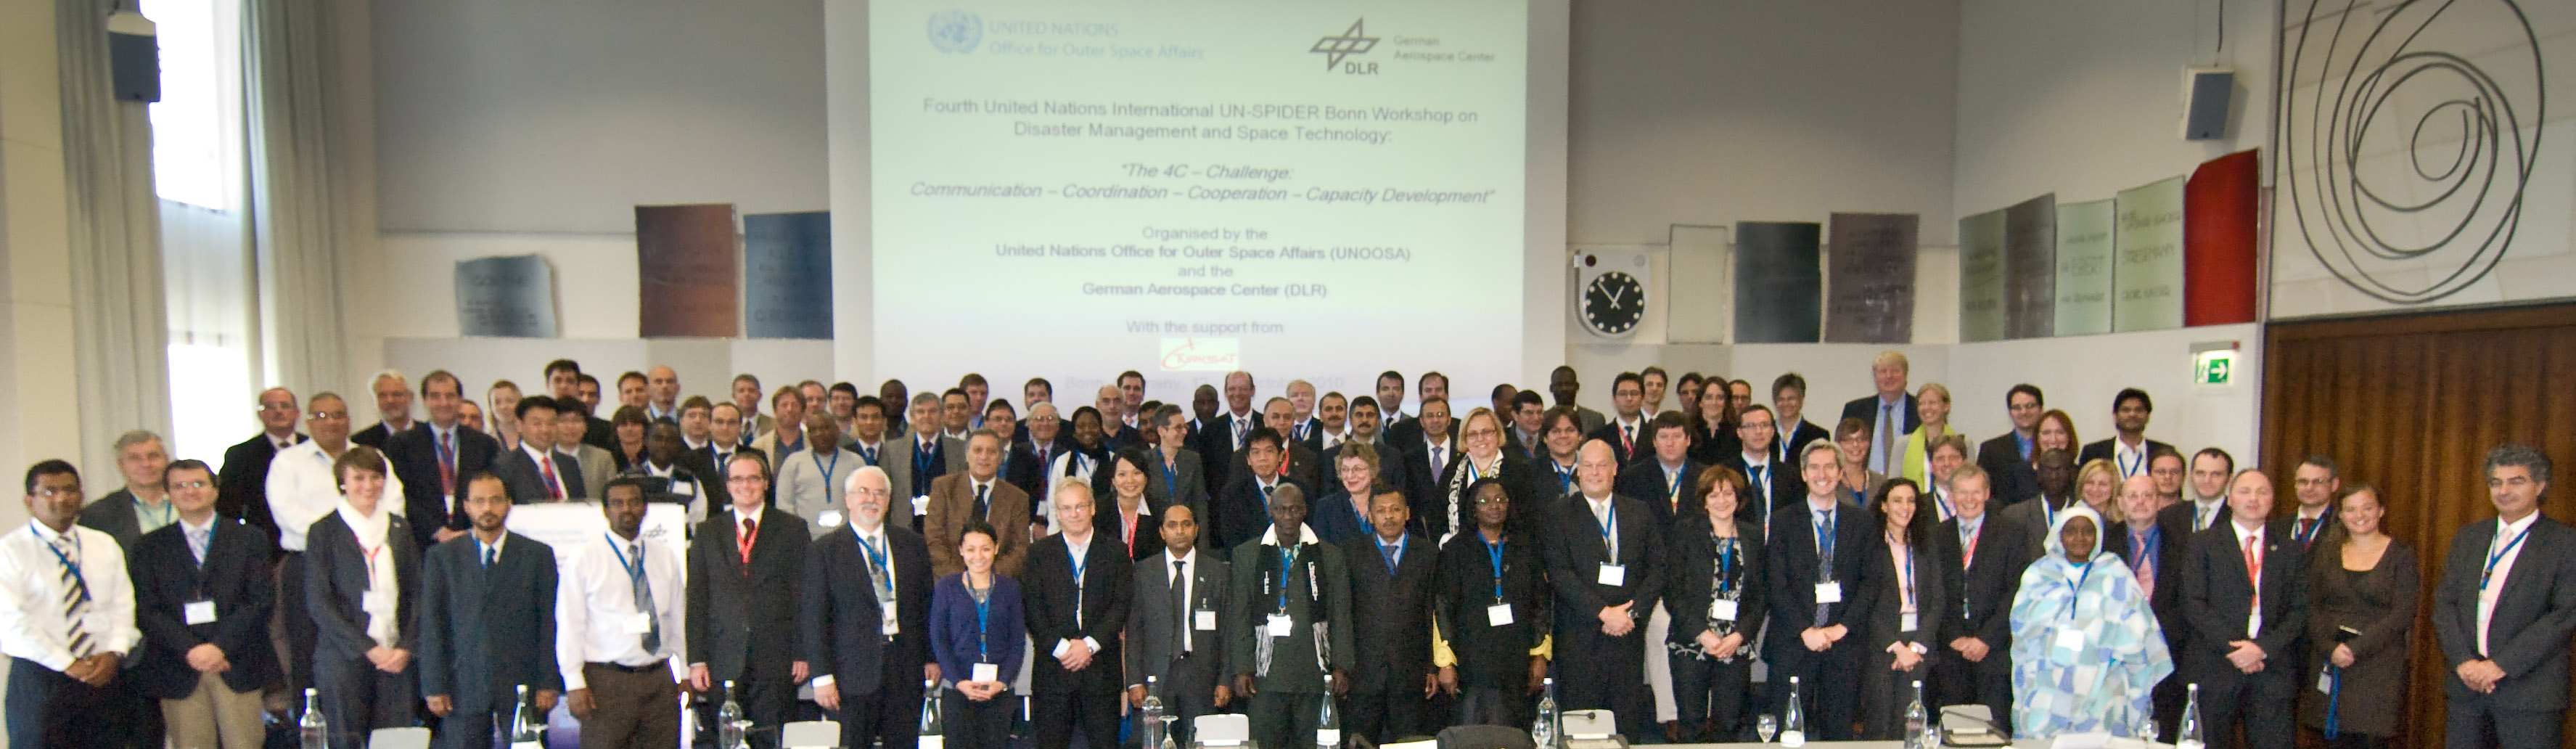
The workshop provided an opportunity for cutting-edge presentations, brainstorming and in-depth discussions. It brought together a total of about 120 decision-makers and senior experts, who hold managerial or professional positions within programmes or activities relating to support of disaster management and emergency response activities, early warning systems, risk and vulnerability assessment, or development of space technology capabilities and/or solutions. Among them were representatives of UN-SPIDER Regional Support Offices and National Focal Points, national and regional institutions responsible for providing risk and disaster management support, for the implementation and maintenance of early warning systems, as well as for risk and vulnerability assessment, and national and regional institutions responsible for capacity-building and promoting the use of space-based technologies. Furthermore, other UN agencies, nongovernmental organizations, space agencies and satellite service providers were present. Last but not least, research institutions as well as the private sector were represented in the audience as well as in the group of presenters.
Just as the workshop participants, the authors of this publication reflect this multitude of stakeholders in the topic of the workshop. The papers reflect the experiences and views of end users, service providers, networkers, and academia. They stem from the private sector as well as public institutions and organizations. They cover topics like information generation and dissemination as well as technical solutions and scientific approaches. The mixture of these different backgrounds provides a valuable overview of the topic of satellite technology for disaster management and gives an insight into the dynamics of the UN-SPIDER workshops that are organized in Bonn, in Vienna, and in other locations worldwide.
The Editorial Board of this booklet hopes, that with the present publication a valid impression of the 2010 Bonn Workshop is provided and that it not only serves as a documentation of a past meeting, but rather as input for future developments. We hope that the products and technologies introduced serve the better information of the end users, and that the reports of experiences and the mentioning of lacks and needs serve as an impulse to the providers.
Background
The United Nations Office for Outer Space Affairs (UNOOSA), through its UN-SPIDER Programme (United Nations Platform for Space-based Information for Disaster Management and Emergency Response) together with the German Aerospace Center (DLR) organized the above mentioned workshop to promote the access and use of space-based technologies and solutions for disaster management and emergency response within relevant communities.
In its resolution 61/110 of 14 December 2006 the United Nations General Assembly agreed to establish the “United Nations Platform for Space-based Information for Disaster Management and Emergency Response – UN-SPIDER”, as a programme of the United Nations Office for Outer Space Affairs, to provide universal access to all countries and all relevant international and regional organizations to all types of space-based information and services relevant to disaster management.
The establishment of the Programme was based on the findings of the Action Team established in the year 2000 by the Committee on Peaceful Used of Outer Space (COPUOS), which identified several gaps and constraints that did not allow disaster-risk management agencies to make efficient and timely use of space-based information, for example:
- Many countries had little or no access to the benefits of space systems.
- There are few national focal points to facilitate access to space-based information and services.
- There is a gap between Disaster-Risk Management agencies and Space Application providers.
- There are difficulties in accessing archived space-based data and information due to a lack of its organization in terms of a database.
In addition, the Action Team concluded that the use of space-based information for such a purpose had only been tackled within the context of pilot efforts in few developing countries. As a consequence other gaps identified by this Team were:
- The lack of efforts to standardize procedures concerning the use of space-based data and information for disaster-risk management.
- The lack of trained staff within disaster management agencies that have the capacity to make use of space-based data and information for risk management, disaster response, and recovery.
As part of the UN-SPIDER outreach activities, workshops are organized to raise awareness within the user community of the benefits of using space-based information and solutions, to assess the users’ needs and to contribute to specific activities of the programme.
Specifically, this Fourth United Nations International UN-SPIDER Workshop in Bonn provided an opportunity to bring together decision-makers and experts from both the space technology and disaster management communities, international scientific organizations, knowledge transfer and educational institutions, as well as internationally active private companies, with the intention of sharing their best practices and to bring their knowledge, products and technologies for risk and disaster management, humanitarian aid and emergency response.
More information on the outcome of the previous workshops in 2007, 2008 and 2009 and the respective presentations made during the workshops are available at http://www.un-spider.org.
Robert BACKHAUS, Lorant CZARAN, Natalie EPLER, Michael LEITGAB, David STEVENS, Joerg SZARZYNSKI
With the technical support of: Ashley LIN
International support mechanisms and the SpaceAid Framework
International support mechanisms and the SpaceAid Framework
The DLR Center for Satellite based Crisis Information (ZKI): Current status and considerations for the future
The DLR Center for Satellite based Crisis Information (ZKI): Current status and considerations for the future
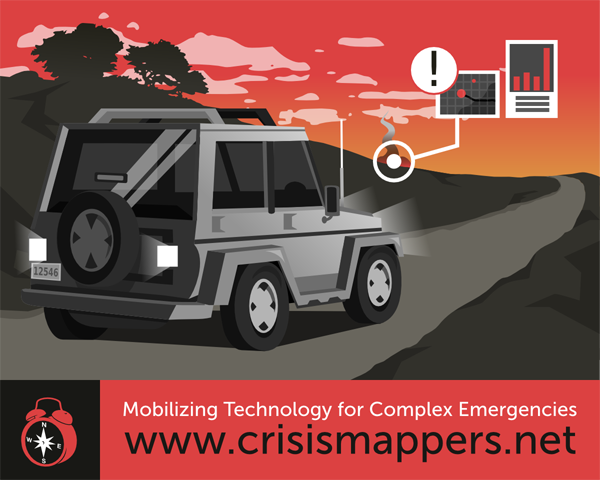
The International Network of Crisis Mappers
The International Network of Crisis Mappers
Jen Ziemke, Co-Founder, International Network of Crisis Mappers
The Network

The International Network of Crisis Mappers (www.crisismappers.net) is the world’s premier hub for crisis mapping and humanitarian response. The network brings together a diverse set of individuals from the humanitarian, human rights, policy, technology, and scholarly communities, to help catalyze communication and collaboration between and among a wide range of different communities with the purpose of advancing the study and application of crisis mapping worldwide. We are excited by the possibility of continuing our collaboration with UNOOSA/UN-SPIDER on current and future initiatives and were very happy to attend the latest workshop in Bonn.
Throughout the year, the Crisis Mappers Network facilitates continuing virtual interaction among its members. Participants engage the community through monthly webcasts, create and browse profiles, e-mail their needs through our dedicated Google Group, and write blogs and share other announcements with the Group. As of October 2010, the Network had grown to over 1,000 members from over 30 countries across 6 continents. We encourage interested members of the UN-SPIDER community to join the Network. We need your advice and respect your unique expertise in this domain. We are excited by the new innovations that emerge from working together and leveraging our collective knowledge.
We are a volunteer-led, loose horizontal network of engaged individuals committed to working together and learning from one another, and overcoming the problem of informational and institutional silos.
Our value-added
Members of the Crisis Mappers Network revolutionized disaster response in the way they mobilized and collaborated following the earthquake in Haiti in 2010. An excellent overview of the unprecedented role played by the Crisis Mappers Group in Haiti, which helped save hundreds of lives is given in “Measuring our Response: An Executive Summary”, which is available on Google Docs (1). None of this would have been possible without the first International Conference on Crisis Mapping, in Cleveland in October 2009. The conversations that began in 2009 at the conference helped shape a culture of sharing, trust, openness, dialogue, and a commitment among our members that helped enable the remarkable volunteer community response that ensued. Members shared the very latest aerial and satellite imagery, their professional and technical expertise, and countless hours of their time. If someone requested help of our network, within less than an hour typically someone in the community would offer their assistance. Thousands of e-mails, tweets, blog posts, and Skype chats directly helped facilitate humanitarian response on the ground.
This response has certainly not been limited to the crisis in Haiti or just to the Crisis Mappers Network. Several other networks like our friends at Crisis Commons have been integral to this new movement as well. Over the past year, the community broadly defined also proved its continuing capacity to contribute to effective disaster response in the wake of destructive floods, typhoons, conflict, chronic poverty, a cholera epidemic, and after crippling snowstorms and devastating oil spills.
The Crisis Mappers also continue to work on issues related to elections, fraud, and community engagement in repressive regimes. In short, they are brainstorming creative solutions to some of the world’s most complex problems. Please keep in mind these efforts are new and only mark the beginning of what will be a long, evolving process. We need your help identifying and coping with the practical, political, ethical and technical issues that have emerged.
The Conference Series
The International Network of Crisis Mappers convenes an annual conference series, to bring together the most engaged practitioners, scholars, software developers and policy makers at the cutting edge of crisis mapping and humanitarian technology to address and assess the role of crisis mapping and humanitarian technology in disaster response. The inaugural conference took place at John Carroll University in Cleveland Ohio in October 2009. The second annual event was convened at Tufts and Harvard Universities in Boston, Massachusetts in October 2010.
These annual conferences facilitate collective engagement and dialogue that helps construct the boundaries of this emergent new discipline. At the conference, participants also brainstorm how to solve real problems and initiate projects to help advance this new field.
Sections/Discussions
The public portion of the conference begins with an engaging set of five-minute ignite talks, in order to familiarize everyone with the exciting work being done in this space, and in order to maximize value, networking, and interactivity. At ICCM 2010 in Boston, we heard special remarks from the first Chief Information Technology Officer of the UN, Assistant Secretary General Dr. Choi Soon-hong. Our keynote speaker, Kurt Jean Charles, then offered a remarkable first-hand account of what his Haitian technology company did to help save lives after the earthquake. Videos of all ignite and keynote talks from the conferences in 2009 and 2010 are available on the Crisis Mappers homepage (2).
The first day of the public conference also includes an interactive Technology and Analysis Fair that enables participants to directly engage with several different platforms and academic analyses of Crisis Map data. Sessions over the three days are structured to allow ample time for networking and collaboration over breaks and meals.
The invitation-only Annual Meeting kicks off with a series of roundtables meant to explore lessons learned and where to go from here. In 2010, over 20 creative self-organized sessions which were organized and initiated by participants themselves really helped advance and create future directions for this field.
ICCM 2011 builds on highly diverse attendance in 2009 and 2010
Our list of attendees from past conferences span a diverse field, including representatives from: the United Nations Office of the Secretary General, UN Global Pulse, the UN Office for the Coordination of Humanitarian Affairs (OCHA), the UN Development Programme (UNDP) Sudan, UNOOSA/UN-SPIDER, the Operational Satellite Applications Programme of the UN Institute for Training and Research (UNITAR/UNOSAT), the UN Children’s Fund (UNICEF), the UN High Commissioner for Refugees (UNHCR), the World Food Programme (WFP), the UN Foundation, the World Bank, Sustainable Technologies, Accelerated Research - Transformative Innovation for Development and Emergency Support (STAR-TIDES), ICC, EU's Joint Research Center (JRC), NATO, International Committee of the Red Cross (ICRC), American Red Cross, Human Rights Watch, United States Holocaust Memorial Museum (USHMM), Freedom House, US Department of Homeland Security (DHS), US Federal Emergency Management Agency (FEMA), United States Geological Survey (USGS), US Department of State, US Agency for International Development (USAID), American Association for the Advancement of Science (AAAS), National Geospatial Intelligence Agency, Google, ESRI, Amnesty International, Microsoft, Vodafone, IBM, Reuters/AlertNet, International Foundation for Electoral Systems (IFES), New York Times, InterNews, InterAction, Meedan, FortiusOne, GeoCommons, Humanitarian Accoord, iMMAP, Digital Democracy, ImageCat, InSTEDD, Ushahidi , ReliefWeb, Plan West Africa, Sahana, GeoTime, Digital Globe, Mercy Corps, ICT4Peace, Map Kibera, CDAC Haiti, Louisiana Bucket Brigade, NiJeL, FrontlineSMS, OpenGeoSpatial, OpenStreetMap, Solutions.ht, Konpa Group, Development Seed, HealthMap, Tufts, Columbia/SIPA, Tulane, University of Sussex, Carnegie Mellon, Berkeley, National Defense University, UCLA, Stanford, Princeton, Harvard Center for Geographic Analysis, MIT Media Lab, and Crisis Commons.
ICCM 2010 was sponsored by Humanity United, the Open Society Institute, the United States Institute of Peace, the Knight Foundation, Google, ESRI, Ushahidi, the World Bank, the Hitachi Center, the Fletcher School at Tufts University, and GeoTime. The Harvard Humanitarian Initiative and John Carroll University convened the annual conference series in 2009 and 2010.
Our niche
The new field of Crisis Mapping encompasses the collection, dynamic visualization and subsequent analysis of geo-referenced information on contemporary conflicts and human rights violations. A wide range of sources are used to create these crisis maps, such as events data from newspaper and intelligence parsing, satellite imagery, interview and survey data, SMS, etc. Scholars have also developed analytical methodologies to identify patterns in dynamic crisis maps. These range from computational methods and visualization techniques to spatial econometrics and “hot spot” analysis.
While scholars employ these methods in their academic research, operational crisis mapping platforms developed by practitioners are typically devoid of analytical tools. At the same time, scholars often assume that humanitarian practitioners are conversant in quantitative spatial analysis, which is rarely the case. In other words, there is a notable divide between scholars and practitioners in the field of crisis mapping and any division slows the progress of a new field. The purpose of the Network and the conference series is therefore to continue to bridge the divide by bringing scholars and practitioners together to shape the future of crisis mapping.
We hope that the Network and conference series is just the start of many new collaborative ideas that emerge when we work together rather than in isolation from one another. We look forward to many new developments in this space in the months and years to come. We hope you join us!
References
- Measuring our Response: An Executive Summary, on: http://docs.google.com/Doc?docid=0ATKkO3odnjoeZGd2OWpna2NfNTZnY2RiaHhkcQ&hl=en (last viewed 10 November 2010)
- Ignite talks of ICCM 2010, on: http://www.crisismappers.net/video (last viewed 10 November 2010).
Overview of the flood situation in West Africa in 2010: the role of spatial information management
Overview of the flood situation in West Africa in 2010: the role of spatial information management
Abdoulaye Dieye, GIS Officer, United Nations Office for the Coordination of Humanitarian Affairs, Regional Office for West and Central Africa (UNOCHA/ROWCA)
Context
Since 2007, the flood situation in West Africa is becoming more and more recurrent and the impact on the population and infrastructures is becoming more severe.
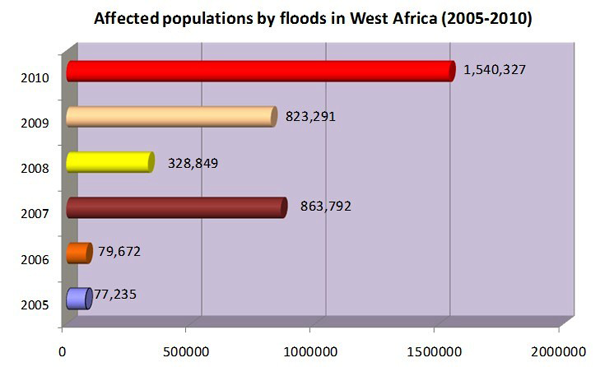
Figure 1: Flood affected populations in West Africa during the last 5 years. Sources: Data from 2005, 2006, 2008: CRED. Data from 2007, 2009, 2010: OCHA.
Since 2009, the United Nations Office for the Coordination of Humanitarian Affairs/Regional Office for West and Central Africa (UNOCHA/ROWCA) has been working closely with the UN Platform for Space-based Information for Disaster Management and Emergency Response of the United Nations Office for Outer Space Affairs (UNOOSA/UN-SPIDER), other UN entities (the World Food Programme (WFP), the Operational Satellite Applications Programme of the UN Institute for Training and Research (UNITAR/UNOSAT), etc.), members of the International Charter Space and Major Disasters (International Charter) for obtaining satellite imagery and rapid mapping, members of the European Services and Applications for Emergency Response (SAFER), governments, and NGOs to support emergency response and risk reduction efforts with geospatial information and rapid mapping.
Flood impact profile in West Africa in 2010
The year 2010 is generally marked by a relative humidity higher than in previous years with heavy rains between June and October over the sub-region of West Africa. Devastating floods are observed in almost all countries of the sub-region with over 1.5 million affected people and over 300 deaths. Significant damages were also noted on socio-economic infrastructures with houses, roads, bridges, hospitals, and schools destroyed, thousands of hectares of farmland and crops washed away, and livestock decimated. Benin is the most affected country with about 690,000 affected people, 86 deaths and 86,000 hectares of farmland damaged. Benin is followed by Nigeria (300,000 Internally Displaced Persons), Niger (226,000 affected people), and Burkina Faso (over 105,000 affected people).
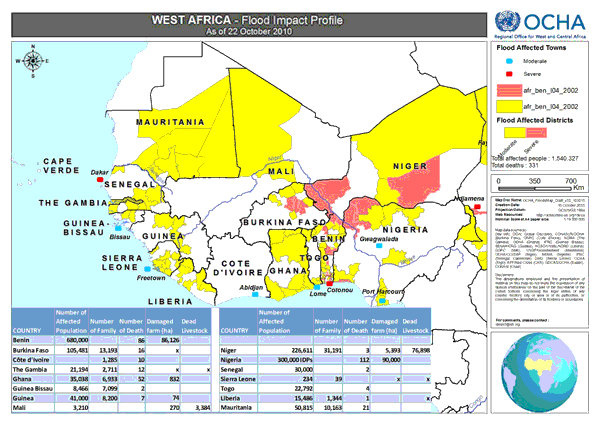
Figure 2: Map of floods impact profile in West Africa
Mechanism of coordination and communication for geo-spatial information and rapid mapping support
Within their respective roles to facilitate the coordination of humanitarian affairs and space affairs, UNOCHA/ROWCA works closely with the UNOOSA/UN-SPIDER to facilitate the activation of mechanisms for spatial information and rapid mapping support (the International Charter, SAFER, etc.) in West Africa.
Mechanism used by UNOCHA to request Charter and SAFER activation in Burkina Faso, Senegal and Benin in 2010
After an alert from the press, local UN Offices, NGOs, or the Government, UNOCHA requests support through the UN-SPIDER SpaceAid Framework and indicates its needs in consultation with UN-SPIDER experts and the UN-SPIDER National Focal Point. UN-SPIDER forwards the request to all partners of the Framework. The project manager who is nominated by the providers (UN-SPIDER partners) works closely with the different stakeholders (UN-SPIDER, UNOCHA, Government). The maps and spatial data are disseminated on the Knowledge Portal and the links are shared to UNOCHA and the National Focal Point as end users. These products are shared to humanitarian partners (UN Offices, NGOs, governments, etc.) to facilitate their activities in the field. A user feedback form is filled in at the end of the support mechanism to evaluate the process.

Figure 3: Schematic of the mechanism used to activate SAFER and the International Charter for Burkina Faso, Senegal and Benin.
Examples of spatial information and rapid mapping support in West Africa
In 2009, the International Charter was activated to obtain satellite imagery and support in rapid mapping for Benin, Senegal, Burkina Faso, Niger and Mauritania.
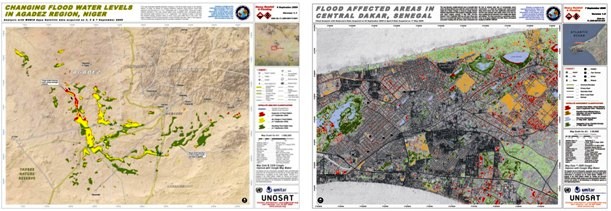
Figure 4: Maps of flooded areas in Agadez (Niger) and Dakar (Senegal) obtained after processing of satellite images from the International Charter.
In 2010, SAFER has been activated for three countries (Burkina Faso, Niger and Senegal), the International Charter for two countries (Benin and Nigeria).
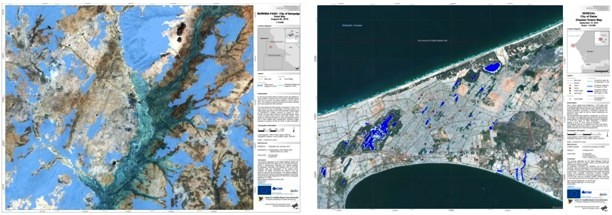
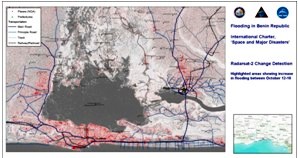
Figure 5: Maps of flooded areas in Sampelga (Burkina Faso) and Dakar (Senegal) obtained after processing of satellite images from SAFER, and Cotonou (Benin) from the International Charter.
These activations were supported by UN-SPIDER as well as by the European Union, the European Space Agency (ESA), the United States Geological Survey (USGS), the German Aerospace Center (DLR) and others. The image processing and rapid mapping were done by UN-SPIDER partner institutions (DLR for SAFER, UNITAR/UNOSAT and the Pacific Disaster Center for the International Charter).
The UN-SPIDER SpaceAid Framework
The UN-SPIDER SpaceAid Framework
David Stevens, Programme Coordinator, United Nations Office for Outer Space Affairs, United Nations Platform for Space-based Information for Disaster Management and Emergency Response (UNOOSA/UN-SPIDER)
When an emergency happens there is an urgent need to assess impacts and requirements as soon as possible. Space-based technologies provide innovative ways to generate information to respond to this need. Earth observation and meteorological satellites continuously image the Earth. If tasked to acquire imagery over disaster areas, these satellite-based sensors can rapidly help evaluate the extent of the impact caused by the disaster, thereby ensuring rescue efforts are sent to the right place. Global Navigation Satellite Systems (GNSS) support response teams by helping them reach the disaster area (navigation) and also by providing the means of registering on a map the location of anything the response team needs to locate geographically (positioning). Finally, satellite communication provides a valuable alternative to land-based communication systems.
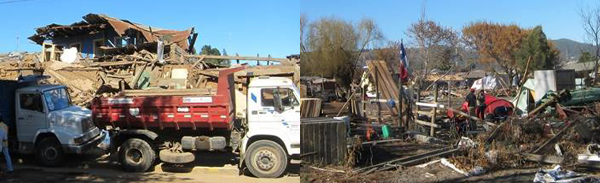
Figure 1 – Impact of the Chile Earthquake 27 February 2010
There are a number of available mechanisms and initiatives that help countries receive relevant information and access space-based technologies to support response efforts, such as the International Charter Space and Major Disasters, Sentinel Asia and Télécoms Sans Frontières. In 2009 the UN-SPIDER Programme initiated the SpaceAid Framework to help countries as well as international and regional organizations benefit from these technologies and this type of information, specifically to:
a) Ensure that all end users are able to access these mechanisms and initiatives, on a 24 hours a day/7 days a week basis, and that they also have the capacity to use all space-based information made available to support emergency events;
b) Provide guidance to the existing mechanisms and initiatives on the specific requirements of the end users and also on how they could improve and extend their support;
c) Establish additional opportunities beyond what is currently available within the existing mechanisms, and;
d) Provide information to those interested in providing support (space-based information and expertise) on how they could channel their support and to whom.
The UN-SPIDER Programme is uniquely positioned to implement and promote this framework:
a) The Programme has been specifically mandated by the United Nations General Assembly to ensure that all countries are able to access space-based information to support emergency response. To this end, since 2007 the Programme has built working relationships with national and regional space agencies, international mechanisms, and technical organizations capable of generating such type of information;
b) The Programme derives strength from a network of UN-SPIDER Regional Support Offices which ensures that end users can access expertise regionally. In its resolution 61/110, the United Nations General Assembly agreed that UN-SPIDER should work closely with regional and national centres of expertise in the use of space technology in disaster management to form a network of Regional Support Offices for implementing the activities of UN-SPIDER in their respective regions in a coordinated manner;
c) Currently, the Office for Outer Space Affairs has signed cooperation agreements with Algeria, Iran (Islamic Republic of), Nigeria, Pakistan, Romania, Ukraine, the Asian Disaster Reduction Center (ADRC), the Regional Center for Mapping of Resources for Development (RCMRD), the Water Center for the Humid Tropics of Latin America and the Caribbean (CATHALAC) and the University of West Indies, formalising the establishment of ten Regional Support Offices worldwide;
d) The Programme has established a network of UN-SPIDER National Focal Points. A National Focal Point is a national institution nominated by the Government of the respective country, representing the disaster management and space application communities. The role of National Focal Points is to work with UN-SPIDER as well as with UN-SPIDER Regional Support Offices to strengthen national disaster management planning and policies and implement specific national activities that incorporate space-based technology solutions in support of disaster management;
e) The UN-SPIDER Knowledge Portal (www.un-spider.org) is central to all activities of the UN-SPIDER Programme as in essence it provides the hosting environment and dissemination tool for all these activities and the resulting outputs and products. Specifically to support SpaceAid, a separate webpage is created for every event and the following information included: information on the event, available value-added products, available pre- and post disaster images, UN-SPIDER contact points, including the Regional Support Office, information on sensor tasking, available geospatial data sets, vector data of impacted areas, and other space-based information and technologies, and;
f) The UN-SPIDER Programme supports countries directly by carrying out Technical Advisory Missions to countries that request such support.
The work of the United Nations Office for Outer Space Affairs in relation to disaster management and emergency response is driven by resolution 61/110 which established the United Nations Platform for Space-based Information for Disaster Management and Emergency Response, known as UN-SPIDER. The accomplishment sought by the programme of work being implemented by UN-SPIDER is greater understanding, acceptance and commitment by countries on ways of accessing and developing capacity to use all types of space-based information to support the full disaster management cycle. UN-SPIDER has been established through this resolution to act as a gateway to space information for disaster management support, to serve as a bridge to connect the disaster management and space communities, and to act as a facilitator of capacity-building and institutional strengthening, in particular for developing countries.
UN-SPIDER staff together with the UN-SPIDER Regional Support Offices is implementing the SpaceAid Framework. The Framework aims at:
a) Ensuring that all end users can access and use all space-based information made available to support emergency events by existing mechanisms and initiatives. Importantly the end users have to be able to access and receive this support on a 24 hours a day/7 days a week basis. The space-based information has to be available to support early warning (monitoring), emergency and humanitarian response as well as early recovery;
b) Providing guidance to existing mechanisms and initiatives on how they could improve and extend their support, as well as establishing new opportunities;
c) Ensuring that providers of space-based information and expertise know who to provide support to.
As depicted in Figure 2, the SpaceAid Framework is built on four cornerstones:
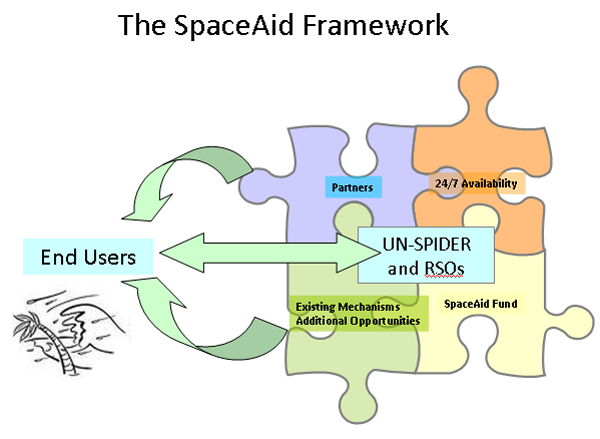
Figure 2 – The SpaceAid Framework
- Existing mechanisms and additional opportunities with which UN-SPIDER establishes cooperation agreements and arrangements to access and make available to end users space-based information and value added products as well as other space-based solutions and technologies;
- An operational 24 hours a day/7 days a week emergency hotline which can be accessed through telephone, e-mail or fax to which end users can send their request for support. Additionally there is the need to ensure that all relevant information is made available immediately to the end users as well as to those interested in providing support;
- Partnerships, in addition to ones established with the UN-SPIDER Regional Support Offices, with leading centres of excellence (national and regional) as well as academic institutions, non-government organisations and private companies willing to provide support to analyse the space-based information and provide scientific and technical expertise to end users, and;
- The SpaceAid Fund which would enable the framework to provide support beyond what is currently possible and also to ensure rapid and direct acquisition of satellite imagery as well as other space-based technologies to support emergency and humanitarian response in cases when existing mechanisms could not provide the full extent of what is required, such as when users need to receive imagery from specific sensors or when there is a need to have multi-agency licenses, as well as for humanitarian response, early recovery and reconstruction.
Existing mechanisms and initiatives
The UN-SPIDER Programme already has in place agreements and arrangements with several of the global and regional initiatives including the International Charter Space and Major Disasters (UNOOSA has been a cooperating body to the Charter since 2003), Sentinel Asia (UNOOSA is a member of the Joint Project Team), and the GMES Project “Services and Applications for Emergency Response” (SAFER). Additionally, UN-SPIDER ensures cooperation with another relevant GMES Project “GMES services for Management of Operations, Situation Awareness and Intelligence for regional Crises” (G-MOSAIC) and works closely in promoting and leveraging upon the opportunities provided by the regional SERVIR projects.
The SERVIR Regional Visualization and Monitoring System integrates Earth observations and forecast models together with in situ data and knowledge for timely decision-making to benefit society, particularly to support disaster management. SERVIR is being implemented regionally in Latin America and the Caribbean by CATHALAC, in Eastern Africa by RCMRD, and in the Himalaya region by the International Centre for Integrated Mountain Development (ICIMOD) in Nepal. Both RCMRD and CATHALAC are UN-SPIDER Regional Support Offices, which ensures close coordination and strengthens the regional work.
The UN-SPIDER Programme works closely with the above projects and initiatives, promoting them with end users and ensuring that these end users establish direct working relationships with such mechanisms. Additionally, the UN-SPIDER Programme provides guidance to these projects on how they could improve and extend their support to meet the need of the end users.
Building additional opportunities and partnerships
In providing support to countries the UN-SPIDER Programme takes advantage of additional opportunities governments, non-governmental organisations and the private sector are making available and also ensures the involvement of leading centres of excellence to support the analysis of the space-based data being made available.
China has offered direct access to its satellites HJ-1A and HJ-1B and has already provided imagery to support several emergencies. Additionally, the UN-SPIDER Programme has worked closely with several providers of space-based imagery including NASA, DLR, RapidEye, Scanex, Digital Globe and GeoEye, facilitating the access of data made freely available by these providers to the end users.
In providing support to countries the UN-SPIDER Programme aims at involving the UN-SPIDER Regional Support Offices and other centres of excellence that are in a position to support the analysis of the data and in the production of the maps and value-added products.

Figure 3 – UN-SPIDER Regional Support Offices – 1st Meeting 09 February 2010
Support provided in 2009 and 2010
In 2009 the SpaceAid Framework supported a total of 20 events globally (Afghanistan, Bangladesh, Burkina Faso, El Salvador, Fiji, Guatemala, Indonesia, Iran (Islamic Republic of), Italy, Lao PDR, Morocco, Namibia, the Philippines, Samoa, Senegal, Tajikistan and Vietnam). In the first 10 months of 2010 a total of 25 emergency events have already been supported including the two devastating earthquakes that hit Haiti and Chile (Benin, Burkina Faso, Chile, China, Cook Islands, Gaza oPt, Guatemala, Haiti, Kazakhstan, Kenya, Madagascar, Moldova, Pakistan, Senegal, Solomon Islands, Sri Lanka, Sudan, Tajikistan, Tonga, Turkey, Uganda and Ukraine).
The evident increase in the number of events supported by the SpaceAid Framework is due to the implementation of standard operating procedures which contributed to the streamlining and optimisation of the support provided, the establishment of additional agreements and arrangements with existing mechanisms and opportunities, and the increasing expansion of the network of UN-SPIDER Regional Support Offices which brings in additional expertise and resources.
In order to be able to receive funds that will support the functioning of the SpaceAid Framework, particularly to ensure rapid and direct acquisition of satellite imagery as well as other space-based technologies to support emergency and humanitarian response in cases when existing mechanisms could not provide the full extent of what is needed, the Office for Outer Space Affairs set up a specific account within the existing “Trust Fund in Support of United Nations Space Applications Programme”. This fund will complement the existing opportunities, ensuring that all countries in the world are able to request and receive space-based information to support all emergency and humanitarian response activities.
Satellite communication for disaster management
Satellite communication for disaster management
IT-supported management of mass casualty incidents: the e-Triage project
IT-supported management of mass casualty incidents: the e-Triage project
Anton Donner and Javier Mulero Chaves
DLR, Institute of Communications and Navigation, Weßling/Oberpfaffenhofen, Germany
Introduction
The World Health Organization (WHO) gives the following definitions of disasters and emergencies:
“Disasters are events that occur when significant numbers of people are exposed to hazards to which they are vulnerable, with resulting injury and loss of life, often combined with damage to property and livelihoods.”
and
“Emergencies are situations that arise out of disasters, in which the affected community’s ability to cope has been overwhelmed, and where rapid and effective action is required to prevent further loss of life and livelih-ood.” (1)
These definitions imply that emergencies are characterized by limited resources in terms of medical personnel and infrastructure, which underlines the importance of mobilizing regional, supra-regional and/or international help to the affected regions. Effective deployment of this help is crucial but only possible if a common operational picture between authorities, coordination centers, and staff working in the field is rapidly developed.
Upon arrival on site, the first task of a rescue team is to look for injured persons and to assess the situation. For scenarios with many (seriously) injured persons, many countries have foreseen a standard procedure for the initial scouting, known as “triage”. According to it, teams consisting of medical doctors or paramedics classify victims according to different categories (e.g., immediate, delayed, minor, no chance of survival) and attach paper labels to the victims.
Paper-based triage and registration systems are still state-of-the-art, because they are robust and their usage is intuitive. Nevertheless, the main drawback is that information about affected persons remains among the persons themselves, making disaster management considerably more difficult. Data can be duplicated/ aggregated by manually copying triage tags only, which is a laborious and time-consuming process. Moreover, as soon as there is more than one rescue team (organization) involved maintaining different lists, or there is more than one access to the disaster area (which is the typical case for wide-area disaster events with large geographical extension, like earthquakes), registration of injured/affected persons turns out to be a logistic problem since it can only be performed at defined transfer points. Besides, experience has very often shown that injured persons ‘bypass’ the theoretical work flow of the rescue chain (see Figure 1), because passers-by or relatives take them to the nearest hospitals. This effect implies an additional problem, namely a saturation of the geographically nearest hospitals, which very often do not have a communication return channel to coordination centers.
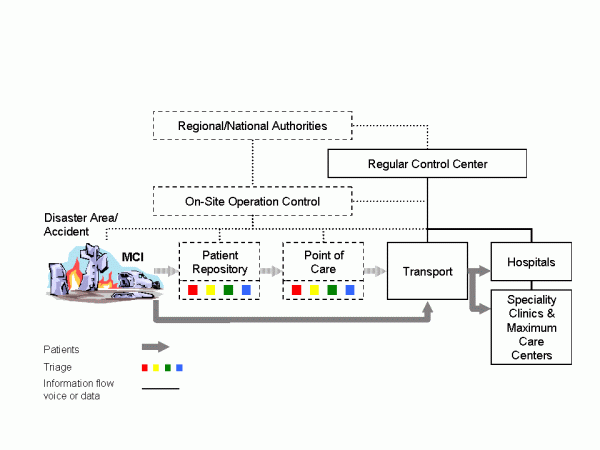
Figure 1: Present work flows and operation control for individual rescue (solid lines and blocks) and MCI (dashed lines and blocks).
Indeed, triage and registration performed at different places by different teams maintaining different lists are indubitably an error-prone approach. It can happen that all later attempts to track the way of single patients, their attendants and transport vehicles are not very successful, although this could be of key interest in scenarios with nuclear, biological or chemical hazards. Last but not least, relatives have a legitimate interest in the whereabouts of their family members.
Communication and dissemination of this information in order to provide coordination centers with an accurate situation overview (i.e. number of victims, injury categories and their location) becomes one of the main challenges to overcome, since the normal medium nowadays for exchanging information are voice-based radio systems.
Key concept
Earlier works have already described concepts for and advantages of IT-supported MCI management, which can be applied not only to operations in the field, but also to emergency rooms of hospitals. A comprehensive overview can be found in (2). Some of these system architectures include wearable sensors with wireless connectivity, e.g. (3), (4); others use radio-frequency identifications (RFIDs) in read/write mode, e.g. (2), (5), which means that data is stored both in the RFID chip and transmitted from a handheld device to a database. The main objective of this article is to describe the e Triage approach (6), which is a research project funded by the German Federal Ministry of Education and Research and which consists of four main elements: autonomous communication infrastructure, electronic data recording, a distributed database system (7), and psychological acceptance research. Outcome of the project will be a demonstrator system for registration of affected persons of an MCI. In more details, the e-Triage system comprises a satellite-based communication system with terrestrial radio cells that can be installed in the field, matching end devices with dedicated application software for the registration of victims, and a distributed, self-synchronizing database system guaranteeing maximal availability without a single point of failure. Main differences to approaches described in literature are:
- Sensors monitoring vital parameters of single patients might be a valuable tool in hospital environments, but for e-Triage the concept decision was to apply a simple classification scheme only.
- Triage tags (registration cards or colored wristbands) are not used as data storage media. Instead, a triage tag is labeled with a unique identifier (ID) in different formats only (RFID, optical matrix code, human readable text). With the ID the patient’s data set can be obtained from the database.
- A distributed database system mapping IDs to persons is a key component of the approach. Not only hardware with optical/RFID scanners can be used to obtain the patient ID, but also notebook or desktop computers may be used for this purpose (with the database software running from external flash drives and the ID typed in with a normal keyboard).
- User terminals are designed primarily for regular rescue services, so that in case of a disaster they are instantly available.
Unique electronic labels remaining attached to victims show advantages for the subsequent rescue chain: due to the contact-free readability it is possible to equip ambulances and doorways of (field) hospitals with scanners which automatically transmit the new location (and/or the geographical position) of the respective person to the control center via various complementary wireless transmission links (see below). Additionally, patients could change their status (e.g., from category II “delayed” to category I “immediate”) and this information is fed into the continuously updated distributed database allowing an operation control to trace how the situation evolves. On site forces can be redeployed and additional forces dispatched on the fields. (Field-) Hospitals can organize their care capacity, call for back-up personnel and send feedback reports to remote coordination centers. Last but not least, information regarding the whereabouts of the victims is easily obtainable and the entire information base is available for a later evaluation since MCIs are always subject to later police investigation.
Data management

Figure 2: Distributed database system (DDBS) concept and synchronization of DDBS instances along the rescue chain.
Albeit the main challenge for the e-Triage system is aggregation of distributed data acquired from many terminals in the field, a fully centralized approach for data storage is not desirable. Rescue operations are temporally and spatially distributed events. Thus, a distributed data management approach has to be applied (see Figure 2). Arriving triage and medical rescue teams have to be able to start working immediately without having to wait for the communication infrastructure to be set up. Furthermore, all the collected data needs to be forwarded to local and remote decision makers automatically. As an integral part of this architecture, network outages or node failures have to be anticipated. Thus, the underlying storage technology will be a distributed database system (DDBS), which has to cope with a variety of different communication technologies, including terrestrial wireless and satellite links with different bandwidths. A basic assumption for the design is that, on the one hand, the network topology might change at any time. On the other hand, all involved communication links are not reliable so that intermittent network outages might occur (e.g., end devices leaving the coverage area of the locally installed radio cells). Nodes of this DDBS are installed in all mobile user terminals (tablet-PCs), at communication nodes (OSECEs), and in the remote area. The DDBS discovers joining and leaving nodes, and (re-)joining nodes have to be synchronized with the core DDBS. This design supports even scenarios with no network connectivity at all: it is possible to synchronize database nodes by exchanging flash memory cards.
Communication
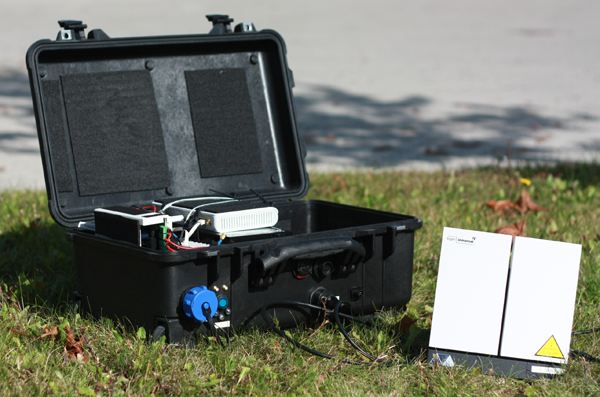
Figure 3: e-Triage communication suitcase (on-site emergency communications equipment, OSECE) consisting of an Inmarsat BGAN satellite terminal, a GSM pico cell, and a WLAN router (9).
An electronic registration system for MCIs requires wireless communication services, and since local infrastructures may not exist at all or can be destroyed, it is of paramount importance that at least a temporary communication system is set up. Even if functioning networks exist, it is most likely already saturated by the affected persons using their mobile phones. For rescue missions in less densely populated or less developed or seriously destroyed countries satellite phones (e.g., Globalstar or Iridium) are commonly used during the first hours/days. The idea of backhauling terrestrial cellular networks via a long-haul satellite link is not new and commercial products already exist. An example is Emergesat by Thales Alenia Space which has been designed to fit into a container for air freight. Disadvantage of this solution is that it is rather bulky and transport into an affected area can be rather challenging. The development of a more flexible and faster deployable solution has been initiated in the WISECOM project (8) and is currently continued within e-Triage. The basic design goal is that the complete on-site emergency communications equipment (OSECE) fits into a hand-luggage size suitcase. The chosen satellite technology is Inmarsat BGAN, which is globally available but offers limited bandwidth only, and the resulting suitcase prototype is 56cm x 35cm x 23cm, including a battery pack for a few hours runtime (9). The BGAN terminal itself needs only to be taken out of the suitcase, and the antenna can be easily pointed to the satellite within a few minutes.
A second more powerful OSECE system is currently under development for use in mobile coordination centers, which is based on a commercial Very Small Aperture Terminal (VSAT) satellite system and which offers more capacity and wider terrestrial coverage. Manual alignment of the antenna reflector (diameter ca. 1 m) is not an option for this application, so the decision was to use a self-aligning antenna unit which can be mounted on a suitable vehicle.
The quasi-stationary OSECE nodes include several base-stations for different wireless technologies:
- WLAN: Data communication as well as Voice over IP (VoIP) calls can be provided by WLAN access points. For the registration of affected persons WLAN is the preferred medium since it offers sufficient bandwidth for many terminals in parallel.
- GSM/GPRS: These well-known standards allow voice and data communication. GSM cell phones are inexpensive and available all over the world, which in turn means that in most cases the access to the temporary GSM service has to be restricted to avoid network congestion. Then again, a GSM base-station can be configured so that unknown phones are booked into the network in a listen-mode only, which is an excellent possibility to distribute information or warning messages among the population in the area. A major disadvantage of GSM is the missing group call functionality. General packet radio service (GPRS) is the secondary medium for data exchange in the e-Triage concept.
- DECT: Digital Enhanced Cordless Telecommunications (DECT) is suitable for voice communication in vicinity of the local coordination center.
- TETRA: The PMR standard TETRA will not be part of the final demonstrator system, but is currently under study within the project.
The different terrestrial wireless technologies supported by an OSECE are depicted in Figure 4. Note that two or more OSECEs connected via WLAN in bridged mode can be deployed in the field with only one having backhaul connectivity.
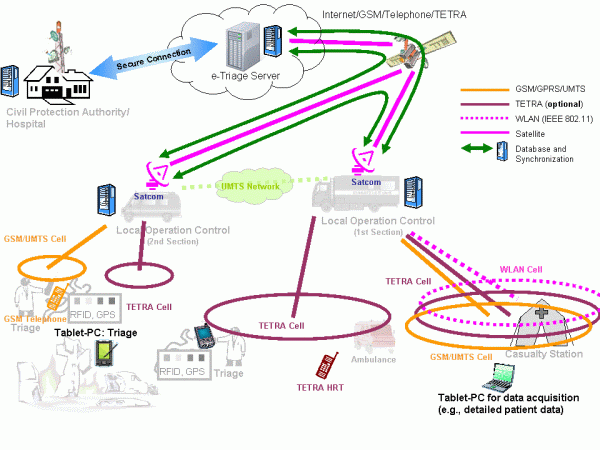
Figure 4: Fully deployed e-Triage communication infrastructure.
Conclusion
This paper has given a brief description of the architecture of the e-Triage system and the challenge to manage data in MCIs. Although earlier and other current works have studied single components of electronic MCI management, a unique feature of e-Triage is that for the first time a coherent overall concept consisting of mobile devices, communication infrastructure, and data management is under development. Another unique feature is that all developments, ranging from hardware selection to graphical user interface implementation, are accompanied by a team of psychologists, ensuring that all components are self-explanatory and can be used intuitively without causing additional stress. At the time of writing this article the system is under implementation and a series of real-live trials will start from January 2011.
Public safety communication means in most cases voice communication (group calls) using dedicated PMR networks, which are designed for closed user groups with partly specific confidentiality requirements. Introducing data communication to public safety requires appropriate preparation, which means that one may not rely on the availability of public (commercial) terrestrial networks only. With our satellite-based communication facilities flexible data services can be provided plus the possibility to quickly establish point-to-point telephone services in case of extreme disasters. It is important to remark that even without a backhaul link all the services provided in the disaster area are available, so that the rescue operation will not be affected
References
- B. Wisner and J. Adams, Eds., Environmental health in emergencies and disasters: a practical guide. World Health Organisation (WHO), Jul. 2003. [Online]. Available: http://www.who.int/water_sanitation_health/hygiene/emergencies/emergencies2002/en/
- S. Nestler, M. Huber, and G. Klinker, “Hybrid approach for management of patient-related information in mass casualty incidents,” Technische Universität München, Technical Report, Oct. 2009, TUMI0926. [Online]. Available: http://ar.in.tum.de/Chair/PublicationDetail?pub=nestler2009hybrid
- T. Massey, T. Gao, M. Welsh, J. H. Sharp, and M. Sarrafzadeh, “The design of a decentralized electronic triage system,” in American Medical Informatics Association (AMIA) Annual Symposium Proceedings, 2006, pp. 544–548, PMCID: PMC1839501. [Online]. Available: http://www.ncbi.nlm.nih.gov/pmc/articles/PMC1839472/pdf/AMIA2006_0429.pdf
- T. Gao and D. White, “A next generation electronic triage to aid mass casualty emergency medical response,” in Proceedings 28th Annual International Conference IEEE Engineering in Medicine and Biology Society (EBMS), New York City, USA, Aug./Sep. 2006.
- S. Inoue, A. Sonoda, and H. Yasuura, “Triage with RFID tags for massive in-cidents,” in RFID Handbook: Applications, Technology, Security, and Privacy, S. A. Ahson and M. Ilyas, Eds. CRC Press, Mar. 2008, ch. 27, pp. 329–349.
- A. Donner, C. Adler, M. Ben-Amar, and M. Werner, “IT-supported manage-ment of mass casualty incidents: The e-Triage project,” in Proceedings 5th Future Security Research Conference, Berlin, Germany, Sep. 2010.
- C. Tang, A. Donner, J. M. Chaves, and M. Muhammad, “Performance of database synchronization via satellite,” in Proceedings 5th Advanced Satellite Multimedia Systems (ASMS) Conference and 11th Signal Processing for Space Communications (SPSC) Workshop, Cagliari, Sardinia, Italy, Sep. 2010, pp. 455–461.
- E. H. Fazli, M. Werner, N. Courville, M. Berioli, and V. Boussemart, “Integrated GSM/WiFi backhauling over satellite: Flexible solution for emergency communications,” in Proceedings 67th Vehicular Technology Conference (VTC2008-Spring). Singapore: IEEE, May 2008, pp. 2962–2966.
- À. V. Estrem and M. Werner, “Portable satellite backhauling solution for emergency communications,” in Proceedings 5th Advanced Satellite Multimedia Systems (ASMS) Conference and 11th Signal Processing for Space Communications (SPSC) Workshop, Cagliari, Sardinia, Italy, Sep. 2010, pp. 262–269.
Emergency.lu Solution
Emergency.lu Solution
Marianne Donven, Luxembourg Ministry of Foreign Affairs
Benjamin Hourte, HITEC Luxembourg S.A.
Alan Kuresevic, SES Astra TechCom
Sven Mertes, Luxembourg Air Rescue
Context and motivation
January 12, 2010: Haïti has just been hit by an earthquake of historic magnitude. Hours later President René Préval is walking through the debris of the devastated capital Port-au-Prince: “My palace collapsed… I have no connectivity for my cell phone to even call somebody for help…”.
January 14, 2010: Urban Search and Rescue (USAR) teams from Luxembourg arrive in Port-au-Prince, together with humanitarian workers from France and Belgium.
January 15, 2010 (in the morning): USAR teams, with their dogs, are still not able to leave the airport and likewise hindered to start their mission. Lacking telecommunications, among other requirements, are identified as a cause of poor coordination.
After a natural disaster of such proportion the first 72 hours are crucial to save lives. This is all the more true in an urban context. Not to blame anybody, but precious time was lost in Haïti because the necessary tools for quick and reliable communication were not in place in order to coordinate and deploy USAR teams as they arrived.
Upon the return of the USAR teams to Luxembourg, a debriefing session with all participants in the Ministry of Foreign Affairs allowed to sketch out a first rough draft of what is presented here as emergency.lu. This initiative is intended to bring added humanitarian value through faster and more reliable telecommunication services in the first few hours following a natural disaster, a segment of emergency relief still insufficiently covered today. In order to provide such a solution, emergency.lu bundles the already available equipment and services from three different providers:
- Luxembourg Air Rescue’s (LAR) air transport capacity to reach any destination worldwide within less than 24 hours,
- HITEC Luxembourg’s portable Nomadic Satellite Communications (NoSaCo®) system providing end user services for voice, data and video transmission via the internet (for on-site coordination between intervention sites and global transmission, respectively),
- Société européenne des satellites’s (SES) global satellite capacities for satellite based broadband internet connectivity.
Under the coordination of the Luxembourg Ministry of Foreign Affairs (Directorate for Development Cooperation and Humanitarian Action ), Emergency.lu has been established as a public private partnership with the objective to satisfy the telecommunication needs of the international humanitarian community in the immediate aftermath of a natural disaster.
Emergency.lu approach
The Emergency.lu approach has been defined to propose a set of services that can be used without delay by experts and rescuers arriving on site. The lack of coordination during the first hours after a crisis is a real difficulty to get the relevant information to prepare and coordinate the help. The existing European (ECHO) and International (OCHA) structures, both defined to organise coordination, are already proposing the appropriate mechanisms to request and organise help. The need of status information from the crisis site is mandatory to prepare the relevant activities.
Communication is very important in this first step. The experts going on the site are not telecommunication engineers but experts in needs assessment and medical care. They should have access to efficient tools for conducting situational analysis. Here Emergency.lu is providing an approach creating broadband communication and additionally offering a set of services that can be directly used by the experts. The existing TAST and AHP modules proposed by the UN and ECHO can use Emergency.lu. The service approach also includes the end-devices that can be directly and intuitively used by these experts. The equipment deployed on site, NoSaCo (Nomadic Satellite Communication), is creating a Service Point of Presence (SPoP, Figure 1). It is composed by:
- a satellite communication module, easy to point even by non telecommunication experts thanks to a sound and visual pointing system,
- video cameras to provide picture and video streams,
- sensors to capture and transfer environmental information,
- voice over IP phones to communicate locally, with the operation centre or with the other deployed SPoP,
- ruggedized computers to manage the information and draw maps or needs assessments.
The Haiti crisis has drastically shown also that for such a large crisis the deployment of a central communication point is not enough as the help will be spread along all the theatre of operations. The creation of several SPoP can help to distribute also the coordination and the collection of status information. A permanent assessment of the rescue and humanitarian activities can thus be realised, receiving constant information from different locations of the crisis site.
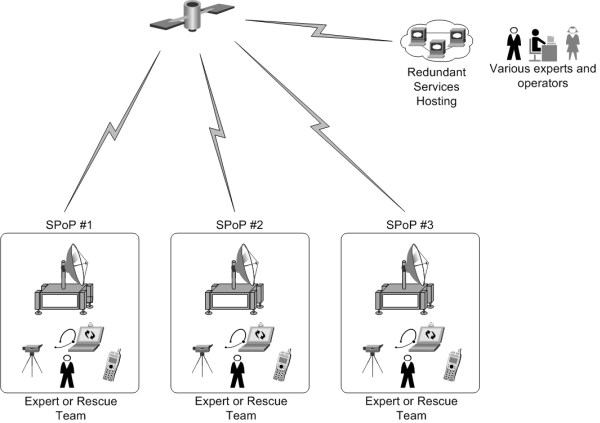
Figure 1: SPoP deployment
Receiving ample information can be a real add-on also for the analysis of the situation. Indeed, the collection of pictures, sensor information or video clips from the crisis site allows different experts, specialised in different areas, to make their proper analysis. For example, water quality specialists can receive in their laboratory the water analysis gained on site through sensors.
To efficiently collect this wealth of information, the NoSaCo terminals are also equipped with software for collecting information from the end-devices (cameras, sensors or computers), and storing and sharing it with the other SPoP or with the Service Hosting. This distributed architecture allows an advanced management of the resilience, security and quality of service, ensuring that the local collection and access to information is still possible even when no communication to the Service Hosting is possible. Once the communication is restored, synchronisation processes are sharing automatically the information with other SPoP and in the Service Hosting. The onsite experts or the operators do not have to take care of the technical elements and can focus on their primary mission.
Technical architecture and technologies
The technical architecture behind the Emergency.lu platform relies on three separate layers (Figure 2).
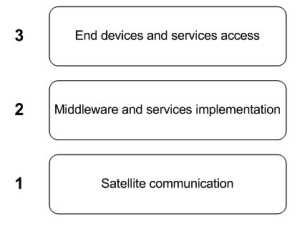
Figure 2: Architecture layers
Similar to the OSI layers, these layers provide different levels of abstraction, from the satellite telecommunication to the final delivery of a service to experts and other users.
Layer 1: Satellite communication
The overall telecommunication concept relies on the creation of three geographically distributed hubs. With the similarity to the OSI Layer representation, the Satellite communication layer can be compared with the physical layer. The hubs will maximize service availability and resource usage efficiency by implementing advanced techniques such as DVB-S2 / ACM and LDPC FEC coding on outbound, MF-TDMA and 2D 16-State coding on inbound. In addition, QoS management and TCP optimization will guarantee a good service experience to the end user.
From a satellite connectivity perspective, the teleports hosting the hubs are selected to enable up-linking to a designated subset of SES satellites that will provide a true global coverage. As presented in Figure 3, three hubs geographically distributed over the world give access to enough satellite beams from SES fleet in order to provide both C and Ku band global coverage.
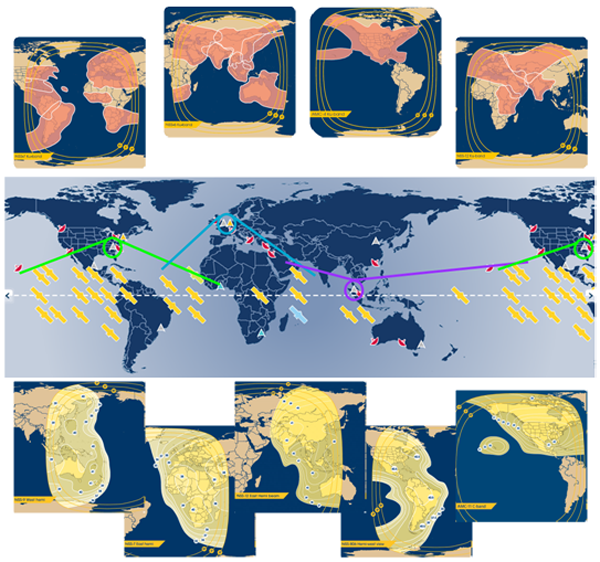
Figure 3: True global coverage (C band below – Ku band above)
This additional flexibility on the frequency side will allow tailored solutions from a link budget point of view. Furthermore, relying on a single satellite operator also brings economy of scale and allows for easy management of a global satellite service through a single interface.
From and between the teleports, IP connectivity will be ensured to the Service Hosting and the global Internet. Furthermore, the Internet connectivity allows the establishment of VPN (Virtual Private Network) connections and dedicated QoS (Quality of Service) for remote crisis centers, NGO headquarters or any other management entities. Security and privacy can be provided through encryption of the traffic. Additional security can be considered at application level.
On the crisis site, NoSaCo terminals are deployed on site to create an IP connection with the relevant hub. This connection will be used to create and deploy the service. The technologies implemented in the NoSaCo terminals are obviously highly tainted by the technologies implemented in the hubs. The main concept of these terminals is to integrate the modem into a compact, light weight and easy to deploy module. The compactness of the terminal will allow its transportation in small planes not requiring a long preparation time (Figure 4).
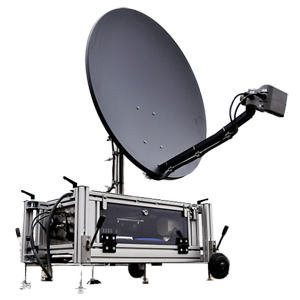
Figure 4: NoSaCo terminal
Layer 2: Middleware and services implementation
From a service layer point of view, the two hosting platforms are implemented in Emergency.lu to deliver the service to the users. The service implementation is however not only relying on the central hosting but on distributed service implementations (Figure 5). Each NoSaCo terminal is integrating a small part of the service allowing a local relay of the service. The direct advantage of this distribution is the possibility for the service to work whenever the satellite connectivity is present or not. A kind of off-line mode is created as a result.
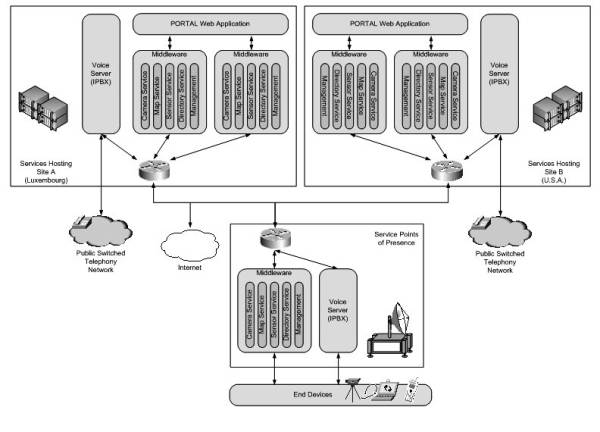
Figure 5: Service Architecture
The services supported and provided are basically:
- Voice communication using SIP based Voice over IP communication: Each Service Hosting is implementing an IPBX with dedicated connection to PSTN and offering a link to small IPBX implemented into the NoSaCo terminals.
- Camera Service: Collection and sharing of imagery and video streams provided by the included cameras or via manual upload.
- Map Service: Repository of tactical maps that can be accessed and drawn by different frontend applications.
- Sensor Service: Collecting, analysing (based on thresholds), storing, and sharing sensor data. Typical sensor information can be gas and pollution concentration, humidity or temperature. This service is also managing the dynamic localisation of entities provided currently by GPS.
- The Directory Service is managing the contact information that is used for voice communication as well as an inventory of devices or components and their logical organisation.
- The Management Service is finally the back end component that is taking care of tracking the other middleware nodes, the auto-configuration and the security of the information.
To ensure a convenient user experience, all services are using a self-discovery concept via IP multicast mechanisms and are directly managing their communication and synchronisation without any intervention from the users.
Layer 3: End devices and services access
To provide an intuitive access to the services, the NoSaCo terminals include a set of equipment that is used to collect information (Video cameras, sensors) or to directly interact with the services (Voice over IP phones, ruggedized computers). These end-devices are pre-configured to work with the NoSaCo terminal and, as a result, ready to operate in any place.
As stated before, the terminal has been implemented in order to facilitate its transportation and make its installation as simple as possible to anyone with a minimum amount of technical knowledge and skills. The use of the service is made as convenient as this, using intuitive, specifically designed applications.
For the usage on the crisis site, the ruggedized computers are equipped with a tactical application that is offering an access to the different services via a touch screen interface (Figure 6). This interface is using the gesture recognition, now popular in the mobile areas and specifically interesting for ergonomics. Touch screen interfaces are facilitating the handling of the applications as no pointing devices like mouse or trackball are required.
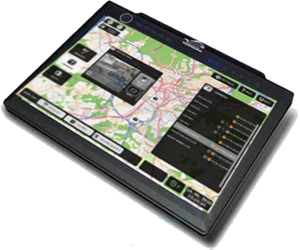
Figure 6: Tactical client Interface
On the other hand, in the crisis center or headquarters, a web portal can be used as user interface (Figure 7). The portal provides access to the same services (Voice, Video, Sensor, Maps and Directory). Relying on Web 2.0 technologies, it can be accessed from different places in the world like in laboratories or crisis rooms in different capitals.
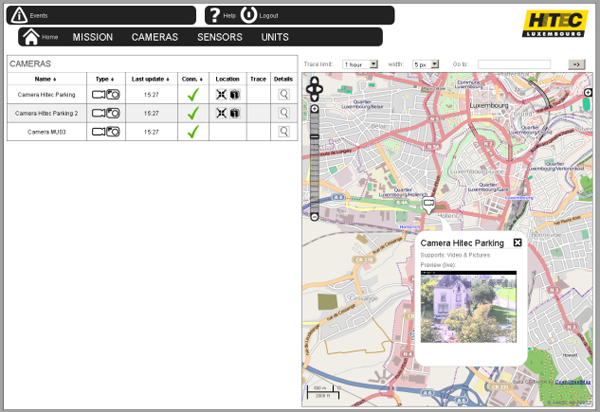
Figure 7: Portal Screenshot
Deployment scenarios and conclusion
As mentioned before, the Emergency.lu approach has been designed with the intention to improve the situation on two main levels: First, reduce the duration of transport of the very first teams to any major crisis scene and second, provide adequate communication means right from the beginning.
To meet these objectives, the consortium has decided to include air transportation in the solution. Through a fleet of LearJet’s, ready to leave Luxembourg within the hour, and with operational and medical staff on a 24 hours a day duty schedule on the airport, Luxembourg Air Ambulance (LAA) can ensure the required reactivity.
Although LAA has over 20 years experience in supporting disaster relief and humanitarian missions with fixed wing and rotor wing aircrafts as well as medical teams, this more global approach requires an impeccable planning involving all the partners. At the airport, a controlled storage is kept constituted by NoSaCo units, food and beverage to guarantee autonomy of the team for 15 days, basic medical supplies for the team and required logistic equipment (i.e. tents, generator).
Frequent trainings, exercises and pre-emptive maintenance are organised to maintain the Emergency.lu platform on a ready to operate status.
Besides the technical readiness, the qualification of personnel involved in these rescue missions is crucial. Procedures have been designed to optimize the collaboration between the different actors, and training is recurrently organised. For an optimal effectiveness of the team, the pilots have been trained to install and operate the NoSaCo installation on site. They are able to give instructions to the local teams and function as on-site support. All team members have received in depth crisis management education and have experience in disaster relief missions.
The emergency.lu intervention team is completed by one or more medical staff , with the primary objective to ensure the medical support for the crew and to support the medical assessment of the situation.
Finally, in best case, the unit is completed with one or more experts for needs assessment assigned by international organisations, i.e. UN (OCHA) or EU (ECHO/MIC). Through the network of partner operators in Europe, LAA can rapidly transport these experts from within Europe not to delay the departure of the mission.
It is very important to point out that the Emergency.lu solution is not intending to replace any existing mechanism or intervention teams, but that it should be seen as a valuable and helpful support. This service is planned to be offered to all international and national organisations. It has to be clearly stated that the solution will work hand in hand with known UN forces.
Once the system is deployed, it can be decided either to dissolve the unit and return to Luxembourg with the equipments, or one can consider building a more permanent communication infrastructure, potentially through an increased amount of NoSaCo units. This last option considers that the effort to support the on-site population in the first hours can also be maintained to assist in the reconstruction of local infrastructures.
PLATON - Trusted Unified Communication & Collaboration (UCC) in health or disaster projects
PLATON - Trusted Unified Communication & Collaboration (UCC) in health or disaster projects
Ingo Liedtke, T-Systems International GmbH, PDC Engineering, Germany
Introduction
Flooding in Benin, Earthquake in Haiti, Cyclone Mick swept over Fiji's main island: humanitarian aid and emergency relief teams are more and more in need of a structured, secure information flow through all phases of the disaster management cycle. Additionally, there has to be a solution to deliver limited specialist resources with a virtual worldwide support. T-Systems PLATON services have a suitable answer.
Disaster management in the future – 5C “Collaboration”
As the latest history has already shown: Disasters are increasing. Due to that more and more qualified specialist resources are required on site as well as in project coordination. In many health and disaster projects uncoordinated processes are posing severe problems. Collaboration across different international institutions and local teams does not work well. The activities are very often lacking in transparency, resulting in decreased efficiency of international team work. That means an unnecessary increase in the need for resources and thus higher costs per saved life . Or, even worse, more time to the real rescue is elapsing.
PLATON Services offer support with a virtual specialist resource. This means that the information flow is structured, transparent and traceable if needed to all participants anytime and anywhere. The virtual “Task Force Disaster“ team can effectively support the local team via video, voice, chat and data.
As the Greek philosopher Platon has astutely observed, “the beginning is the most important part of the work”.
The PLATON system
With PLATON (PLATform for Orchestrated Networks), T-Systems offers an Internet-based platform for collaboration cloud services, including all desired functionalities at the highest security level for worldwide teamwork in real-time. Experts can discuss and work together on e.g. an urgent project issue or even on sensitive patient data from the health care field. Participants collaborate in a closed circle absolutely untroubled in virtually tap-proof project rooms installed separately for every single project through secure interfaces where intellectual property and data integrity are protected by precisely defined access rights.
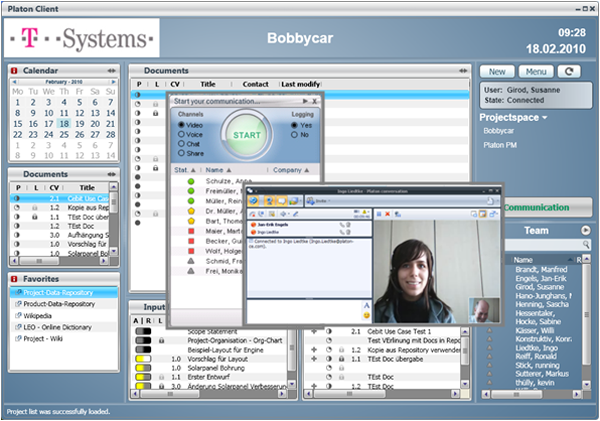
Figure 1: PLATON „virtual“ project room
The advantage of the self-sustaining and secure platform is that the participants in across-company project teams do not have to open their IT systems to each other. Client software with 2-factor authentication on a USB stick with a smart card and a PIN assures secure access of the team members from any place in the world that can be connected to the Internet. All documents, project plans etc. are up to date and seamlessly documented at all times and available for across-continent and across-company project work.
Due to integrated function of Unified Communication and Collaboration (UCC), PLATON users can access all means of communication via their PLATON desktop client, i.e.
- E-mail,
- presence-information,
- data-sharing,
- phone,
- video etc.
to ensure efficient coordination and focused team work.
PLATON automatically updates participants on the current work situation. Ideas, plans and changes can be presented, discussed, modified or discarded without any delay.
Manufacturers and suppliers can communicate necessary product changes instantly, thus speeding up implementation. The virtual meeting room unites team members from different companies and locations in a short time of about 48 h to create real value added networks.
PLATON protects intellectual property and ensures efficient collaboration. PLATON project teams can grow dynamically and change on demand to best suit real-time requirements. This means reduced expenditure of time and resources. The easier it is to quickly integrate different specialists to deal with new project developments, the better the final result. Fewer mistakes mean fewer corrections, less waste, less production downtime and fewer product recalls. T-Systems is prepared to modify the PLATON meeting room to suit individual needs and expert coaches are available upon request.
PLATON – Online surgery for health care and disaster relief
PLATON brings the physician specialist competence to the patient and not vice versa.
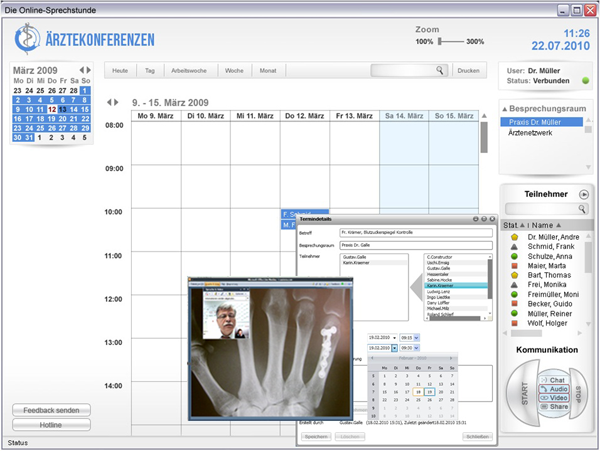
Figure 2: PLATON Health Client “physicians conference - online surgery”
As an example the physician and the patient “meet” each other in a secured, virtual surgery for a video conference. The phyisician takes his data and application and can online discuss the laboratory values, therapy plan modification or X-ray photograph with the patient. The “online-surgery” can be opened for another medical specialist, if a second opinion is needed. They can discuss without media discontinuity and the data does not leave the physician’s PC. The specialist only sees the display of the data. The physicians’ and specialists’ competences can be virtualized and provided in any location, thus easing the communication and saving time and money. Of course the online surgery cannot replace the real surgery, but is in many cases faster and more efficient as usual low-up appointment for a discussion about e.g. laboratory data.
In particular this applies to local disaster situations where specialists are not available on site. With the PLATON services T-Systems can supply a virtual competence center anywhere, anytime, as soon as the internet connection is available on the ground.
PLATON – A new collaborative working model
In a disaster situation the human resources are very likely to be limited and helpful information has to be up-to-date at any location. The PLATON working model supplies the information flow with its structure. Larger data will be sent by an asynchronous process, but is tracked and version-controlled by PLATON. If rapid information is needed, the project members will discuss it via chat in the secure project room with the team members.
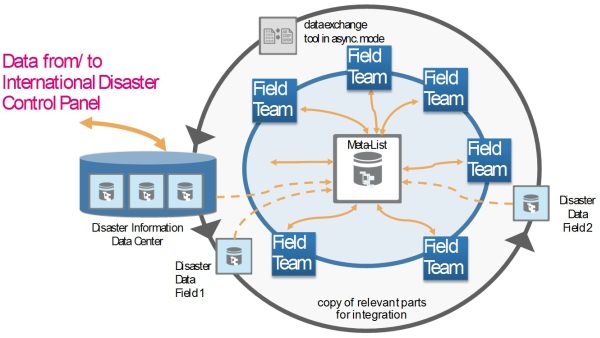
Figure 3: New Collaborative working model - all information flows are encrypted
If certified or uncertified information from the source “crowd” has to be integrated, PLATON can react in a flexible way. As an idea the crowd information will be integrated and structured for example by a data coordinator. This will enhance the quality of information and so the quality of help.
Contact
Ingo Liedtke
T-Systems International GmbH
Systems Integration
Project Delivery Center Engineering
Senior Sales Consultant trusted UCC/PLM
+49 711 972 - 43686 (Tel.)
+49 18053344918366 (eFAX)
+49 160 820 97 43 (Mobil)
E-Mail: ingo.liedtke [at] t-systems.com
Internet: http://www.t-systems.com
https://servicenet.t-systems.de/plm
https://servicenet.t-systems.de/platon
Earth observation and geospatial information in support of risk and disaster management
Earth observation and geospatial information in support of risk and disaster management
Flood hazard assessment with the help of satellite imagery
Flood hazard assessment with the help of satellite imagery
Matthias Zink, Dresden University of Technology
Juan Carlos Villagran de Leon, United Nations Office for Outer Space Affairs, United Nations Platform for Space-based Information for Disaster Management and Emergency Response (UNOOSA/UN-SPIDER)
Introduction
In many cities in developing countries there is a tendency for hazards associated with floods to increase as a consequence of inadequate urbanization processes. Unfortunately, it would seem that the two main driving factors responsible for this increase remain hidden from the view of actors such as developers, individual citizens seeking to establish themselves in urban areas, and city planners. The first factor is the shrinking of the width of channels in rivers flowing through urban areas when owners and developers construct houses and buildings along the shores of rivers at the expense of the channel. The net effect is an increase in the level of water during floods, because there is less space for retention areas. The second factor is the increasing degree of sealing or impermeability of the ground within the basin as a consequence of urban and industrial growth. This sealing of the ground leads to a higher rate of effective runoff, as less precipitation can be stored in the ground.
An important first component of flood management in urban areas is hydrological modeling. However, a typical challenge in the case of developing countries is the modeling of the ongoing hydrological processes with a very limited amount of data. This document presents the results of a case study focusing on the city of San Antonio de Belen in Costa Rica, which was conducted by the authors within the Risk Management Section of the Institute for Environment and Human Security of the United Nations University in 2008 (UNU-EHS). The document presents an example of the use of satellite imagery and aerial photographs to gather information which is essential to generate data that can be used to perform the hydrological modeling needed to explain emerging floods in urban areas due to improperly planned urban growth.
San Antonio de Belen, Costa Rica, and the Quebrada Seca Basin
As one of the municipal districts neighboring San Jose, which is the capital city of Costa Rica; and very close to the Juan Santamaria International Airport, San Antonio de Belen became host to large industrial establishments over the decades, and more recently to residential areas as well. Unfortunately, the decades of improper urban growth and industrialization have led to more frequent and more intense floods.
Figure 1: Aerial view of the city of San Antonio
The river provoking these floods is called Quebrada Seca and it has a watershed area of 20.2 km². While it can be considered a small river, in recent years it has provoked severe floods in San Antonio de Belen. San Antonio de Belen (figure 1) lies on the foothills of two volcanoes, one of them being the headwater of the Quebrada Seca river. So altitudes around 1700 m are dominating the upstream segment of the basin, while lower reaches are located in altitudes around 900 m. With an elongated shape, the length of the watershed is 19.5 km and the mean slope is 5.2%. Furthermore the two upstream river reaches have approximately the same river length of 8.5 km. As a consequence, the respective peak flows may reach the intersection at the same time. Figure 2 shows an overview of the watershed of the Quebrada Seca river.
Figure 2: Watershed of the Quebrada Seca river.
Aerial photography and satellite imagery
A very important parameter related to the infiltration capacity is the type of land-cover. Because land cover information was not available, it was necessary to develop digital land-use maps using existing aerial photographs and recent satellite images. Aerial photographs taken in 1945 represent the situation of the basin before heavy industrialization took place. A satellite image from the year 2005 covering the lower and middle parts of the basin was complemented with Google Earth Images to generate the required information concerning land-cover and land-use. Using land-cover definitions related to the runoff curve number (USDA, 1986), land-cover types were developed for the watershed of the Quebrada Seca. Table 1 shows the definition of land-cover types corresponding to the spatial distribution of single land use classes. These land use classes correspond to those defined in the Curve Number (CN) method. The CN indicates the infiltration capacity of a given type of soil and thus the hydrological behavior of that particular soil. Together with the spatial weights of each land use class, the CN of the different land-cover types can be determined.
To conduct the hydrological modeling, the CN data corresponding to the different soil types had to be determined. The data were gathered from studies which have been conducted by local researchers in this watershed (Arguedas, Campos, & Ballestero, 2002 and Serrano, 2004). The volcanic ashes and sand-dominated region has a high fraction of soils which have a good to moderate permeability for water and clay contents less than 10%. As defined by the United States Department of Agriculture (USDA, 2007), these soils can be classified as type A, which show a good condition for high infiltration capacities. Nevertheless, it is important to keep in mind that there are high slopes in some segments of the watershed and high rain intensities which decrease infiltration and create higher flood potentials.
| Category | Land-Cover Type | Description |
|---|---|---|
| Agriculture-dominated land-cover | Agriculture | 100% crops |
| Agriculture and residential | 90% crops, 10% residential | |
| Greenland and crops | 80% crops, 20% greenland | |
| Agriculture, residential and greenland | 75% crops, 15% residential, 10% greenland | |
| Settlement-dominated land-cover | Low density of settlement | 35% residential, 65% woods and grass |
| Average density of settlement | 50% residential, 40% houses and industries, 9% greenland, 1% streets | |
| High density of settlement | 97% housing and industries, 3% streets | |
| Average density of residential | 70% residential, 20% industries, 9% greenland, 1% streets | |
| Residential | 100% residential | |
| Housing and industries | 100% housing and industries | |
| Natural-dominated land-cover (forests, tree-covered coffee plantations) | Woods and grass | 100% woods and grass |
| Very low density of settlement | 85% woods and grass, 15% residential | |
| Woods and grass, agriculture, residential | 60% woods and grass, 30% crops, 10% residential |
Table 1: Definition of land-cover types within the watershed as well as generalization into three categories of land-cover
Because of the high infiltration capacity of these soils, it can be assumed that the infiltration within the watershed is influenced mainly by two parameters: land-cover and the slope. Thus the determination of the land-cover becomes an important factor in relation to the accuracy of the hydrological model.
The land-cover types were summarized into three categories: agricultural, urban, and natural-dominated, to get a better visualization of the urbanization. The results of the processing of the aerial photographs and satellite imagery are presented in Figure 3 and manifest the large difference in the land-cover regimes between 1945 and 2005. The 2005 land-cover map shows that the watershed is dominated by urban areas. These areas cover 65% of the watershed. In comparison with the map of 1945 the urban dominated area increased to nearly double (increasing of urban area by 48%). The reason for this change has been a process of industrialization in the central part of the basin, (e.g. Bridgestone, Intel, and Coca Cola industrial plants for example) and a more recent urbanization in terms of residential neighborhoods throughout the basin. So, Belen has become one of the most developed municipal districts in Costa Rica. Unfortunately, throughout the decades, local authorities were not aware of the impacts of industrialization and urbanization in the context of floods.
Figure 3: Land-use patterns in the Quebrada Seca basin. The upper map corresponds to 1945, while the lower one to 2005.
With the information on CN values, the HEC HMS software (Hydrologic Engineering Center – Hydrologic Modeling System) was used to generate a rainfall runoff model for the watershed of the river and the HEC-RAS software (Hydrologic Engineering Center – River Analysis System) was employed as a flood routing model within the downtown area of the city of San Antonio de Belen.
Results
The extreme change in the land cover within the watershed leads to the assumption that flood hazard in the downstream segment of the basin is increasing significantly. The simulations done with HEC-HMS prove this hypothesis. Figure 4 shows a comparison of the discharge simulated for both 1945 and 2005, taking as input data the precipitation of 13 July 2007, which generated a flood that lead to severe damages in the city, as well as in other regions of the basin.
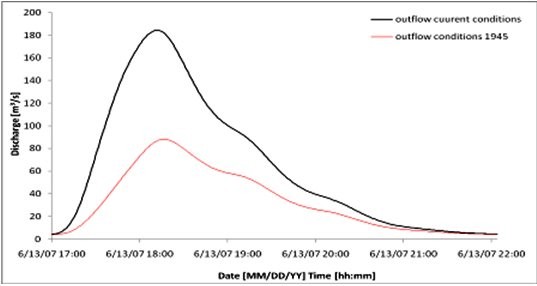
Figure 4: Simulations of discharge using both HEC-HMS and HEC-RAS. The red curve shows the simulated discharge corresponding to 1945, while the black curve shows the simulated discharge for 2005.
The comparison of the peak flows shows an increase from 88 m³/s in 1945 to 184 m³/s in 2005 due to the land cover changes. So the peak flow at this special event has more than doubled. But a much more interesting figure is the amount of water flowing during the flood event. The total amount of floodwater in 1945 would have been around 620,000 m³ while in 2005 it was calculated at 1,190,000 m³.
The increase in discharge is represented in the water levels simulated with HEC RAS as well. As it can be seen in Figure 5, the water level increased at specific cross sections in the downtown area by more than 1.5 m. The selected example shows that the same precipitation may not lead to overtopping of the bank in 1945, while in 2005 it does.
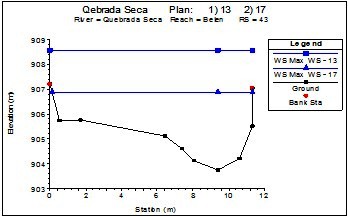
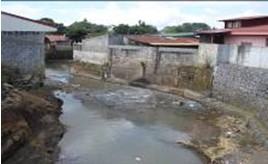
Figure 5: HEC RAS simulation of maximum of water levels at a cross section in the downtown area of Belen. The figure shows the simulation result while the photo shows this cross section as it looked in 2007.
Conclusions
The use of satellite imagery allows scientists to track land-use changes, and to generate quantitative information regarding land-cover that is required to run hydrological models. Without such information, quantitative estimations of the amount of water retained by the watershed itself are nearly impossible. The quantification of impacts of land-cover changes on the hydrological regime are of high interest in the current research. In this context the use of satellite imagery allows scientists to classify land-cover patterns and to quantify areas according to their land-cover type with standard GIS software. Such information can then be used e.g. by hydrologists to run rainfall-runoff models to assess the degree of flood hazard in particular geographical areas thereby helping local authorities and administrations to develop land-use plans in order to avoid the exposure of resources or lives to such floods.
References
- Arguedas, M. H.; Campos, G. L.; Ballestero, C. R.; 2002: Análisis de posibles soluciones al problema de las inundaciones, en el cantón de Belén, producto del desbordamiento de la Quebrada Seca.; Universidad de Costa Rica, Facultad de Ingeniería, Escuela de Ingeniería Civil.
- Serrano, L. S.; 2004: Modelación Hidráulica de la Quebrada Seca para el Control de Inundaciones en el Cantón de Belén; Universidad de Costa Rica, Facultad de Ingeniería, Escuela de Ingeniería Agrícola.
- United States Department of Agriculture (USDA); 1986: Urban Hydrology for Small Watersheds TR-55, Natural Resources Conservation Service.
- United States Department of Agriculture (USDA); 2007: National Engineering Handbook, Hydrologic Soil Groups; Natural Resources Conservation Service.
- US Army Corps of Engineers; 2000: Hydrologic Modeling System HEC-HMS, Technical Reference Manual; Hydrologic Engineering Center.
- US Army Corps of Engineers; 2008: Hydrologic HEC-RAS River Analysis System, Hydraulic Reference Manual; Hydrologic Engineering Center.
A prototype design for a Web-GIS disaster support system: The Bolivia Amazon case study
A prototype design for a Web-GIS disaster support system: The Bolivia Amazon case study
Vicente García García, Humberto L. Perotto-Baldivieso, Stephen Hallett
Natural Resources Department, Cranfield University, United Kingdom
Introduction
Frequency and severity of natural disasters are reportedly increasing worldwide, partially due to population increase and increasing concentration of populations in hazard-prone environments (1). Their effects are related to the vulnerability of the affected area and the proximal human population (2). Flooding is one of the most serious and common natural disasters. Flooding statistics show how in the last 20 years there have been more than 2,800 flooding events with over 2,000,000,000 people affected and over 190,000 people killed (Table 1).
| Number of flood events | 2,887 |
| Number of people killed | 195,843 |
| Average number of people killed per year | 6,753 |
| Number of people affected | 2,809,481,489 |
| Average number of people affected per year | 96,878,672 |
Table 1: Flood statistics (1980 – 2008) (3)
Geospatial data can be used to develop analytical modelling, risk mapping and vulnerability area mapping as well as to support and execute emergency response plans. Morover, GIS can serve as a spatial inventory system for coordinating recovery activities (4), (5).
Although GIS and spatial data play an important role in disaster management, data formats and data standards can also prove a limiting factor in the deployment of GIS infrastructure. The number of organizations, agencies and private companies around the world that produce and use spatial data (geospatial data) is continuously increasing; therefore there is a need for GIS interoperability to share geospatial data, services and functionality (6). An effective strategy to achieve the GIS interoperability is by creating a Spatial Data Infrastructure (SDI).
SDI is defined as the combination of technology, policy and institutional arrangements that facilitate the availability and access to spatial data. SDI provides a basis for spatial data discovery, evaluation, and application for users and providers within all levels of the government, the commercial sector, the non-profit sector, the academic sector, and by the public(7). SDI as an information infrastructure can help by providing spatial data and supporting decision-making for disaster management. Designing an SDI model for a disaster management, utilizing important spatial data, non-spatial, semantic data, associated metadata and communication technologies (ICT) in disaster management can improve decision-making and increase the efficiencies and effectiveness of all level of disaster management activities from mitigation to preparedness, response and recovery phases (8).
The use of Web-based platforms for SDI provides the capability of delivering GIS information and functionality to a wide number of users via the Internet. A recent development is the increasing deployment of Free or Open Source GIS tools (FOSS-GIS). In adopting FOSS-GIS, users do not need to have proprietary GIS software installed, thereby reducing software costs and software installation troubles. In applications such as disaster magagement the use of Web-based GIS tools can prove extremely effective. Such a prototype ‘platform’ can comprise components which include a Web server (eg. Apache), as well as the software for publishing spatial data and interactive mapping applications to the Web. Given the wide number of FOSS-GIS server applications and GIS platforms now available, there is a need to assess their feasibility for disaster management applications in areas where data standards can be a limiting factor.
Bolivia is subject to periodical flooding in the tropical lowlands (on the eastern plain, or “Llanura oriental”) and every year there are signigificant losses in livestock and property. Most of the water that floods the “Llanura oriental” originates from the valleys and mountains in the upper reaches of the Amazon watershed. The first two floods to be widely documented using GIS and remote sensing were the flooding events of 2007 and 2008 (9). Data for these events is made publicly available at the Bolivian Natural Resources Digital Center (BNRDC, http://essm.tamu.edu/bolivia). The first SDI with standardized formats for Bolivia was created by the BNRDC in 2004. Data was formatted and prepared to meet scale and projection standards at the national level using the Bolivian legal framework. Since this time, the BNRDC has provided the most comprehensive repository for spatial data at the national level. Data offered by BNDRC includes social (e.g. infrastructure, political boundaries) and natural (e.g. ecosystems, soils, digital elevation models) spatial information and it is made available to the public at no cost. However, data is managed in a GIS-native format and therefore the use may be limited to users with relevant GIS experience.
The idea of developing a prototype for a Web-GIS disaster support system therefore emerged as a means to combine the existing SDI with contemporary Web-GIS developments for the design and implementation of spatially explicit online decision support systems for disaster management. This paper presents the development of an online disaster support system designed to provide key information to end-users and policy makers where a massive flood event is occurring or has occurred. The specific project objectives were firstly to evaluate the applicability of different Web-GIS platforms for the implementation of the disaster support system, and secondly to assess its acceptance among scientists, decision makers, and the general public.
Methodology
Case Study and Data collection
The 2007 and 2008 floods in the Bolivian Llanura oriental were chosen as a suitable case study for the development of a prototype disaster support system, given the extensive data available for these events, and the willingness of the Bolivian Natural Resources Digital User Group to participate in an applicability survey, conducted via an online questionnaire. Data used in this project was provided by BNRDC in ESRI Shapefile format (10). The spatial data available on BNRDC is in a geographic coordinate system WGS84 (decimal degrees latitude, longitude). Data provided was divided into five categories: administrative (departments, provinces, municipalities and department capitals), infrastructure (hospitals, airports, harbours, primary roads, and railways), natural spatial data (rivers, geology, protected areas, and watershed information) and flooding data (2007 and 2008 flooding, potential floods areas and potential draught areas).
Platform selection and platform design
The system platform selected for the disaster support system was based on the choice of the Web client for the Web-GIS. The Web client provides the interface that allows the users to visualize, navigate and analyze the geospatial data via the Web. We selected three Web clients to test the online disaster support system, namely: ‘p.mapper’, ‘OpenLayers’ and ‘Chameleon’ (11). The selection of the Web client was based on the following criteria:
- Free or open source software (FOSS);
- Quality of navigation tools provided;
- Management tool provided for hierarchical layer management;
- Capabilities of query and measurement tools;
- Capabilities for scale management and search functionality;
- Ease of interface customization, plug-ins and functions compatibility;
- Programming languages supported;
- Established community of users and developers;
- Support for the OGC-compliant services, WMS and WFS; and
- Data interoperability (vector, raster, PostGIS).
Based on the above criteria, p.mapper was selected as it meets the majority of the requirements, and a prototype tool was developed, a detailed explanation of which is presented in the results section below. The p.mapper server is a MapServer application based on PHP/Mapscript. The freely available MapServer for Windows package (MS4W) was selected, installing the pre-configured Web server environment required to establish a p.mapper application (comprising the Apache Web server, MapServer, PHP, Mapscript, and the Geospatial Data Abstraction Library, or GDAL). Once installed MS4W provides the possibility for updating individual components without affecting or modifying the rest of the installed applications – a concern for managing ongoing support for such an application platform.Once MS4W was established, the object-relational database system PostgreSQL and its extension PostGIS was also installed to provide the underlying data repository for the platform. A key stage then involved the conversion and export of the Bolivian geospatial data, from shapefiles, into the PostGIS database format. Finally the p.mapper application was customized to meet the needs of the prototype (Fig. 1).Detailed information about the development of the Web-GIS platform is provided by (12).
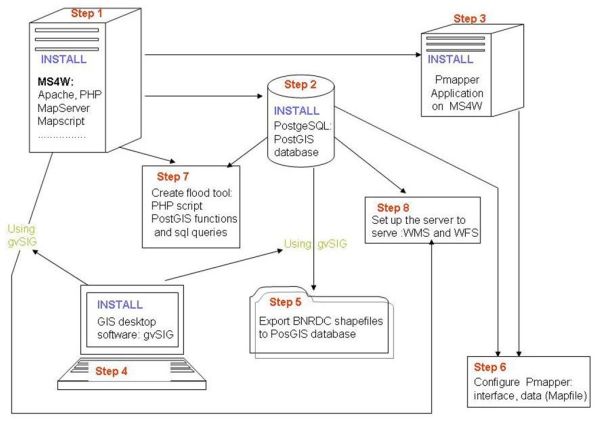
Figure 1: Platform design for the disaster support system prototype.
User group acceptance
The finalized Web-GIS prototype (http://ccmap-dmz.dmz.cranfield.ac.uk/index.phtml) was next presented to the BNRDC user group who were then able to provide feedback via an online questionnaire (12). The questionnaire adopted was divided into 6 sections and totalling 23 questions. The questions were categorised as: general overview; tools; symbology and legend; map; download and print; and conclusions and recommendations, with respondees being invited to complete a questionnaire reflecting their experience of running the prototype. Scoring for each question ranged from 1 (being very poor) to 5 (being excellent). Questionnaire results were analysed and interpreted using boxplots (13).
Results
Platform selection and platform design
The p.mapper tool was selected as a Web client as it was found to address substantially the technical requirements of the prototype. A comparative review between p.mapper and the other comparable FOSS tools Chameleon and OpenLayers is reported in Table 2. Some of the main characteristics that defined the choice for the final selection include:
- Significant number of navigation tools: ease of ability to zoom in, zoom out, select full extent, pan forward and backward, and zoom to selected points;
- Information tools: strength of layer attribute queries;
- Area and distance measurements;
- Bookmarking and selection tools;
- Data export reporting (e.g. pdf file production) and printing tools;
- Hierarchcial layer arrangement and layer visualization;
- Interface customization; and
- Access to open source software.
| Web client | Program. language | Data support | OGC support | Server dependency | Nav. control tools | Layer info tools | Search tools |
|---|---|---|---|---|---|---|---|
| Chameleon | Javascript; PHP | PostGis Web Map Context | WMS | Yes UMN MapServer | good | some problems | good |
| p.mapper | Mapscript; PHP | PostGis Shapefile Tiff ECW | WMS; WFS | Yes UMN MapServer | very good | very good | very good |
| OpenLayers | Javascript | GML, KML, Shapefile | WMS; WFS | No | good | no | no |
Table 2: Technical Characteristics API
The software selected to implement the Web component was MapServer because the p.mapper application is complementary to MapServer. Map Server was integrated with the installation of the Apache HTTP Server. Once the system was established, it was made publicly available online via Cranfield University’s Web servers (http://ccmap-dmz.dmz.cranfield.ac.uk/index.phtml) (Fig. 2).
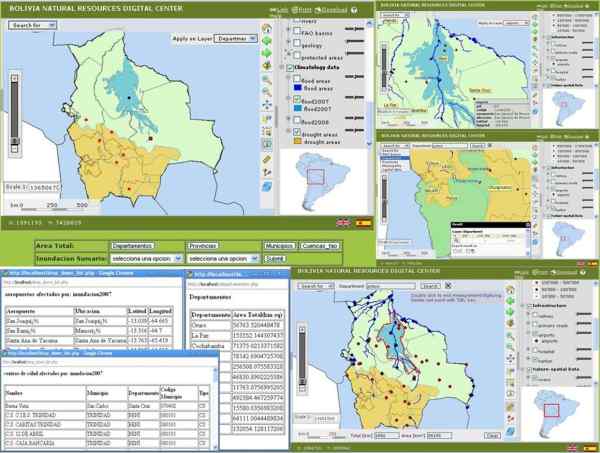
Figure 2: Disaster Support System Web-GIS application finalized. The screens portray several snapshots of the flooding management support system in Bolivia.
In this Web-GIS users are able to navigate through the data with the zoom and pan tools, select features, extract information from the features, export data, print the map, analyse and interpret the data, search for attributes and obtain information about the spatial parcels affected by the floods.
User group acceptance
A total of 23 BNRDC users provided feedback via the online questionnaire. The median answer across the questionnaire for all questions was found to be equal or greater than 3, indicating a general positive acceptance of the Web-GIS platform used as a flooding support system. Questions relating to the ease of use of the interface, the speed of use, and the overall appearance had medians equal or greater to 3 with the highest scores given to the graphical interface and general appearance of the user interface (Fig. 3).
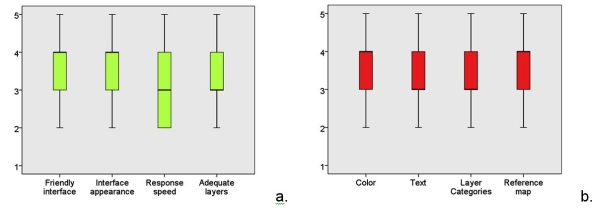
Figure 3: User response box plots summarising acceptance questionnaire results for (a) General overview, and (b) Lay out. Note, values in the Y axis represent the degree of acceptance with 1 being very poor and 5 being excellent.
Download and printing capabilities received average scores while most display tools received average to good scores. Map composition capabilities and expectations received good scores. Most users who participated reported themselves as satisfied with the interface and several suggestions were proposed to improve the Web-GIS platform. Overall satisfaction scores indicate that 22 % of the users were not satisfied with the application, 59 % were satisfied and 18% were very satisfied.
Discussion and Conclusions
The selection criteria adopted for identifying the component parts of the prototype platform were based on the provision of powerful tools for Web-GIS disaster management and decision support. The platform selection was based primarily on the Web client interface. A comparison and evaluation was conducted for three Web client platforms, namely: Chameleon, p.mapper, and OpenLayers. Whilst the first two possess some similar features (MapServer dependency, PostGIS data and WMS support, open source) and have a significant number of users and developers, it was concluded that p.mapper offered more possibilities with user on-screen navigation, and data query tools, as well as more advanced layer management options and wider data support formats. One of the limitations observed is that when customizations were required in the interface, a medium level of knowledge in PHP and Javascript was required, thus making the process more complex.
The questionnaire proved a useful tool in assessing the acceptance and overall satisfaction of the users who tested the prototype. The results indicated medium to good acceptance overall, together with feedback that provided important information for future improvements to the disaster support system. An important aspect observed among the participants is that most of them were looking for information beyond solely the map. Tools used to analyse and gather information were ranked very high in acceptance scores, indicating that users were seeking more than just mapping functionality. Users were seeking the means to quantify the infrastructure impacted by the flooding as well as identifying available infrastructure and they were using the full potential of the GIS tools offered in order to assess the damage and seeking then to use the information to develop informed decisions. Some of the feedback provided by the BNRDC user group included a clear operational requirement for the future use of remote sensing data with real or near-real time satellite information to assess the progress of floodings. Future developments in this area will include the integration of raster formats in the disaster support system presented here.
The Web-GIS platform p.mapper was selected as the mapping engine as it satisfied best the operational criteria. The questionnaire results provided key insights as to stakeholder requirements for receiving spatial displays and maps, as well as to the infrastructure information required in order to develop effective, time bound strategies for disaster management. The final prototype system exhibits several advantages for its ongoing implementation. Firstly, it does not require specialist software such as GIS to be pre-installed on user computers. Secondly, it adopts open-source ‘FOSS’ software tools, which reduce significantly the costs of implementation. Thirdly, it can operate with both vector and raster spatial data formats, making its integration with wider raster models and future satellite imagery possible. Key user feedback suggested the need for future integration of Aster DEM datasets and real time or near-real-time satellite imagery. The approaches adopted are consistent with such future enhancement and were also found to have relevance in addressing other disaster management application themes such as droughts and landslides, as well as other wider areas, such as management of biodiversity and conservation monitoring.
References
- S. Cutter, and C. Emrich, Are Natural Hazards and Disaster Losses in the U.S. Increasing? EOS/Transactions of the Amer. Geophys. Union 86, 381–396 (2005).
- M. Hussain,M. H. Arsalan, K. Siddiqi B. Naseem, and U. Rabab, Emerging Geo-Information Technologies (GIT) for Natural Disaster Management in Pakistan: an Overview. Recent Advances in Space Technologies, 2005, 487 – 493 (2005).
- EM-DAT, The OFDA/CRED International Disaster Database, Université Catholique de Louvain, Brussels, Belgium (2008).
- FEMA - Federal Emergency Management Agency, Information Technology Architecture, Version 2.0 – The road to e-FEMA (Volume 1), Washington, U.S.A. (2001).
- T. J. Cova, GIS in Emergency Management, in Geographical Information System: Principles, Applications, and Management (P.A. Longley, M.F. Goodchild, D.J. Macguire, D.W. Rihind, Eds.) Jonh Wiley & Sons, New York, p.p. 845-858 (1999).
- OGC, OpenGIS Web Map Server Cookbook Version 1.0.2, Open Geospatial Consortium Inc. http://portal.opengeospatial.org/files/?artifact_id=7769 (2004).
- GSDI, the SDI cookbook, http://www.gsdi.org/docs2004/Cookbook/cookbookV2.0.pdf (2004).
- A. Rajabifard, A. Mansourian, M. J. V. Zoej, and I. Williamson, Developing Spatial Data Infrastructure to Facilitate Disaster Management. In proceeding of GEOMATICS83 6 p. (2004).
- MDRAyMA Ministerio de Desarrollo Rural, Agropecuario y Medio Ambiente., Mapa de Areas y Predios Afectados por las Inundaciones de La Niña 2007- 2008 (2008).
- CDRNB - Centro Digital de Recursos Naturales de Bolivia, http://essm.tamu.edu/bolivia/ (2004).
- MapTools, http://www.maptools.org (2010).
- V. García García, A Prototype Design for a Web-GIS Disaster Support System: The Bolivia Amazon Case Study, M.Sc. thesis, Cranfield University, Cranfield, U.K. (2010).
- R.L. Ott, An Introduction to Statistical Methods and Data Analysis. Belmont, CA: Duxbury Press (1992).
Contact
Humberto L. Perotto-Baldivieso
Natural Resources Department
Cranfield University
Cranfield, MK43 0AL
United Kingdom
(T): + 44 1234 750111
(F): + 44 1234 752970
(E): h.perotto [at] cranfield.ac.uk
Earthquake emergency preparedness in Central-Hungary - Preparing rapid response measurements using Remote Sensing and GIS-methods
Earthquake emergency preparedness in Central-Hungary - Preparing rapid response measurements using Remote Sensing and GIS-methods
Barbara Theilen-Willige, TU Berlin, Institute of Applied Geosciences, Department of Hydrogeology, Germany
Helmut Wenzel, VCE Holding GmbH, Vienna, Austria
Introduction
As prerequisite for earthquake emergency planning there is a strong need to improve the systematic, standardized inventory of areas that are more susceptible to earthquake ground motions or to earthquake related secondary effects such as landslides, liquefaction, soil amplifications, or compaction. A uniform data base with a common set of strategies, standards and formats should be implemented. The evaluation of satellite imageries, digital topographic data and open-source geodata can contribute to the acquisition of the specific tectonic, geomorphologic / topographic settings influencing local site conditions.
GIS is used as a tool to represent the earthquake hazard parameters as far as possible - in the form of geographical maps, which is most useful for government agencies, non-governmental organizations, business communities and public when planning emergency preparedness and hazard management.
Earthquakes in Hungary
Seismicity in Hungary is relatively low comparing to the adjacent areas. However, magnitude 6.0-6.5 earthquakes are documented. Fig.1 shows the distribution of earthquake epicentres in Central-Hungary, emphasising earthquakes with magnitudes M > 4. As cities and settlements, infrastructural facilities, and numerous industrial plants are concentrated along the Danube river, the necessity of earthquake awareness and preparedness is evident.
Earthquake hazards in Hungary mainly occur due to
- ground shaking
- soil amplification because of local site conditions
- liquefaction and compaction
- landslides
- movements along active fault zones and aseismic movements in the subsurface (horizontal and vertical).
It has been observed that at many sites surface motions are influenced primarily by the internal conditions within the top 20-30 m sub-surface layer. These conditions influence amplitude, frequency and duration of ground motion at a site. Local site conditions play an important role when considering earthquake shaking and damage intensities and their local variations: The ground-shaking during an earthquake predominantly depends on factors such as the magnitude, properties of fault plane solutions, the distance from the fault and local geologic conditions. The most intense shaking experienced during earthquakes generally occurs near the rupturing fault area, and decreases with distance away from the fault. Within a single earthquake event, however, the shaking at one site can easily be stronger than at another site, even when their distance from the ruptured fault is the same. The variability in earthquake-induced damage is mainly determined by the local lithological properties, thickness of the soil and lithologic unit layer, by hydrogeological and by geomorphological conditions (Fig.2).
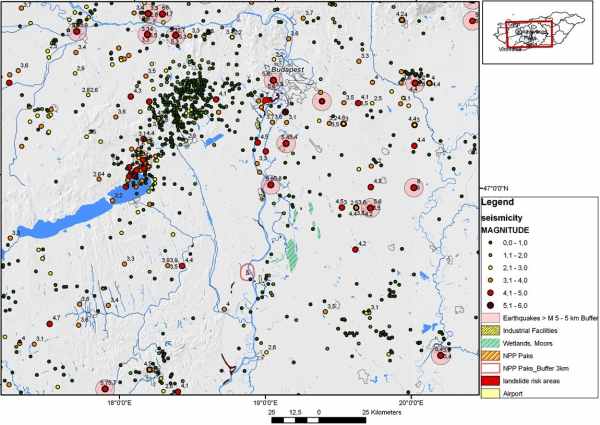
Figure 1: Seismicity in Central-Hungary
Earthquake data: ISC, World Stress Data, BGR, GeoRisk, ZAMG, GFU, USGS
Groundwater level variations and associated saturation changes in sand layers within near-surface aquifers can influence local response spectra of the ground motion, through modification of shear-wave velocity. Changes of the groundwater level can also have a considerable influence upon the liquefaction potential of a region due to to in-situ pore-water pressure responses in aquifers triggering mechanism of liquefaction during earthquakes (1). Liquefaction that affects the human-built environments is mostly limited to the upper 15 m of soil.
As a prerequisite for earthquake preparedness a detailed inventory of sites more susceptible to earthquake damage and to earthquake related secondary effects due to local site conditions has to be prepared.
Data and Methods
GIS integrated geodata analysis can be used to visualize factors that are related to the occurrence of higher earthquake shock and / or earthquake induced secondary effects, such as lithology (loose, unconsolidated sedimentary covers), faults, steeper slopes (landslide susceptibility) or higher groundwater tables (Figure 2).
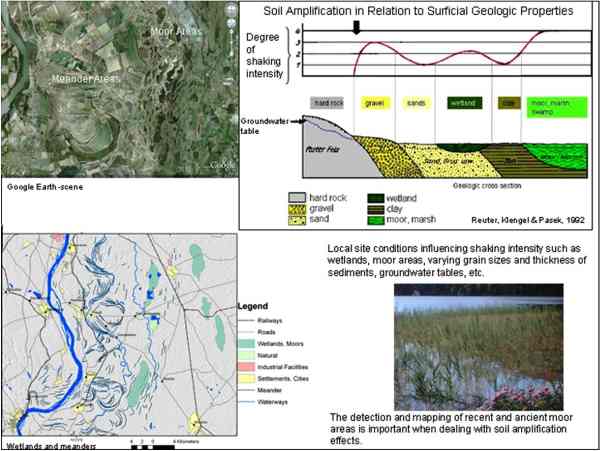
Figure 2: Local site conditions influencing ground motion such as wetlands and unconsolidated, sedimentary covers (Loose soils can amplify and prolong shaking)
Digital Elevation Model Data (DEM)
When searching for areas susceptible to soil amplification, liquefaction or compaction the so called causative or preparatory factors have to be taken into account such as height levels, slope gradients, terrain curvature, lithologic conditions and faults zones (3). Morphometric maps (slope gradient maps, drainage,etc.) derived from SRTM and ASTER DEM data are combined with lithologic and seismotectonic information in a GIS data base. Some of the causal factors can be determined systematically: From slope gradient maps those areas with the steepest slopes are extracted, and from curvature maps the areas with the highest curvature, as these are more susceptible to landslides. Height level maps help to detect topographic depressions covered by more recently formed sediments, which are usually linked with higher groundwater tables. In case of stronger earthquakes those areas often show the highest earthquake damage intensities. From ASTER DEM data the flat areas with no curvatures of the terrain and low to no slope gradients and the lowest areas are extracted (Fig.3).
An important step towards susceptibility mapping is the weighted overlay method in ArcGIS as the influence of the various factors on earthquake ground motion is different (Fig.4). The influence of the causal or preparatory factors can vary for example due to seasonal reasons. E.g., in very hot and dry seasons the risk of liquefaction or landslides is generally lower than in spring times.
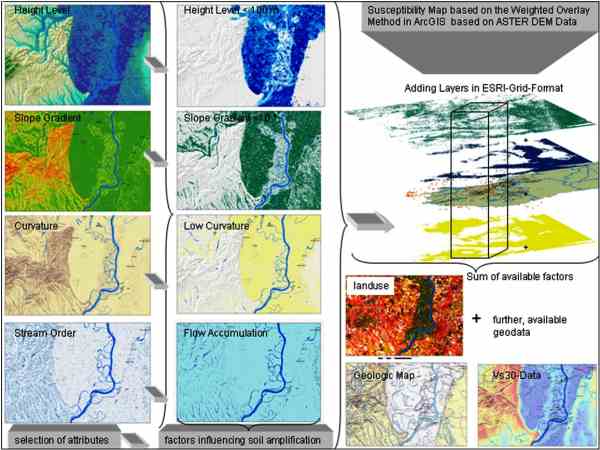
Figure 3: Extraction of causal or preparatory factors influencing earthquake shock
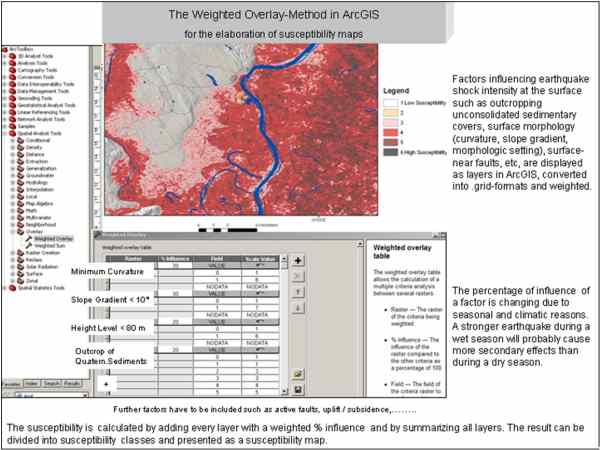
Figure 4: The Weighted Overlay approach in ArcGIS
Satellite Imagery
RapidEye- and LANDSAT-data are used as a further basic layer in the earthquake GIS, e.g. for the elaboration of actual land use maps (Fig.5). Some data layers, such as land use and forests, are dynamic in nature and need to be updated frequently. For disaster preparedness it is necessary to have a detailed and up-to-date documentation of settlements, infrastructure, industrial facilities etc. that might be exposed to earthquake and other hazards, especially with regard to their different exposure to soil amplification, landslides or active tectonic processes. RapidEye images serve as georeferenced data base for the mapping of landslide areas, wetlands and bogs.

Figure 5: Supervised classification of RapidEye data
Environmental changes have also to be considered when dealing with emergency planning. Figure 6 shows LANDSAT scenes from 1987 to 2010 visualizing environmental changes in land use such as growth of settlements and newly built roads, or flooding events due to flash floods after heavy rain falls. Central-Hungary was prone to extended flooding in May 2010. When planning evacuation routes, roads exposed to flooding have to be known and in case of flooding alternative routes have to be arranged. Fig. 7 visualizes the roads situated below 80 m height level that are susceptible to flooding.
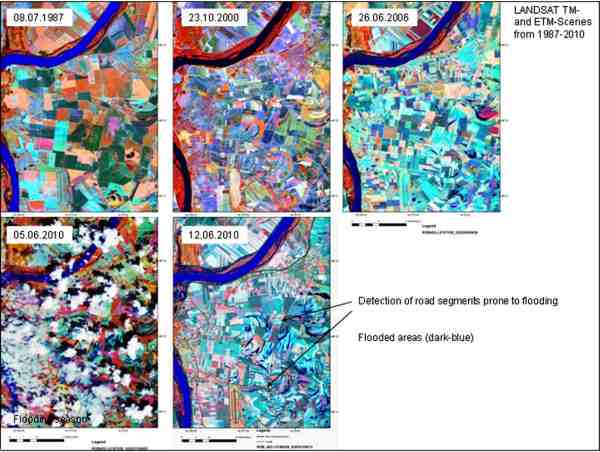
Figure 6: Environmental changes documented by LANDSAT scenes from the area east of Paks
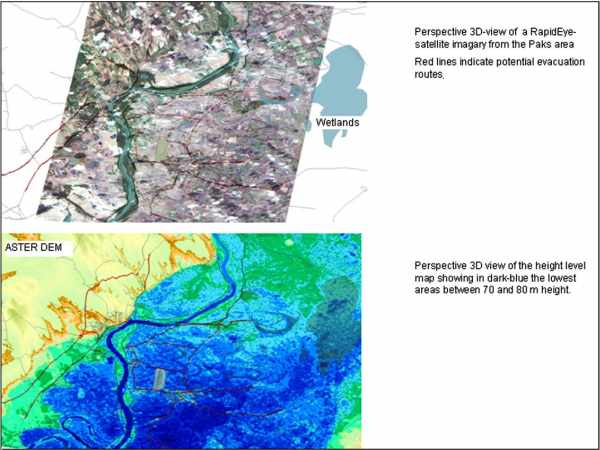
Figure 7: Roads susceptible to flooding
Contribution of Satellite Data to Emergency Preparedness
Analysis of satellite data can contribute to the assessment of potential areas of higher earthquake damage: When combining the results of the weighted overlay-approach (i.e. summarizing the factors with influence on earthquake shock) with high resolution satellite data a better understanding and visualization of differences can be achieved, allowing the identification of “islands” of higher earthquake damage risk (2, Fig.8).
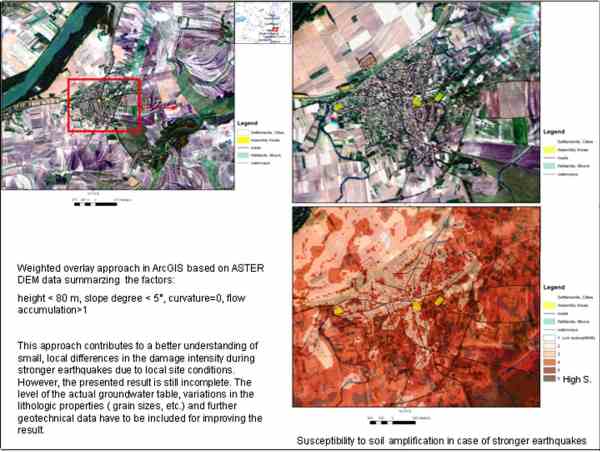
Figure 8: Combining RapidEye satellite imageries with the weighted overlay results
A major emergency preparedness and management demonstration is planned for May 2011 in Hungary, as part of a large collaborative EU-FP7 funded research project (Integrated European Industrial Risk Reduction System, IRIS). The framework for the IRIS demonstration comprises a large civil protection exercise based on innovative information collection and risk assessment. The entire data sets will be managed by a GIS program. A simulation based on the MAEViz software will be performed. It allows setting an earthquake scenario and computing the consequences. The output is a map showing the expected extent of damage to the constructed infrastructure. With this information priorities for the civil protection forces can be set. This information will create an updated emergency plan for the civil protection forces.
The exercise is designed as well to show how satellite images can improve civil protection measures in case of large scale disasters. It is planned to set markers which will subsequently be identified in Rapid Eye images on a daily basis. This will allow creating an up-to-date overview on the dimension of a potential disaster and provide the basis for an updated mitigation plan. It is intended to invite international participants and guests from all over Europe in order to demonstrate the technology and receive feedback on a high level.
A proposal to support the preparation of this demonstration was accepted by the German Aerospace Center (DLR). Within this proposal RapidEye satellite data with a spatial resolution of 5 m are provided, covering Central Hungary along the Danube River from north to south. Strategic databases are created: Data for hospitals and health centers, schools, governmental buildings, police, fire stations, industrial buildings, gas stations and infrastructure data are collected and stored as shapefiles in the GeoInformation System, as well as geological maps, earthquake and seismotectonic data. Fig.9 presents as example a map with a “distance to the next hospital”- calculation.
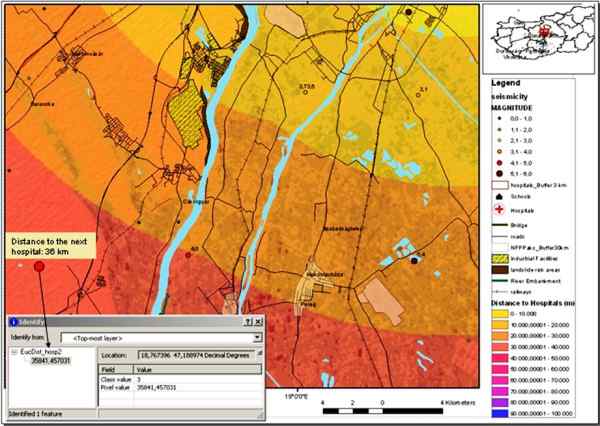
Figure 9: Calculation of the distance to the next hospital
Acknowledgments
The support of EU, FP 7, Large Collaborative Research Project, IRIS – Integrated European Industrial Risk Reduction System, CP-IP 213968-2, is kindly acknowledged.
References
- Hannich,D., Hötzl, H. & Cudmani,R., Einfluss des Grundwassers auf die Schadenswirkung von Erdbeben – ein Überblick. Grundwasser,Vol.11,4, 286-294 (2006).
- Theilen-Willige,B. and Wenzel,H., Local Site Conditions influencing Earthquake Shaking Intensities and Earthquake related Secondary Effects - A Standardized Approach for the Detection of Potentially Affected Areas using Remote Sensing and GIS-Methods. 10. Forum Katastrophenvorsorge, Katastrophen – Datenhintergrund und Informationen UN Campus, Bonn, 23. - 24. November 2009 (2009). http://213.23.39.218/download/forum/10/TheilenWillige_Wenzel_ExtAbst.pdf
- Theilen-Willige,B., Detection of local site conditions influencing earthquake shaking and secondary effects in Southwest-Haiti using remote sensing and GIS-methods, Nat. Hazards Earth Syst. Sci., 10, 1183–1196, 2010, www.nat-hazards-earth-syst-sci.net/10/1183/2010/, doi:10.5194/nhess-10-1183-2010
http://www.nat-hazards-earth-syst-sci.net/10/1183/2010/nhess-10-1183-2010.pdf
Interoperability - A key requirement for emergency and disaster management
Interoperability - A key requirement for emergency and disaster management
Athina Trakas, Director, European Services, Open Geospatial Consortium (OGC)
(Note: Portions of this paper are excerpted from a longer paper by Mark Reichardt, President & CEO, OGC, titled “Open standards-based geoprocessing Web services support the study and management of hazard and risk,” submitted for publication in the Geomatics, Natural Hazards and Risk Journal.)
Introduction
In recent years, providers of geospatial software and online services – GIS, Earth imaging, navigation, location services, map browsers, etc. – have implemented interfaces and encodings based on a robust framework of open geoprocessing and sensor web enablement standards developed by the OGC. The OGC is an open, consensus-based standards development organization. Products and services implementing these standards are coming into wide use in domains such as ocean observation, defense and intelligence, and civil protection, and they are beginning to be used in many other domains, including emergency and disaster management. Some of the OGC members who are involved with emergency and disaster management are working to advance the use of these standards in applications that also involve new computing models like cloud computing.
This article provides information about the relevant standards used in emergency and disaster management, a list of OGC interoperability initiatives to illustrate the value of open standards in studying and managing natural risks and hazards, and a short introduction to the OGC Emergency and Disaster Management Domain Working Group (E&D DWG).
Cooperation between the geospatial community and the science community is particularly important in studying natural hazards and risks, because observations from multiple disciplines and multiple data collection activities need to be considered together. Arguably, all disciplines that produce and use geospatial data have a need for more data sharing and collaboration. Standardization is a key factor for accessibility of data. It is the definition and adoption of common interfaces and encodings that enables interoperability.
OGC Standards
Twenty-eight member-approved OGC standards are currently available. The summary descriptions of some OGC standards below provide the current scope:
- The OGC® Web Map Service Interface Standard (WMS) provides a simple HTTP interface for requesting geo-registered map images from one or more distributed geospatial databases. A WMS request defines the geographic layer(s) and area of interest to be returned as one or more geo-registered simple map images (JPEG, PNG etc.) that can be displayed in a browser application. The interface also supports the ability to specify whether the returned images should be transparent so that layers from multiple servers can be visually overlaid.
- The OGC® Web Feature Service Interface Standard defines the interface to a data access service that enables features from multiple feature collections (as in a vector GIS) to be queried and managed using HTTP. It additionally defines operations that enable clients to discover feature collections available through the service, access features and their attributes, and enable editing, locking and a range of operations against features and attributes.
- The OGC® Web Coverage Service Interface Standard (WCS) defines a standard interface and operations that enables interoperable access to geospatial "coverages". The term "grid coverages" typically refers to content such as satellite images, digital aerial photos, digital elevation data, and other phenomena represented by values at each measurement point.
- The OGC® Geography Markup Language Encoding Standard (GML) defines a data encoding in XML for geographic data and a grammar to express models of such data. Clients and servers with interfaces that implement the OGC WFS standard read and write GML data. GML is also an ISO standard (ISO 19136:2007). Styling and data schema are clearly separated.
- The OGC® Symbology Encoding Standard (SE) defines an XML language for styling information that can be applied to digital geographic feature and coverage data.
- The OGC® KML Interface Standard, brought into the OGC by Google, is a language for geographic visualization, including annotation of maps and images. Geographic visualization includes not only the presentation of graphical data on the globe, but also the control of the user's navigation in the sense of where to go and where to look. KML is complementary to most of the key existing OGC standards including GML, WFS and WMS.
The full set of OGC standards, including Sensor Web Enablement (SWE) standards described below, along with reference models, standards profiles, public engineering reports, best practices documents, discussion papers and white papers are available at http://www.opengeospatial.org/standards.
A Glossary of Terms is available at http://www.opengeospatial.org/ogc/glossary/.
OGC Sensor Web Enablement (SWE) Standards
Most geospatial data is created by means of sensing and measurement devices (gauges, satellite-borne imaging cameras etc). Most sensors have a location that is pertinent to the sensor’s purpose. For these reasons, OGC members have developed a set of “Sensor Web Enablement” (SWE) standards that provide a Web services framework for working with sensors and sensor data. The following descriptions of some of these standards provides a sense of the scope of this set of free and open resources for the emergency and disaster management community:
- The OGC® Sensor Model Language (SensorML) Encoding Standard defines the general models and XML encodings for sensors. SensorML enables:
- Discovery, processes and plug-and-play operation of sensors. SensorML is the means by which sensors and processes make themselves and their capabilities known, describe inputs, outputs and taskable parameters.
- Observation lineage. SensorML provides history of measurement and processing of observations and supports quality knowledge of observations.
- On-demand processing. SensorML supports on-demand derivation of higher-level information (e.g. geolocation or products) without a priori knowledge of the sensor system.
- Intelligent, autonomous sensor network. SensorML enables the development of taskable, adaptable sensor networks, and enables higher-level problem solving anticipated from the Semantic Web.
- The OGC® Observations and Measurements (O&M) Encoding Standard defines the general models and XML encodings for sensor observations and measurements.
- The OGC® Sensor Observation Service (SOS) Interface Standard provides an open application programming interface (API) for managing deployed sensors and retrieving sensor data and specifically “observation” data.
- The OGC® Sensor Planning Service (SPS) Interface Standard provides an open application programming interface (API) for a service by which a client can determine the feasibility of collecting data from one or more mobile sensors/platforms and submit collection requests to these sensors/platforms.
Examples of projects using OGC standards
Taiwan Debris Flow Warning System
A scenario in the 2008/2009 OGC Web Services 6 (OWS-6) Testbed activity involved an actual implementation of SWE standards in Taiwan and chained Web services in a working debris flow monitoring system. In parts of Taiwan - due to the steep terrain, severe weather (frequent typhoons) and geology (unstable soils and frequent earthquakes) - upland river valleys are subject to sudden and dangerous flows of earth and boulders. Therefore it is important to provide alerts and warnings. This scenario involved alerts, notifications, grid processing and real-time event architecture.
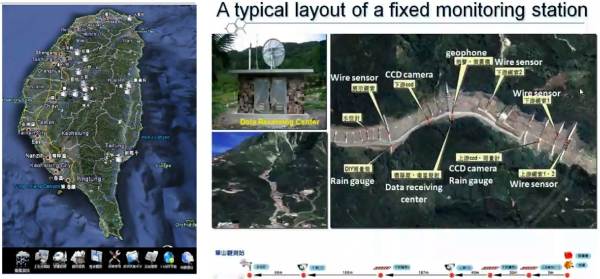
Figure 1. OGC standards have been implemented in a real-time debris flow warning system in Taiwan. (Figure from Geographic Information Systems Research Center at Feng Chia University in Taiwan)
Development and deployment of this system was carried out by researchers and engineers at the GIS Research Center, at Feng Chia University in Taichung, Taiwan and at the Industrial Technology and Research Institute (ITRI). Deployment of an operational Taiwan Debris Flow Monitoring System proceeded throughout 2009, resulting in a working system that supports monitoring of critical conditions. This system provides significantly increased protection for citizens and businesses in thirteen of the river valleys in Taiwan that have the highest potential for debris flows.
At thirteen fixed locations, sensors such as rain gauges, geophones, wire sensors and water level meters provide observation data through ADSL networks or satellite links. Two mobile vehicles equipped with monitoring devices can be dispatched to areas where debris flows are likely.
Web services that implement the OGC Sensor Observation Service (SOS), Sensor Planning Service (SPS) and Sensor Alert Service (SAS) Interface Standards enable communication between the various parts of the system. Components that provide alert notices use the OGC Web Notification Service (WNS). Applications, including one that provides Short Message Service (SMS) alerts, can access stored and real-time data. In some applications, users can click on sensor icons in graphical 3D terrain views to check on the status and outputs of sensors.
The Feng Chia University and ITRI team have provided a comprehensive OGC Best Practices document that serves as a cookbook for implementing SWE, including schemas, examples and working code.
SANY - “Sensors Anywhere”
As a major “Integrated Project” in the Sixth Framework Programme of the European Commission (IST-FP6), SANY extended the interoperability advances of the earlier European project, ORCHESTRA, into the domain of environmental sensor networks and standards-based sensor web enablement to support decision-making.
OGC SWE standards were applied in SANY to three innovative risk management applications involving air pollution, marine risks and geohazards. These efforts yielded valuable reference implementations of sensor web services and geospatial processing Web services for decision support and data fusion.
Figure 2: This book summarizes the approaches and results of the SANY project.
Further information and details on the open architecture for sensor networks is available at http://www.sany-ip.eu/publications/3317.
Sensor Webs: The German tsunami warning system for the Indian Ocean
Open source software that implements SWE standards is being used in a number of real-world systems, including a monitoring and control system for the Wupper River watershed in Germany, an Advanced Fire Information System (AFIS), and a wildfire monitoring system in South Africa. Another is the German Indonesian Tsunami Early Warning System (GITEWS), a 35 million Euros project of the German Aerospace Agency (DLR) and the GeoForschungsZentrum Potsdam (GFZ). GITEWS uses SWE services for sharing tsunami related information among GITEWS software components. Real-time sensors and simulation models provide data for GITEWS.
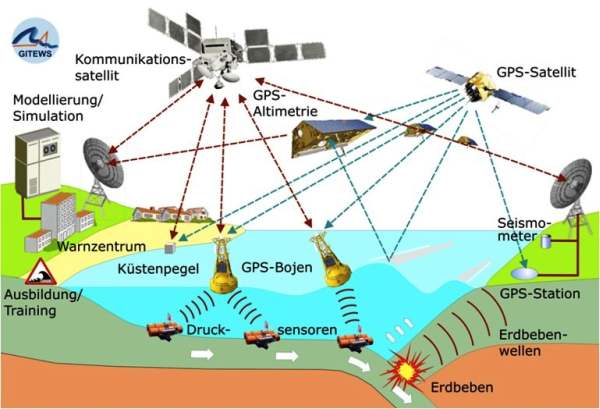
Figure 3: GITEWS provides indicators of a tsunami and its dimensions by the analysis of different measurements at a very early stage.
More detailed information is available at http://www.gitews.org.
The OGC Interoperability Program
http://www.opengeospatial.org/ogc/programs/ip
The OGC, through its Interoperability Program (IP), facilitates testbeds, pilot projects and interoperability experiments in which standards are created and tested. Many of these interoperability initiatives, as shown in the examples below, have had at least a partial focus on hazards and risk, both natural and man-made.
- OWS-6 brought together 10 sponsor organizations and 32 participating organizations to advance standards in five major technology focus areas or “threads”, including: Sensor Web Enablement (SWE), Geo Processing Workflow, Aeronautical Information Management, and Decision Support Services.
- OWS-7 focuses on Sensor Fusion Enablement, Feature and Decision Fusion, and aviation information systems. Fusion is defined as “the act or process of combining two or more pieces of data or information regarding one or more entities to improve the capability for detection, identification or characterization of that entity.” For example, if a power plant has been flooded, advanced fusion capabilities will enable rapid combination of information from many sources for the purposes of assessing the risks inherent in the situation.
- The Geo-interface for Atmosphere, Land, Earth, and Ocean netCDF Interoperability Experiment (GALEON IE) has produced reports that describe how OGC Web services were used in applications that involve netCDF data, a data format used widely in meteorology and climatology. The goal of GALEON IE is to improve interoperability among diverse geospatial information systems used in studying and responding to major storm events, tsunamis and earthquakes.
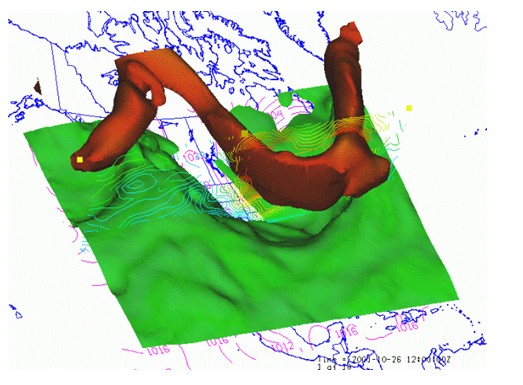
Figure 4: Visualization of Weather Forecast Model Output
- The GEOSS Architecture Implementation Pilot (AIP), a multi-year OGC Interoperability Initiative, brings together technical contributions from over 120 organizations. Their task is to provide the architecture for the Global Earth Observing System of Systems (GEOSS) being developed by the Group on Earth Observations (GEO). The participating governments seek to make a very large collection of geospatial data available on Web servers, including live sensor data and stored geodata of many kinds. The goal is to improve understanding and capacity in dealing with challenges involving disasters, health, energy, climate, water, weather, ecosystems, agriculture and biodiversity.
- OGC is a member of the EO2HEAVEN team that is executing a Collaborative Project of the European Commission Seventh Framework Program (FP7). EO2HEAVEN will contribute to a better understanding of the complex relationships between environmental changes and their impact on human health. The project will monitor changes induced by human activities, with emphasis on atmospheric, river, lake and coastal marine pollution. EO2HEAVEN will specify and implement the Spatial Information Infrastructure (SII) as an open architecture based upon international standards and adaptive geospatial Web services in alignment with the large-scale initiatives INSPIRE (European directive for an Infrastructure for Spatial Information in the European Community) and GMES (the European Earth observation program for Global Monitoring for Environment and Security). The SII will include bridging capabilities at the syntactic and semantic levels to and between environmental and health systems.
Other OGC interoperability initiatives that are directly relevant to emergency and disaster management include: a series of Critical Infrastructure Protection Initiatives, Emergency Mapping Symbology, Fusion Standards Study, Geospatial Fusion Pilot Project, Geospatial Fusion Testbed, Kentucky Watershed Modeling Information Portal, Multihazard Mapping Initiative, Open Location Services Testbed and Sensor Alert Service Interoperability Experiment.
OGC’s Working Groups
The OGC Technical Committee’s 26 domain working groups (DWG) bring together experts from various fields of activity to review and develop standards that meet their domains’ requirements. Domain working groups also sometimes focus on domain-specific data models and schemas that facilitate discovery, access, sharing, analysis, visualization and processing of information among stakeholder organizations. The Technical Committee’s 28 standards working groups (SWG) each have a charter to work on a specific candidate standard prior to approval as an OGC standard or to work on making revisions to an existing OGC standard.
The OGC Emergency and Disaster Management Domain Working Group (EDM DWG) (http://www.opengeospatial.org/projects/groups/edmdwg) provides a forum for uniting communities of users including government agencies, industry, research organizations, Non Governmental Organizations and others whose work involves emergency and disaster management. Like the other Domain Working Groups, the EDM DWG promotes and supports the establishment of requirements, standards and best practices for web service interfaces and encodings.
An example of a standards working group of interest to the EDM community is the Geo Short Messaging Service (GeoSMS) Standard Working Group, which is advancing the OGC Candidate Open GeoSMS Standard as an OGC adopted standard. This candidate standard, currently an OGC Discussion Paper, defines an SMS format to exchange GPS information for different location services devices and applications. The GeoSMS SWG will ensure that the standard is consistent with the OGC baseline, that is, the set of adopted OGC abstract standards, reference models and implementation standards. This is critical, because it will be important in the EDM world for location information from mobile devices and social networking applications to be useable in decision support applications that also involve much more complex types of geospatial data and processing.
The OGC has several committees besides the Technical Committee. A new Business Value Committee has been chartered in the Technical Committee to, as its charter states, “…identify, coordinate and promote the business value of OGC standards and programmes through engaging member senior managers, commercial, sales marketing professionals as well as policy makers and strategic decision makers. The goal is to build a Standard Value Model supported through case studies, reference implementations and business cases for the development and use of geospatial standards in various industry domains and across the community.”
Conclusions
Through open standards – TCP/IP, HTTP, HTML and others – the Internet and the Web connect computers in an extraordinary communications network. The open standards developed by the OGC build on this platform to connect, among other resources, the geospatial software products used in emergency and disaster management. OGC standards have become well established in the marketplace and it is now quite feasible for purchasers of geospatial software to select products whose interfaces and encodings match those of products used by data sharing partners – that is, the products are compliant with the same OGC standards. The standards make it much easier for developers to create interoperable systems, such as sensor webs for early warning, and they make it much easier for decision makers to obtain information from multiple sources at any stage in crisis management. The use of standards considerably reduces investment risks.
Much opportunity remains, however, for information community leaders to contribute requirements into the standards development process and to develop best practices for the communication of geospatial information in their communities. Membership in the OGC helps communities collaborate and exchange knowledge, and it provides opportunities to influence the direction of standards development in important environmental and other arenas.
Monitoring and prediction of natural disasters in Kyrgyzstan
Monitoring and prediction of natural disasters in Kyrgyzstan
Teshebaeva Kanayim and Bolot Moldobekov
Central Asian Institute for Applied Geosciences (CAIAG)
Abstract
The Kyrgyz Republic is a disaster-prone country due to its geographical location in an active seismic zone and its mountainous landscape. Earthquakes, landslides, mudflows, avalanches etc. cause serious damage to both human life and country economy: earthquakes, landslides and floods are of special concern. Kyrgyzstan counts annually some 3,000 tremors and about 10-12 earthquakes, ten to hundreds landslides and around 60 glacier lake outburst. During the last decade space technology played a key role in contributing to the efficient mitigation of disasters. Earth observation satellites provide required geospatial data to support disaster response, monitoring activities and post-disaster damage assessment, and reconstruction, and rehabilitation. This paper describes the role of earth observations satellites on emergency observation, monitoring and assessment of disasters in Kyrgyzstan.
Background
In Central Asia and particularly in Kyrgyzstan as in a mountainous region there have always been specific processes both of natural and anthropogenic origin which bear a threat to human lives and economic losses. Today they have all been well studied enabling us to use effective organizational and engineering solutions for their prevention and reduction of a negative impact.
The most dangerous hazard is an earthquake which causes possible great human life and economic losses. This hazard has a stochastic character both in time and space and can be predicted only with certain probability therefore a permanent readiness to its occurrence is essential. Risk degree is connected directly with the quality and earthquake-proof of living and social and infrastructure constructions. This is the most vulnerable aspect in our region and therefore we need to place high emphasis on it. Today in CAIAG we are working on a program in expanding the automatic seismic stations network and in the near future we will start working on precision of the cities seismic microzoning which can afford to more fairly assess possible damages of different types of constructions in different engineering and geological conditions and to rationally plan preventive risk reducing measures.
Current status and situation
Earth remote sensing methods are very efficient for improving the understanding of the temporal and spatial evolution tendencies of these phenomena and allows, together with ground methods, to more effectively define parameters of the considered processes. This is a key research direction of CAIAG where we use GPS survey, radar and multi-sensor measurements data interpretation to solve tasks of natural objects monitoring and determining their evolution features and the automatic weather stations, hydro and seismic stations which will allow to predict main climatic, hydrologic, glaciological and seismological mechanisms of the region.
Landslides, floods, mud-flows, outburst of glacial lakes, avalanches, ground water flooding, land erosion and salinization are the next by the risk degree considering their spatial expansion. Although these processes have a stochastic character they have exact enough spatial localization that allows us to define areas of possible impact and to undertake preventive measures. The natural hazards distribution map (Fig. 1) gives an overview on natural disasters in Kyrgyzstan. In the first nine months of 2010 there have been 142 floods, 60 landslides, 41 snow avalanches and 13 earthquakes.
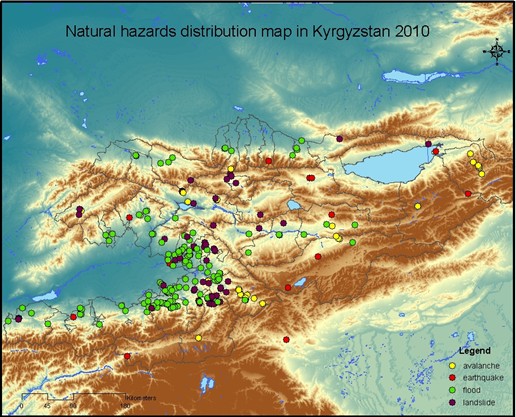
Figure 1: Natural hazards distribution map in Kyrgyzstan 2010.
With the progress in modern technology it has become possible to monitor natural disasters using satellite data. One of the promising initiatives the Sentinel Asia initiative. Sentinel Asia is a voluntary basis initiative led by the APRSAF (Asia-Pacific Regional Space Agency Forum) to support disaster management activity in the Asia-Pacific region by applying the WEB-GIS technology and space based technology, such as earth observation satellites data.
Sentinel Asia provides a great opportunity for developing countries like Kyrgyzstan to monitor natural hazards in the region. CAIAG joined the Sentinel Asia project in 2009 to work in cooperation with Ministry of Emergency Situations (MES). In the frame of the Sentinel Asia project there have been several emergency requests in the Central Asian region.
On March 12, 2010 there was a flood in Kazakhstan due to break of the dam at Kyzyl-Agash village. The death toll from the flood was 34 and thousands were evacuated as informed by the Ministry of Emergencies. Spring flooding is frequently occurs in Central Asia but a sudden rise in temperatures following weeks of heavy snow storms has exacerbated the problem this year (Fig.2).
Disaster area maps were created by visual interpretation from ALOS data together with topographic maps (scale 1:100 000) and information from Ministry of Emergency Situations. The flooding zone of the Balhash sea area is 2 604 square kilometres and Kyzyl Agash flood area is 1 128 square kilometres.
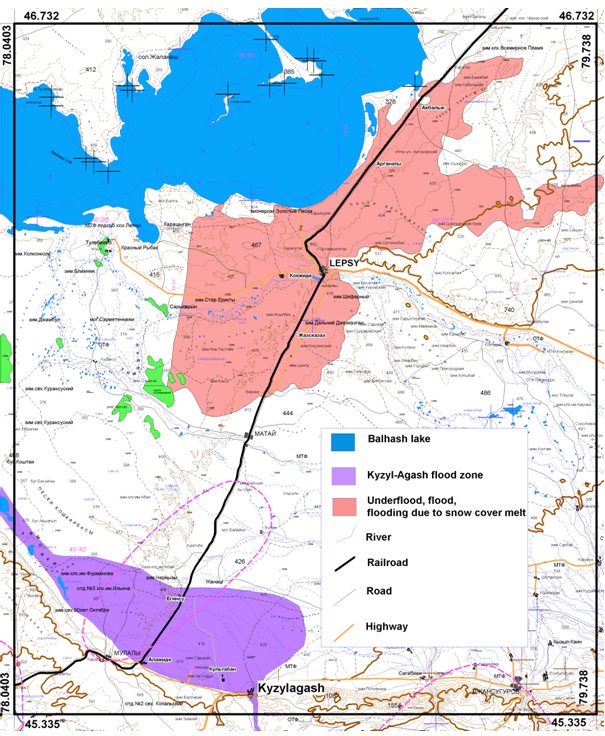
Figure 2: Flood map, Kazakhstan 2010.
ALOS data were used in a project during 2009-2010 supported by Japan Aerospace Exploration Agency (JAXA). The study was on deformation in the Pamir-Alai area for Nura 2008 earthquake with potential use of ALOS satellite data (Fig.3 and Fig.4). Figure 4 shows first preliminary results on using Radar Interferometry techniques in order to define surface deformations for Nura and Kochkor earthquakes.
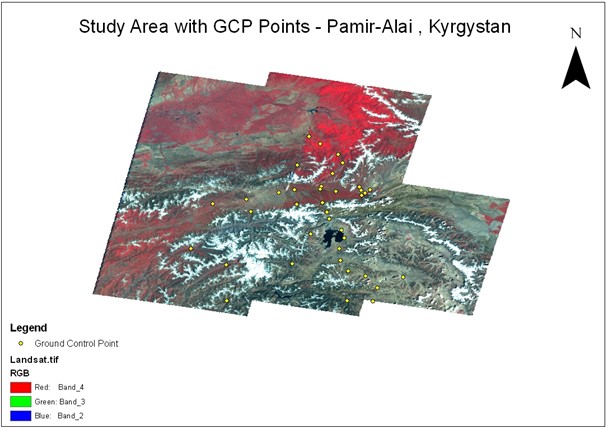
Figure 3: ALOS AVNIR data with resolution of 10 meters Pamir-Alai, Kyrgyzstan.
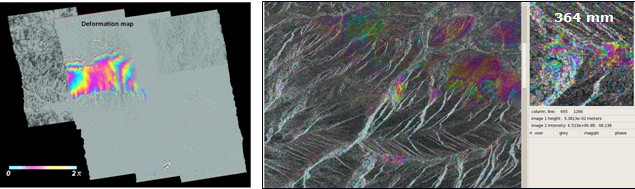
Figure 4: Preliminary results from ALOS PALSAR data on Nura 2008 and ENVISAT data for Kochkor 2006 earthquakes in Kyrgyzstan.
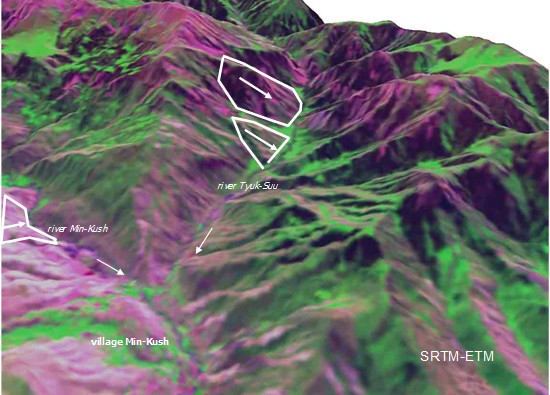
Figure 5: SRTM-ETM data with landslides bodies the arrows shows falling slope.
Active landslides are a special concern which CAIAG monitors in cooperation with the MES. One the active landslide is the Min-Kush which is located next to radioactive tailing. In 2004 deep cracks were formed with the land subsidence in underlying gully and later that year the amplitude of vertical removal along cracks up to 1 m on the upper platform and up to up to 0,3 m along northern border, with extension not less than 200 m sub-parallel to general falling of slope were observed (Fig.5). In 2007 new cracks were formed. GPS monitoring has proven to be efficient to monitor the landslide area.
Discussions and conclusion
The main peculiarity of all the processes considered above is their stochastic character caused by the specificity of the objects–factors interaction in the geospheres conditions. A practical possibility of the precise forecast is impossible due to the stochastic character of the negative processes evolution and the probabilistic assessment allows only defining of risk degree and problematic when it concerns human lives. There is no ample risk reduction strategy choice in this situation. One of the evident strategies is a strategy of adaptation when we use data of the negative processes impact area and avoid it or minimize our activities in its bounds. And the second is the strategy of the engineering protection. All the other strategies like, for example, creation of early warning system for increase of population awareness of dangerous processes reduce risks to a slight degree.
The main obstacle in Central Asia for the efficient realization of minor strategies listed above is the lack of financial resources.
Although there is no opportunity to quickly and fully accomplish these strategies we at least need to constantly understand their importance in the current economic activity. And a strong government control is necessary over the implementation of these measures as only the government makes resources available for it and in case of the strategy non-observance and disaster occurrence the main expenses burden is incumbent on it.
This paper undoubtedly refers to the anthropogenic risk component as there is an opportunity of monitoring and creation of risk control here. The practice shows that preventive actions in the anthropogenic component field reduce risks much and cost much cheaper than clean-up operations of short-sighted and ignorant economic activity. The notorious examples of ecological disasters mainly connected with human activity are the dehydration of Aral Sea basin, uranium and rare-earth production dump-tail problem and soil degradation and desertification.
Regarding changes due to climate change it can be said undoubtedly that it is occurring presently and will occur in the future. These changes are different and will always have both positive and negative components. Today we are a witness of global warming with all its accompanying negative consequences but being aware of secular cyclic recurrence of the temperature motion and disposing data of paleoclimate reconstruction we can imagibe a global chill. Periods of these changes as well as amplitudes of climate parameters irregular due to the mentioned above stochastic nature of all the planetary processes and the precise forecast here is unachievable in principle. Therefore we must be ready to resist, regardless of climate tendencies direction and its rate, building our technological and energy capacity – there is no other way. And obviously our progress will be more impressive if we join efforts and resources.
References
- Usupaev Sh.E., Moldobekov B.D., Aitaliev A.M., Meleshko A.V., Erohin C.A., Ibatulin H.V. Basics of engineering geonomy and natural hazards. (Ministry of education and science of Kyrgyzstan study materials. Bishkek, 662 (2006).
- Havenith H.B., Torgoev I.A., Meleshko A. et al. Landslides in the Mailuu-Suu valley, Kyrgyztsan. Hazard and impacts, Landslides, vol.3, no.2 (2006).
- Rossener S., Wetzel H.U., Xia Y., Meleshko A.V., Sarnogoev A. Investigation of landslide processes in Southern Kyrgyzstan using optical and radar remote sensing in a GIS environment. EGS 24th General Assembly the Hague, Geophysical Research Abstract, vol. 1, no.2 (1999).
Support of remote sensing for natural disaster risk maps in Leyte, Philippines
Support of remote sensing for natural disaster risk maps in Leyte, Philippines
Olaf Neussner, Chief Advisor for Disaster Risk Management, German Technical Cooperation (GTZ), Philippines
Katharina Wilkin, cand. Dipl. Ing., Technical University Dortmund, Faculty of Spatial Planning
Introduction and background
Due to its geographic location the Philippines is highly prone to the occurrence of natural hazard events, such as earthquakes, volcanic eruptions, tropical cyclones and floods, making it one of the most disaster prone countries in the world. 2009 demonstrated this again with consecutive tropical cyclones hitting the country and causing almost a thousand casualties as well as economic damage estimated to about 2.7 percent of the GDP (1).
An average of one person in 100,000 inhabitants dies from natural disaster per year (2). Next to the loss of human life, the frequently occurring damages are an enormous burden to the country’s economy. On average, the costs of disasters are annually as much as approximately 0.5% of the GDP (3). Disasters do not only obstruct development efforts and industrial growth but have severe effects especially on the livelihood of vulnerable rural communities that have to face these hazards on a regular basis.
Global warming and the resulting climate change will particularly affect the Philippines, especially with regard to weather induced disasters. There are indications that rain patterns are changing and are becoming more irregular. This would increase the occurrence of droughts and floods. In addition, the predicted rise of sea level will increase wave action induced erosion and damages to coastal habitats and settlements.
The exposure to hazards alone does not necessarily result in severe disasters. It depends on the vulnerability of communities and assets. The vulnerability is to a large extent determined by the stage of development of a society. For example, a typhoon of the same strength would have a 17 times stronger impact on the Philippines than on Japan (2). The combination of an insufficient prepared country and high exposure results in disasters with an avoidable high death toll and significant losses of assets affecting the development of the country.
Vulnerabilities are specific to hazards. A rice field may be very vulnerable to floods but not to an earthquake while a building can collapse under the forces of an earthquake ground shaking but withstand a flood with only very minor damages. Therefore, typical assets or land uses have to be assessed locally and their vulnerability to likely hazards determined in order to adapt the land uses to the existing hazards.
Most important for such assessments is the knowledge of regional/local disaster risks, in particular the exposure to hazards and the conditions of vulnerability. Both need to be examined to arrive at reliable information suitable for decision making. Resources for such assessments, particularly for ground surveys in remote areas, are limited. Hence, space-based technologies are gaining ground to close these information gaps.
Given the above mentioned needs and available technological means, German Technical Cooperation (GTZ) used satellite-based land use maps to produce natural disaster risk maps in Leyte Island, Philippines. In the following, the different steps in developing these maps are explained in more detail.
Vulnerability assessment
Land use map as basis for the assessment
The determination of vulnerabilities requires detailed knowledge of land use. Therefore a land use map had to be produced (Fig. 1). GTZ acquired satellite images with high resolution. Since one part of Leyte Island could not be covered a lower resolution image had to be utilized.
Preprocessing involved georeferencing to correct the spatial reference of the satellite images (SPOT 5 Level 2A, ASTER Level 1B, and LANDSAT ETM+). The process involved a one-by-one registration with the acquired satellite images. The registration was done in ENVI 4.2 with the 2nd degree polynomial nearest neighbor method.
As a next step, the raw data format was loaded (for SPOT the DIMAP, for ASTER the HDF, and for LANDSAT the GeoTiff). ASTER Images were first oriented to the North before the image-to-image registration could take place. Bands number 1, 2, and 3N were used as these bands comprise the Visible and Near Infrared (VNIR) bands and are also equivalent to the SPOT bands.
LANDSAT Images were first loaded as different bands and were later stacked. Bands 1 to 5 were used since these have the same spatial resolution (30 meters). Then an image-to-image registration was done.
Clearly visible Ground Control Points (GCP) were employed during the registration. With image-to-image registration, visible structures on both of the images were examined and were used as GCPs. The Root Mean Square (RMS) error was kept to 0.8 for all images. All satellite images were saved to an ENVI native file and also as a GeoTiff file.
Before the actual classification, the sea, settlement areas, fishponds, roads, clouds and shadows, and rivers were manually masked as these are easily distinguishable on the images. A mask was created specifically for each image. The mask was saved in ENVI native file format to be used later in the classification.
Images were loaded to ENVI and training areas were identified using the ROI (Regions of Interest) tool. At least 20 polygons of training and test areas were selected per class per image to obtain a result in an acceptable error frame.
GPS ground truthing data were also loaded as vector files to facilitate recognition of land cover in a certain area. Two sets of ROIs were prepared: one for the training set and one for the test set for the later classification accuracy testing. Statistics were calculated in the process of choosing ROIs in order to note the number of pixels per class over the different image bands. A minimum of 20 polygons per class was made for each training and test ROIs. ROI separability was also made to assess the separability of each class; a value of 1.8 to 2.0 per class denoted that each class is properly separated (with minor exceptions) from each other.
A supervised classification with the maximum likelihood method was used, and the pre-processed mask per image was applied as a mask band in the classification process. The Land cover classification and definitions used were derived from the Philippines National Forest Inventory Manual (4).
The classes were converted to vector files and further processed with ArcGIS and Manifold 8.0.
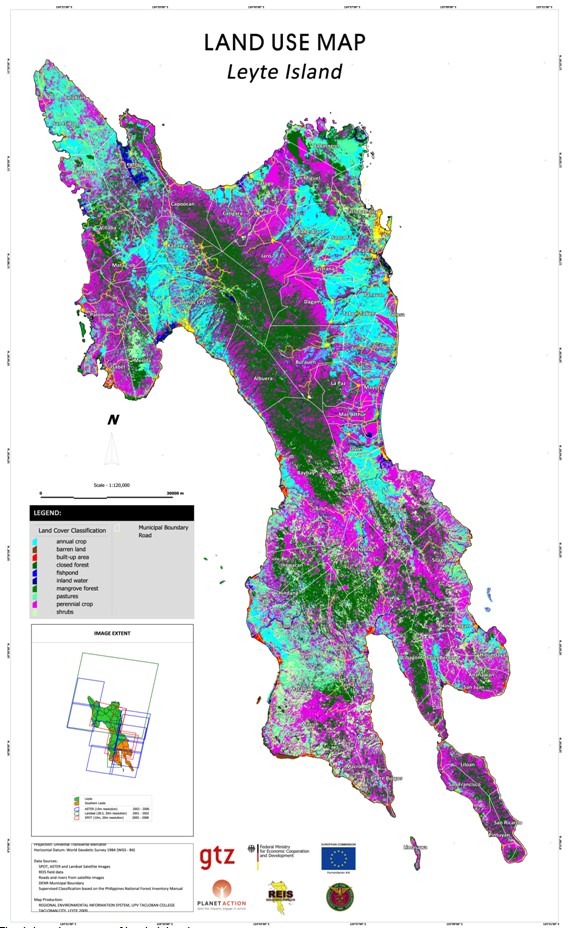
Fig. 1: Land use map of Leyte Island
In order to demonstrate further steps a small area in Leyte Island was selected. It covers part of the city of Tacloban and the municipality of Palo. For better orientation roads and rivers are included.
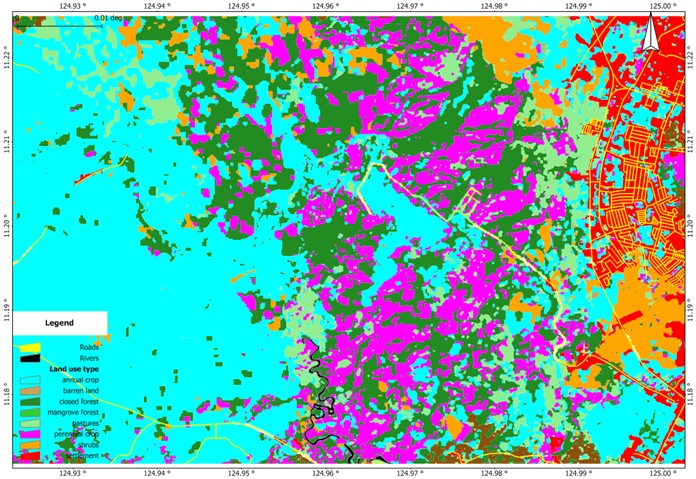
Fig. 2: Land use map of Tacloban City and the municipality of Palo, Leyte Island
Vulnerabilities
According to ISDR, vulnerability is defined as “the characteristics and circumstances of a community, system or asset that make it susceptible to the damaging effects of a hazard” (5). Usually the direct physical susceptibility to the impact of a hazard event is distinguished from secondary effects, which might be social, economic or environmental factors. In this paper only the direct physical vulnerability is addressed.
Vulnerabilities are specific to type and strength of hazards and the characteristics of the exposed assets. This is described in vulnerability curves displaying a function of damage and increasing strength of the hazard. With a few exceptions no vulnerability curves exist on a local level in the Philippines. The authors relied on interviews with local experts, mostly from government institutions in Leyte Island, to collect data on vulnerabilities. Table 1 shows an example of the impact of typical local floods on wooden buildings in Leyte.
| Flood Damage in % | Flood characteristics | Impact inside buildings | Impact on buildings |
|---|---|---|---|
| 5 (very low) | 0.3m, 4hours, very little current | People had to move objects to higher elevation, mop and clean. | No damage, wall paint deteriorated. |
| 5-10 (low) | 1m, 2-4days, slow current | Minor losses, particularly kitchen cupboards, clothes, shoes and mattresses. Mop and clean. | No structural damage, wall plaster may need repair and painting. Wooden frames need to be treated. |
| 10-50 (moderate) | 2m, 5days, medium current | Almost total loss of the furnishings, esp. furniture equipment, kitchen cupboard, etc. People had to remove dirt and mud from inside. | Considerable structural damage to wooden doors and frames, plaster and painted walls. |
| 50-80 (high) | 3m, 7 days, strong current | Total loss of furnishings. | Partial destruction of foundation, wall and doors. |
| 80-100 (very high) | not experienced | Total loss of furnishings. | Total destruction of the dwelling. |
Table 1: Vulnerability of Wooden Buildings to Floods
The same type of data were collected for major land use forms, but some were regarded to be almost not susceptible to natural hazards (pastures, barren land and to a lesser degree bushes). Vulnerability includes both factors, the replacement costs as well as the susceptibility of the particular land use form.
In a second step the economic value of different forms of land use was gathered from local experts. The current replacement costs (Table 2) are taken as a basis for further calculations. They are expressed in Philippine Pesos (1 US$ approximately 43 Philippine Pesos).
| Land use | Replacement cost per hectare in Philippine Pesos |
|---|---|
| Annual crops | |
| Rice | 30,000-40,000 |
| Corn | 18,000-24,000 |
| Perennial crops | |
| Coconut | 27,000 |
| Banana | 36,300 |
| Natural sites | |
| Mangroves | 15,700 |
| Closed forest | 51,200 |
| Settlements | |
| High quality houses | 9,900,000 |
| Low quality houses | 3,850,000 |
Table 2: Replacement costs
Different crops within a land use class were weighed according to their percentage in agricultural areas (data from the Department of Agriculture). Different housing quality was weighed according to municipal statistics of the distribution of houses. The basis for the value of houses was floor area. As only 11% of settlements are actually buildings in Leyte (based on a sample from Palo, Leyte) the replacement costs per hectare were adjusted accordingly. Figure 3 shows an example of a small area of Leyte.
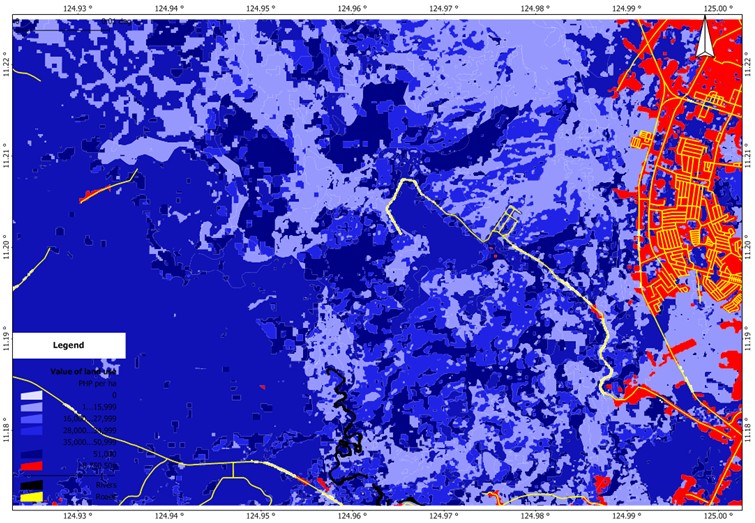
Fig. 3: Map of land value (replacement cost of land use)
The physical vulnerability of different forms of land use to a hazard (here floods) are displayed in Fig 4. Rice paddies are the most vulnerable form of land use because a whole harvest may be lost due to the flood. It may be noteworthy that the map illustrates that vulnerabilities are not limited to hazard-prone areas.
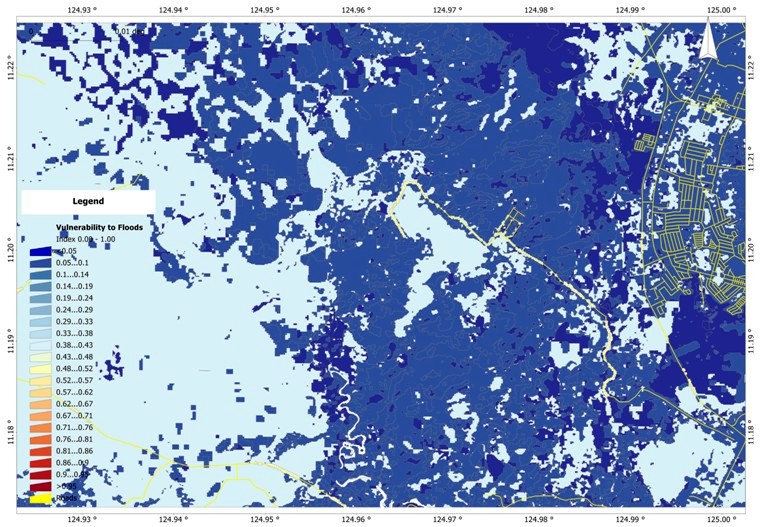
Fig. 4: Map of vulnerability to landslide
Hazard assessment
Determining vulnerabilities alone is of little value without considering the hazards threatening an area. ISDR defines a hazard as “a dangerous phenomenon, substance, human activity or condition that may cause loss of life, injury or other health impacts, property damage, loss of livelihoods and services, social and economic disruption, or environmental damage” (5). Natural hazards are characterized by three features: spatial distribution, strength or magnitude, and probability of occurrence.
For Leyte Island different sources and qualities of information are available for the different hazards. Typhoon hazards are described in terms of affected area, severity and probability by the reinsurance company Munich Re (6). Floods, liquefaction from earthquakes, and storm surges are described only regarding their spatial distribution (susceptibility) by the Mines and Geoscience Bureau (MGB) and the Philippine Institute of Volcanology and Seismology (PHIVOLCS) of the Philippine Government. MGB and PHIVOLCS describe other hazards (rain-induced and earthquake-induced landslides, ground shaking from earthquakes) with three different classes of susceptibility (high, medium, low) apart from the potentially affected area and in the tsunami hazard map some maximum wave heights are indicated.
The available data rarely cover strength and probability. Therefore local investigations had to be conducted. It appeared to be difficult and cumbersome to gather reliable data on strength and probability. Further research will refine initial findings.
For the Tacloban/Palo area in Leyte a return period of 1.2 per year was derived from interviews with a maximum height of 1m and a duration of 2-4 days (Figure 5).
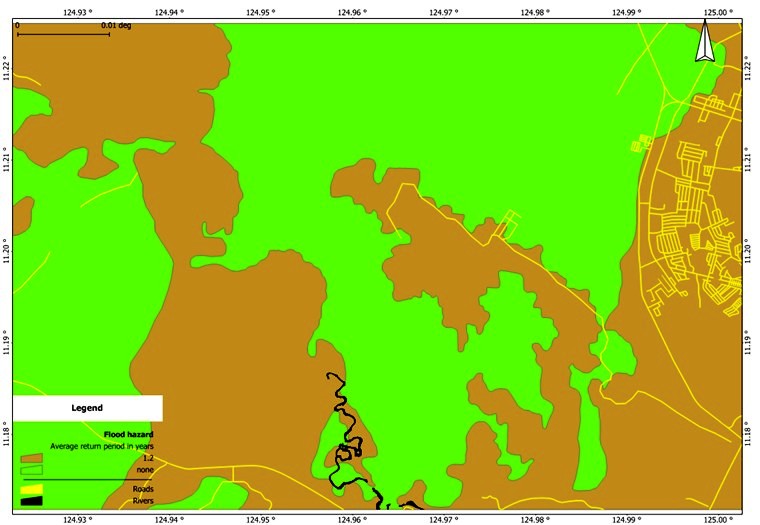
Fig. 5: Map of flood hazard for a flood with a maximum height of 1m and duration of 2-4 days
Landslides proofed to be more difficult to quantify in terms of probability. MGB estimates approximately 30% of Leyte Island as highly susceptible to rain-induced landslides (RIL), while approximately 20% are categorized as moderate and low susceptible respectively. This equals 2,200km2 for high, 1,400km2 for moderate and 1,400km2 for low susceptible areas. Landslides are not recorded systematically on the Island. A derivation from known landslides suggests that 0.8km2 of highly susceptible area are moving as landslides every year. This means a return period of 2.25 years.
The National Economic Development Authority (NEDA) describes the probability of the moderate RIL susceptible area as one fifth of the highly susceptible area and the low susceptible area as one quarter of the moderate area (3). This results in 11.25 and 45 years, respectively, as a return period for RIL in moderate and low susceptible areas (Figure 6).
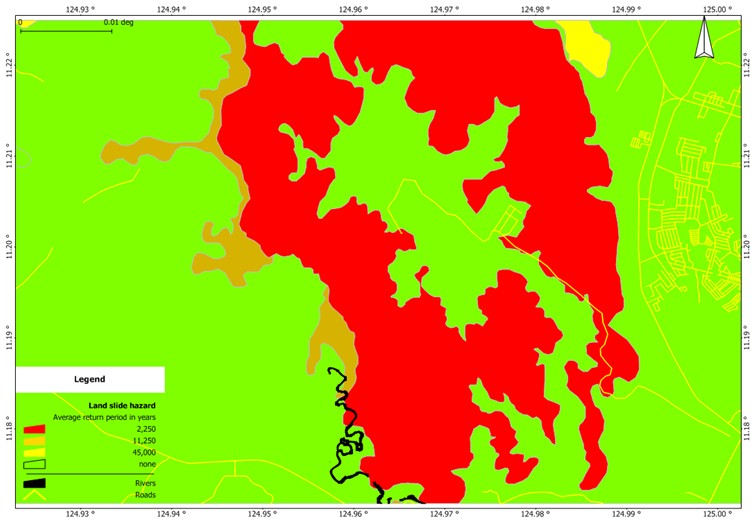
Fig. 6: Map of rain-induced landslide hazard
There are relatively small overlaps of the two hazard areas, which is to be expected because landslides happen on steep slopes while floods occur in plains.
Risk assessment
Risk is defined as “the combination of the probability of an event and its negative consequences” (5). It is calculated by multiplying the vulnerability of an exposed element with the probability of a hazard of a certain severity. In order to get an encompassing risk assessment, different categories of a hazard (different severities and responding probabilities) have to be compiled to arrive at the total risk of a particular hazard. Risks of different hazard types have to be calculated one by one and then added to arrive at a total risk estimate of all hazards.
Figure 7 shows the expected average damage per hectare and year caused by rain-induced landslides. As the return period for low susceptible areas is assumed to be 45 years, the resulting cost per year is very low and only significant for settlements because of their high value per hectare.
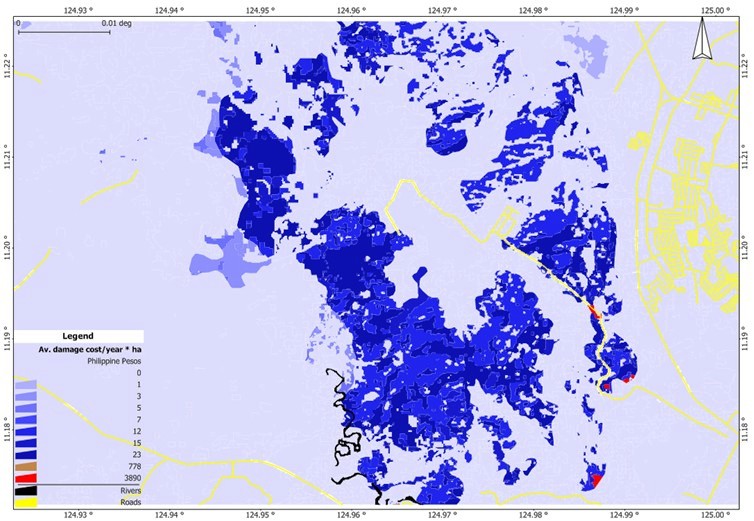
Fig. 7: Map of expected average damage per hectare and year caused by rain-induced landslides
The same kind of calculations was used for other hazards (floods, wind/storm, and earthquake). Adding these four risks (damages in Pesos/year/ha) resulted in a multi-hazard map (Fig. 8). The map shows that a considerable part of the area has no risk of financially significant damages because there is either no hazard or the value of the land use is negligible. The high calculated costs of damage in the flood-prone settlement area do not necessarily mean that this amount of money has to be raised every year. For example, many inhabitants who experience floods do not repaint walls after they were affected by flood waters and damaged furniture might lose value but can still be used.
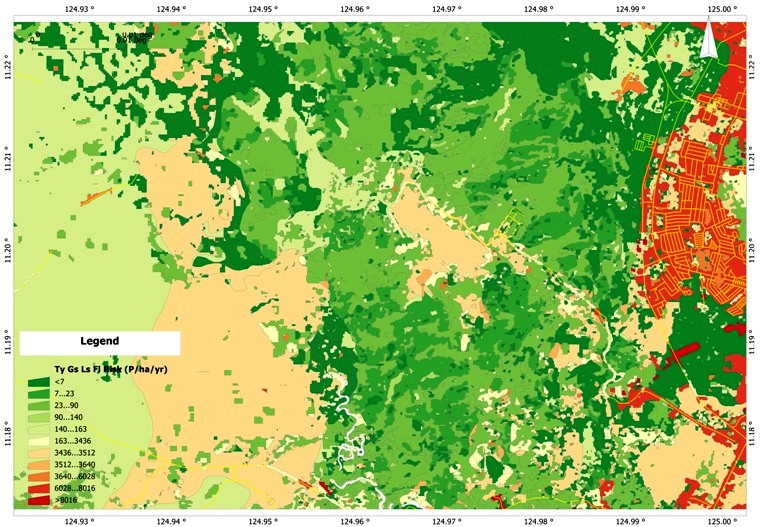
Fig. 8: Map of expected average damage per hectare and year caused by rain-induced landslides, ground shaking, wind/storm and floods
Conclusions
Land use maps with a spatial resolution of 5-15m are sufficient for a province level assessment of natural hazard risks and in the absence of good alternatives they also provide valuable information on municipal level, although not sufficient for planning as 1:10,000 is the desired scale.
Using medium resolution satellite imagery for the production of land use maps appears to be the most efficient way of solving this task. Aerial photography and ground surveys are too expensive and/or labor intensive for large rural areas. Limiting factors in the case of Leyte in the Philippines are the availability of archive images with a low cloud cover and the expertise and time needed to convert images into useful vector information.
Information from different sources on vulnerabilities are still quite incomplete and probably in some cases subjective overestimations of hazard impacts. A more systematic compilation leading towards vulnerability curves for common hazards is needed in order to arrive at more precise vulnerability estimations.
Similarly hazard maps and data on severity and probability appear to need verification.
Although the limitations in hazard and vulnerability assessments are reflected in the risk assessment the risk maps are a significant step forward for local governments in Leyte, because for the first time they are provided with quantitative natural hazard risk maps. These maps serve as a basis for the identification of current high risk areas needing priority interventions like structural protection or adaptation measures. The maps also enable the local governments to estimate the risk in potential development areas in order to avoid dangerous places and promote safer areas.
Acknowledgement
Financial support was granted from the Commission of the European Union under the DIPECHO programme and the German Federal Ministry for Economic Cooperation and Development, and the German Academic Exchange Service (DAAD). Planet Action provided SPOT images.
References
- Republic of the Philippines (RP) & Global Facility for Disaster Reduction and Recovery (GFDRR), (2009), Typhoons Ondoy and Pepeng: Post-Disaster Needs Assessment, Manila, p. 2.
- International Strategy for Disaster Reduction, ISDR, (2009), Global Assessment Report on Disaster Risk Reduction. United Nations, Geneva, Switzerland, pp.7, 50.
- National Economic and Development Authority, NEDA, (2009), Mainstreaming Disaster Risk Reduction in Subnational Development and Land Use/Physical Planning in the Philippines, Manila, pp. 20, 275.
- Branthomme, A.; Saket, M.; Altrell, D.; Vuorinen, A.P., National Forest Inventory, Philippines, Field Manual, (2002), FAO, Forestry Department.
- International Strategy for Disaster Reduction, ISDR, (2009), UNISDR Terminology on Disaster Risk Reduction, Geneva, pp. 7, 11, 12.
- Munich Reinsurance Company, Geo Risks Research Department, Munich Re, (2008), Natural Hazards Assessment Network, http://mrnathan.munichre.com/, accessed 2008.
Use of satellite-based information and Geographic Information System for geo-referencing of thematic maps: Applications for risk-sensitive land use planning and emergency escape route planning in Kathmandu Metropolitan City, Nepal
Use of satellite-based information and Geographic Information System for geo-referencing of thematic maps: Applications for risk-sensitive land use planning and emergency escape route planning in Kathmandu Metropolitan City, Nepal
Tabassam Raza, Associate Dean, Graduate School of Business, Philippine School of Business Administration, Quezon City and Post Graduate Student, School of Urban and Regional Planning, University of the Philippines, Diliman, Quezon City
Leigh G. Lingad, Graduate Student, Department of Geography, University of the Philippines, Diliman, Quezon City
Abstract
This paper provides a step-by-step procedure in identifying and modifying a projection/coordinate system of shapefiles with little or no metadata using satellite information. It also aims to apply a developed procedure to achieve further modification to the system’s parameters for higher projection and coordinate system accuracy using ArcMap’s Affine Transformation tool. To demonstrate the applicability of the proposed procedure, examples on how to integrate satellite and GIS-based information in Risk-Sensitive Land Use (RSLU) planning and Emergency Escape Route (EER) planning, are presented.
Introduction
Background
In developing risk-sensitive land use plans, the locational precision of thematic maps for planning plays a vital role. It is imperative to have accurate information about real conditions on the ground at the time of planning. Lack of such may lead to the development of an inappropriate land use plan – especially when people and property are vulnerable to disasters. It is therefore essential to have accurate geo-referencing of thematic maps and supporting satellite information.
During the development of Kathmandu Metropolitan City’s (KMC) RSLU Planning, shapefiles from various sources such as the Japan International Cooperation Agency (JICA), Kathmandu Valley Town Development Committee (KVTDC) and KMC offices were used. However, the shapefiles were found to be based on an unknown coordinate system. This necessitated adjustment to achieve more suitable coordinate system for the shapefiles.
Previous studies show that the most frequently encountered problems are related to missing information on projection modification and the absence of metadata information. For example, in a study on vehicular carbon-monoxide pollution in Kathmandu Valley, Google Earth was used to transform the shapefiles to a correct projection (1).
Furthermore, earth observation techniques through Remote Sensing (RS) are proven to be more cost-effective than ground-based techniques over a large area. There has been an emergence of high-resolution satellite data in recent years, with greater degree of spatial and temporal variation (2).
The main objective of this study is to come up with a procedure to identify and modify a projection/coordinate system of shapefiles. This study also aims to apply the procedure to check its workability to KMC’s land use and other thematic maps and to provide examples on integrating satellite- and GIS-based in the preparation of RSLU and EER plans.
The developed procedure is considered to be cost-effective because satellite imagery is freely available at Google Earth. One can import GIS data into Google Earth for visualizations. The procedure is thus imperative and can be adapted to similar cases or/and when paper maps need to be digitized, customized and corrected. Extra modification to the system’s parameters can still be made to improve accuracy using additional GIS tools (Spatial Adjustment) and other satellite information.
Conceptual Framework
The Conceptual Framework (Figure1) shows that collected secondary data will go through preliminary GIS analysis and organization, as a prerequisite for the development and application of the methodology. Then, the methodology will be developed and implemented to come up with adjusted thematic maps. With satellite- and GIS-based information, the modified maps will then be used as inputs for the RSLU and EER planning processes.
Methodology
Davis et al. (1991) collated and outlined three benefits from combining GIS and remote sensing in various studies, namely, (a) satellite imagery: improving positional accuracy of thematic maps vis-à-vis satellite imagery; (b) remotely sensed image classification using GIS data; and(c) calibration of remotely sensed data and overlay on thematic maps for spatial process modeling. They summarized the synergistic involvement of cartography, remote sensing, and GIS as follows:
- Remote sensing measures and monitors surface electromagnetic variation.
- GIS organizes and analyses the measurements.
- Cartography improves the modeling of surface processes using spectral data (3).
Figure 1: Conceptual framework
The overlaying of thematic maps for spatial modeling is similar to the process involved in delineating suitable areas in land use planning and in formulating emergency escape routes. Recent advances in satellite imagery and Internet (i.e. Google Earth) allow for more than just surface electromagnetic variations such that high-resolution photographic images of the ground are readily available. In addition to abstract modeling of surface processes, these can now be used in risk-sensitive land use planning and emergency escape route planning processes along with the proper use of networking analyses methods and application of land use planning theories.
Identification and modification of a Coordinate System
The following procedure demonstrates how the positional accuracy of thematic maps with incorrect or no metadata can be improved using geo-referenced satellite imagery. Figure2 illustrates the flow of the activities involved in the procedure.
Step 1. Collect secondary data available from various sources.
Step 2. Select a shapefile and check the metadata for the coordinate system information. If the metadata is available proceed to Step 3. If not (Figure3), proceed to Step 5.
Step 3. Validate the information by plotting the selected shapefile on a reference shapefile (Figure4) acquired from credible sources.
Step 4. If the shapefile fits with reference shapefile, it is ready for geodatabase (Figure2); if not, proceed to next step.
Step 5. Identify appropriate coordinate systems from available coordinate system list in ArcGIS (Figure5a) based on the proximity of the area.
Step 6. Select the system that fits closest to the reference shapefile by trial and error method (Figure5b). In this study, the coordinate systems in the Indian subcontinent group were chosen because of their proximity to Nepal.
Step 7. If the selected coordinate system enables the shapefile to fit with the reference shapefile, it is ready for geo-database (Figure2). If not, proceed to next step.
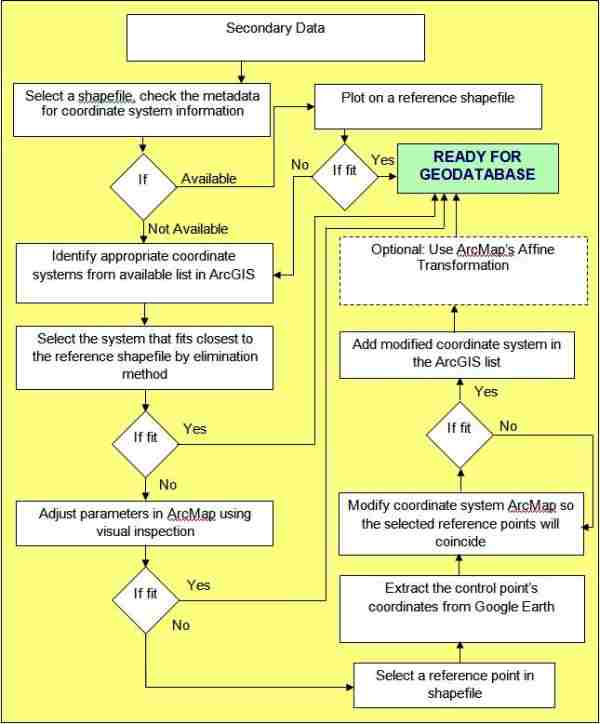
Figure 2: Procedure Activity Flow Paradigm
Figure 3: No metadata in ArcCatalog
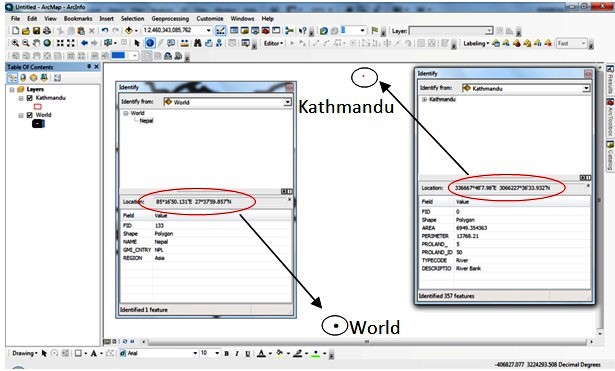
Figure 4: Dislocation of Kathmandu shapefile from reference world shapefile
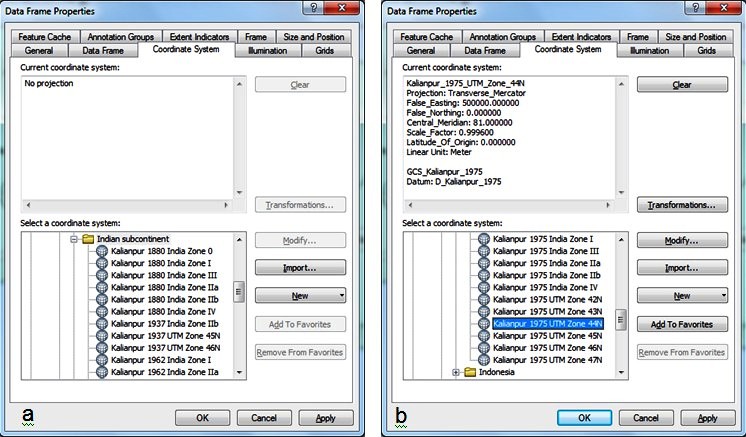
Figure 5: appropriate coordinate systems and selected coordinate system in the data frame properties
Step 8. In the Data Frame Properties, modify the datum parameters of the selected coordinate system so that the shapefile will coincide with the reference shapefile (Figure6). If the selected coordinate system enables the shapefile to fit with the reference shapefile, it is ready for geo-database (Figure2). If not, proceed to next step.
Step 9. Select the reference point in the shapefile, one that is easily discernible, such as road intersections or familiar places.
Step 10. Locate the same point in Google Earth. Extract the coordinates and then plot that point in ArcMap. This becomes the control point. Return to the Modification window and adjust the parameters accordingly so the two reference points will coincide. Once the two points coincide, stop modification.
Step 11. Convert the shapefile into Google Earth format. Check for accuracy by matching the shapefile’s features in the satellite imagery. If the features fit to an acceptable degree based on the purpose the map, save the modification and add to the list (Figure7). If not, proceed to the next step.
Step 12. For higher accuracy, use ArcMap’s Affine Transformation in the Spatial Adjustment tool (Figure8).
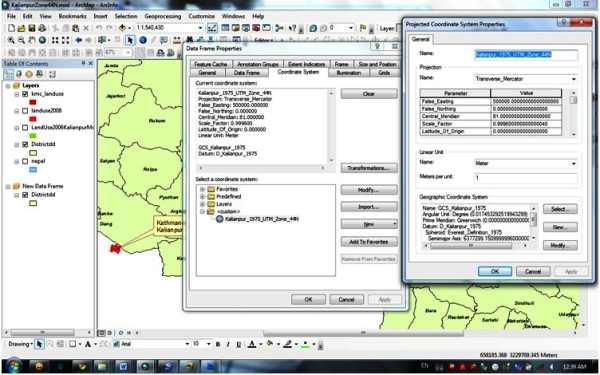
Figure 6: modification of Coordinate systems in Data Frame Properties
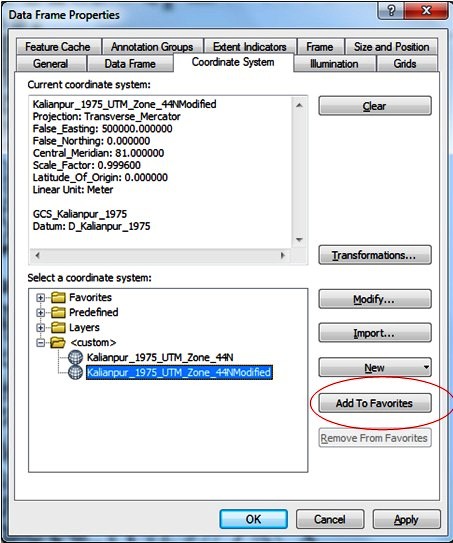
Figure 7: Adding to the list in data frame properties
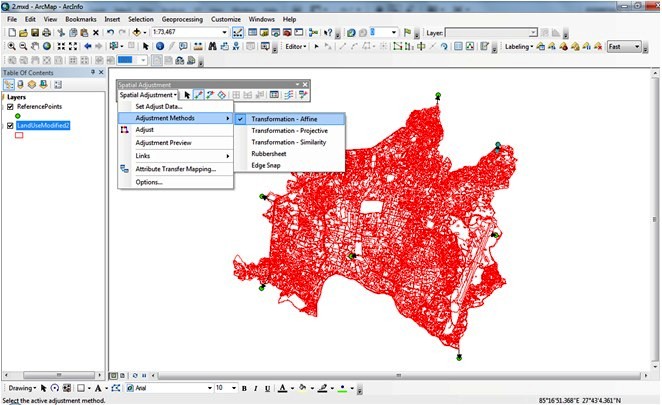
Figure 8: Spatial adjustment method of the shapefile with control points
Integrating Satellite and GIS Data
Once the shapefiles are adjusted, the satellite and GIS can be integrated towards Risk Sensitive Land Use (RSLU) and Emergency Escape Route (EER) planning.
Mechanism Towards RSLU Planning
Step 1. Plot the adjusted proposed development areas shapefile in ArcMap to select the priority area for a particular development e.g., residential.
Step 2. Export the adjusted shapefile to Google Earth to validate if the proposed areas are still suitable for proposed development.
Step 3. Update the shape file based on the new information extracted from the satellite imagery.
Mechanism Towards EER Planning
Step 1. Delineate an area of study.
Step 2. Upload the adjusted shapefile of critical facilities (e.g. hospitals) to Google Earth.
Step 3. Update the road shapefile by digitizing on Google Earth.
Step 4. Identify vacant areas as Emergency Crisis Centers during disasters.
Step 5. Export the roads and Emergency Crisis Centers back to ArcMap for network analysis.
Step 6. Export back to Google Earth for overlay on real-time satellite imagery.
Implementation and application of procedure
Planners need to rely on the mandated guidelines for more realistic plans especially for RSLU and the development of EER plans. A number of important aspects should be taken into consideration to ensure the proper planning and implementation of possible safety measures in the event of disasters.
Therefore, many countries provide a comprehensive, step-by-step process for the preparation of plans at all levels—from municipal to provincial to regional and national. A guideline at city/municipality level, “A Guide to Comprehensive Land Use Plan Preparation” brings to fore the importance of analyzing the current situation of a given planning area. Part of the analysis involves technical and participatory methods (4). For instance, sieve mapping allows for a systematic assessment of the landscape and condition. This is a prerequisite for setting the goals and objectives of the planning area, which directs the identification of development thrust and spatial strategies, and the preparation of corresponding land use plans.
It is therefore prudent to validate the geo-referencing and actual land uses of the planning area. Several techniques may be employed here. The methodology developed in this study emphasizes the use of satellite imagery and GIS technology to derive and analyze land use data. It intends to address incorrect geo-referencing and unidentified projection/coordinate systems, leading to inappropriate decision-making, potentially endangering the environment, infrastructure, and human lives.
Identification and Modification of Coordinate Systems
Following is the output of the procedure described above using the shapefile of proposed land use in 2001from KMC (5).
The Kathmandu City shapefile is selected to identify appropriate coordinate systems from available list in ArcGIS. The selection of the system that best fits the reference shapefile used elimination method. It was found out that the best fit among the known coordinate systems is the Kalianpur 1975 UTM Zone 44N. However, it locates KMC off by about 3° longitude to the west and 10” to the south (Figure9).
The chosen system’s parameters were then modified by visual inspection on reference shapefiles. This changed the false_easting to 210,000 and the latitude_of_origin to 0.2 (Figure10).
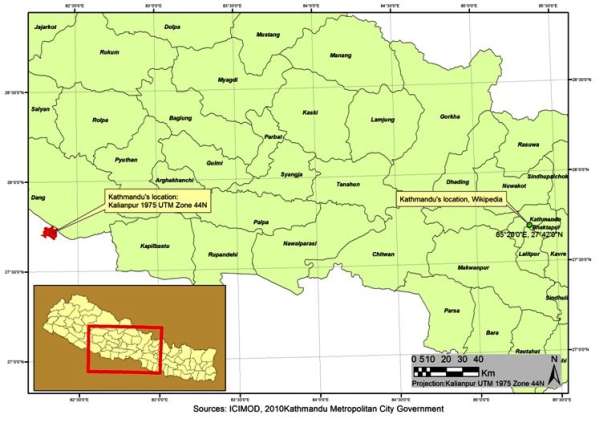
Figure 9: Kalianpur 1975 UTM Zone 44N relative to the reference shapefile
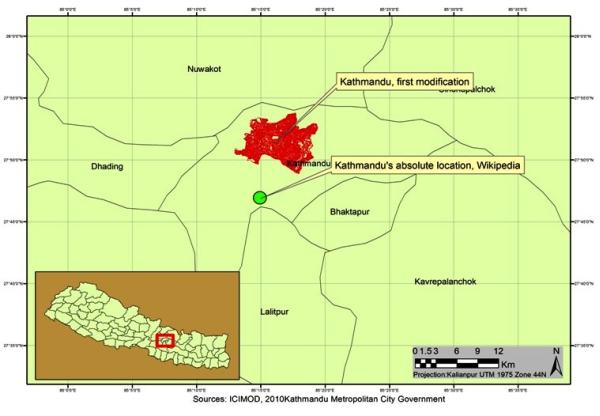
Figure 10: First modification output
Further modification was necessary to improve accuracy vis-à-vis geo-referenced points. One was extracted from Google Earth (Figure11).
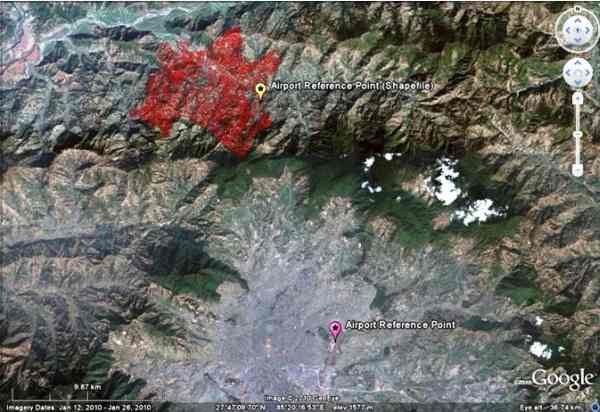
Figure 11: Reference point from Google Earth
Based on the reference point, parameters were adjusted. The false_easting and standard_parallel_1 were modified to -8491750.00 and 16.191700, respectively (Figure12).
This increased the accuracy, but it still has approximately 400m offset at different parts of the area. To achieve even higher accuracy the shapefile was transformed using ArcMap’s Affine Transformation in the Spatial Adjustment tool (Figure13).This further decreased the offset leaving approximately 150 meters discrepancy elsewhere.
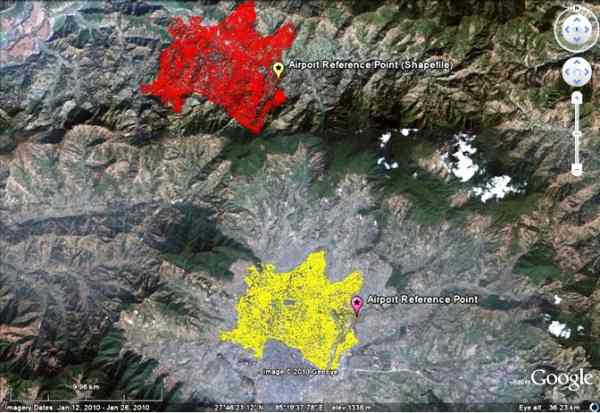
Figure 12: Two modifications of Kalianpur 1975 UTM Zone 44N. Red is the first modification and yellow is the second modification.
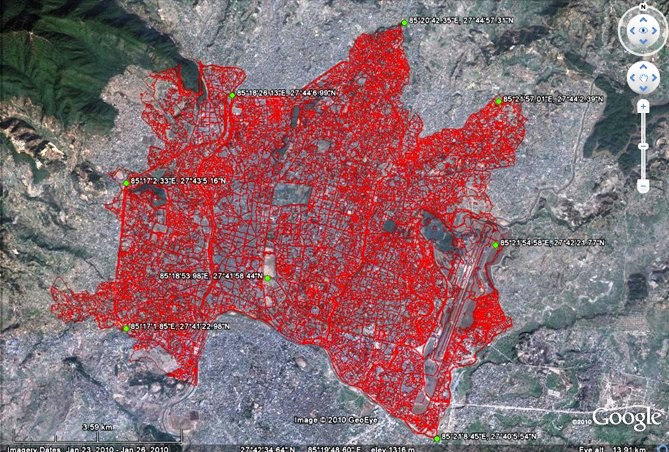
Figure 13: Final transformation using the Affine adjustment.
Application 1: GIS and Satellite Imagery for RSLU Planning
Following is the output of the step-by-step procedure described above, using the adjusted shapefile of proposed development areas by Earthquake Disaster Mitigation in the Kathmandu Valley, 2002 (6) (Figure14).
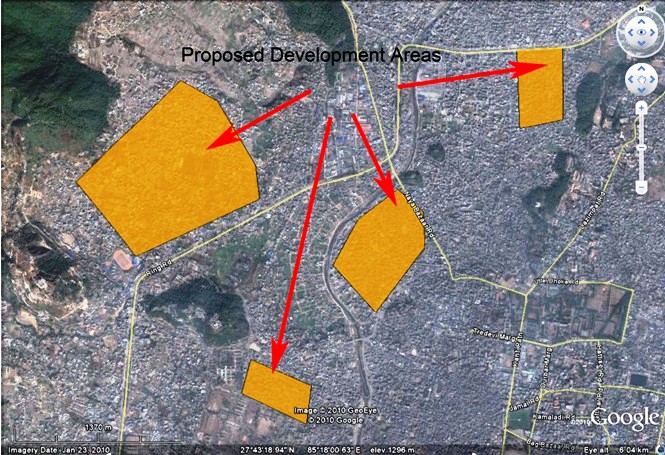
Figure 14: Zoom in of proposed development areas for updates
Application 2: GIS and Satellite Imagery for EER Planning
Following is the output of the procedure described above, using the adjusted shapefile of critical facilities and roads KMC 2002 (7) (Figure15).
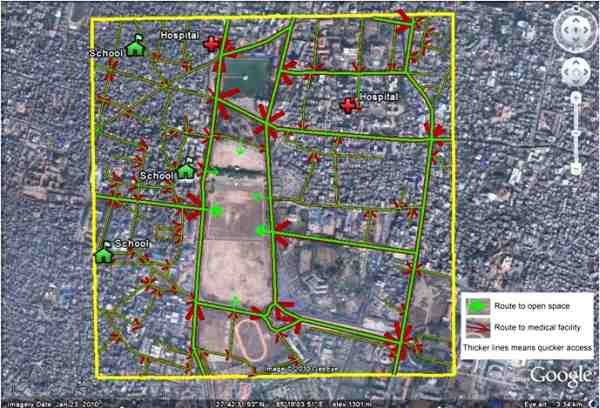
Figure 15: EER example
Conclusion and recommendations
The methods used in adjusting shapefiles are simple enough for those without sufficient training in geodesy but are capable of operating GIS software. This simplicity comes with the trade-off of accuracy. Davis, et. al. (1991) warn of various trade-offs including the imposition of thematic map errors and remote sensing measurements. In this study, the level of precision achieved may be sufficient for planning and analyses at larger levels, such as city/municipality, provincial, regional and national levels. For larger scale implementation, i.e. ward, village, or barangay level programs, projects and activities, there is a need to have detailed groundtruthing for higher levels of accuracy. Furthermore, the methods used are very cost effective, saving logistics expenses for field workers.
Further studies are recommended to gather more empirical data to refine and develop the methods used in this paper.
Acknowledgements
The authors are grateful to Earthquakes and Megacities Initiative, Inc, German Federal Foreign Affairs Office, and the Kathmandu Metropolitan City Office for the development of the Mainstreaming Disaster Risk Reduction in Megacities: A Pilot Application in Metro Manila and Kathmandu: Risk-Sensitive Land Use Plan, Kathmandu Metropolitan City, Nepal. This work gave the authors the opportunity to explore this study.
They are also grateful to the Philippine School of Business Administration for the logistics and resources.
Gratitude is also extended to Harold A.M.P. Lim and other individuals and organizations who contributed in one way or another in the development of this paper.
References
- S.Gurung, Modeling the dispersion of vehicular carbon-monoxide (CO) pollutionin Kathmandu valley, Nepal:A CALINE4 approach combined with GIS Techniques. University of Calgary. (2010).
- K.Poudel. The thread of Space, Time, and Event: An Implication in Media Studies, Bodhi, 3(1), 92-98. Kathmandu University. (2009).
- F.Davis, et.al. Environmental analysis using integrated GIS and remotely sensed data: some research needs and priorities. Photogrammetric engineering and remote sensing. No.6, vol 57.pp 689-697 (1991).
- Housing and Land Use regulatory Board, A Guide to Comprehensive Land Use Plan Preparation, New Edition, Volum I, pp. 38, 200. Philippines. (2006).
- Kathmandu Metropolitan City Office
- Japan International Cooperation Agency and the Ministry of Home Afairs of Nepal. The Study on Earthquake Disaster Mitigation in the Kathmandu Valley, Kingdom of Nepal, Volume III. (2002).
- T. Pradhan. Kathmandu Metropolitan City GIS Office. (2006).
- F.W. Davis et al. Ibid.
The UN-SPIDER Network and its activities
The UN-SPIDER Network and its activities
Activities of the United Nations Platform for Space-based Information for Disaster Management and Emergency Support (UN-SPIDER) Regional Support Office in Nigeria for 2009/2010
Activities of the United Nations Platform for Space-based Information for Disaster Management and Emergency Support (UN-SPIDER) Regional Support Office in Nigeria for 2009/2010
Godstime K. James and Halilu A. Shaba, UN-SPIDER Regional Support Office in Nigeria, Space Applications Department, National Space Research and Development Agency, Abuja, Nigeria.
Introduction
Disasters have been around for a while, dating back to the early human civilization. According to Niekerk (2007), some of the earliest contributions to the field of disaster science were from Carr (1932), Sorokin (1942), Eldenman (1952), Quarantelli (1954 and 1957), Moore (1956), Fritz and Williams (1957), Drabek and Quarantelli (1967), Doughty (1971), Hewitt and Burton (1971), Kreps (1973), Westgate and O'Keefe (1976), Jager (1977), Torry (1978), and Turner (1978). Today, natural and human induced disasters have continued to claim lives and properties in different parts of the world. While naturally induced disasters such as earthquakes, tsunamis, hurricanes, and landslides are driven by natural processes, human induced disasters such as oil spills, air pollution, chemical and biological disasters are caused by anthropogenic activities.
It is of course possible to manage disasters by (i) minimizing potential risks through the development of disaster early warning strategies, (ii) preparing developmental plans to provide resilience to such disasters, (iii) mobilizing resources including communication and e-health services and (iv) helping in rehabilitation and post-disaster reconstruction (Jayaraman et al., 1997). In addition, studies have shown that natural and human induced disasters transcend geographic boundaries. For example, the 2004 Tsunami in South-East Asia affected Indonesia, India, Malaysia, Myanmar, Sri Lanka, Somalia, and Thailand. Furthermore, the effects of disasters are more pronounced among the poor in developing countries. 94.25% of all people killed by disasters from 1975 to 2000 were low income or lower-middle income earners (Briceño, 2008). Consequently, in its resolution 61/110 in 2006, the United Nations General Assembly decided to establish the programme “Platform for Space-based Information for Disaster Management and Emergency Response” (UN-SPIDER), to provide universal access to all countries (especially developing countries) and relevant international and regional organizations to space-based information and services relevant to the full disaster management cycle.
The Regional Support Office in Nigeria
The UN-SPIDER Regional Support Offices (RSO) constitute one of the organizational frameworks for the implementation of UN-SPIDER activities. One of the reasons for adopting a regional organizational framework is to harness regional strengths in space based disaster management and emergency response. The UN-SPIDER Regional Support Office in Nigeria is hosted in the National Space Research and Development Agency (NASRDA), Abuja, Nigeria. It was established in 2008 through an agreement between NASRDA (Nigeria) and the United Nations Office for Outer Space Affairs (UNOOSA)
Activities of the Regional Support Office in Nigeria in 2009
The activities of the RSO for 2009 were focused on the implementation of the work plan approved by the United Nations General Assembly for the biennium 2008-2009 (A/AC.105/929). They include: systematic compilation of all available relevant information; ensuring that relevant information is easily accessible and disseminated to all interested end-users; awareness-raising; outreach activities; support to national activities; support to the establishment of national disaster management planning and policies; and support to capacity-building.
Ensuring that relevant information is easily accessible and disseminated to all interested end-users
One of the fastest means of information accessibility and dissemination is through the web. As a result, the RSO developed a web portal for information dissemination (www.unspider-ng.net). The web contents include: functions and goals of the RSO; contact details for staffs of the RSO; links to other UN-SPIDER websites; information on upcoming UN-SPIDER events; provisions for building community of practice using blogging mechanism; links to capacity development sites for capacity development in space technology in Africa; links to relevant stakeholders in disaster management and emergency response in Africa.
Awareness-Raising
The successful implementation of the UN-SPIDER programme is based on the successful creation of programme awareness. The goal of the awareness-raising efforts is two-folds; first, to educate disaster managers on the role of space technology in the management of the entire disaster cycle, and second, to show the various sources of such space-based technology. Consequently, the RSO participated in the workshop for ECOWAS disaster risk reduction working group organized by the ECOWAS commission in Abuja from March 18th to 19th 2009. During the workshop, the RSO representative (Dr. Godstime James) met with the representatives from the disaster risk reduction offices in Ghana, Togo, Senegal, Cote d’Ivoire and Cape Verde. The representatives were briefed on the activities of the RSO (Figure 1). One of the spin-offs from the awareness campaign was the invitation from the Government of Togo to UN-SPIDER for a Technical Advisory Mission (TAM).
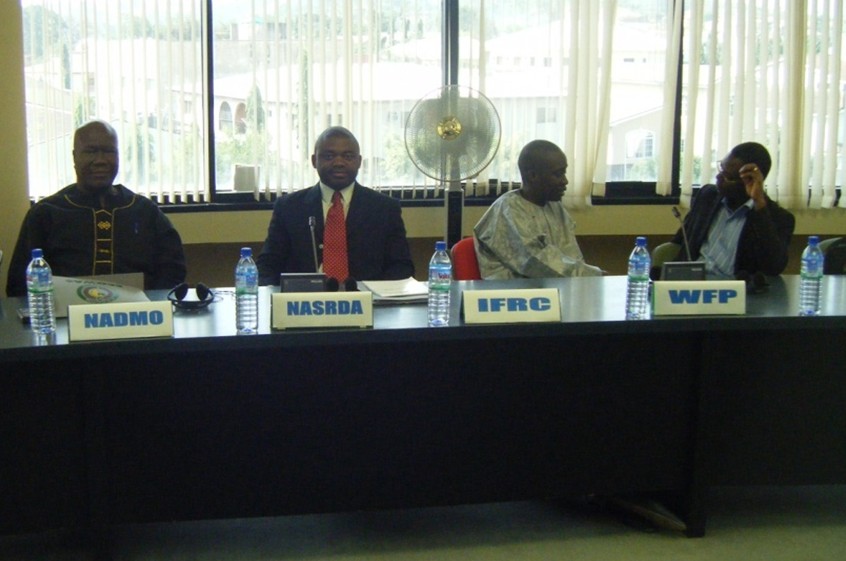
Figure 1. (L-R). Mr. Ebenezer Portuphy (National Coordinator, NADMO, Ghana), Dr. Godstime James (Manager, UN-SPIDER, NASRDA), Mr. Amadou Ndiaye (Programme Coordinator, National RRC, Senegal), and Mr. Hounkpe Koffi (Focal Point for DRR Togo) during the ECOWAS DRR meeting in Abuja.
Outreach Activities
An outreach activity is the platform within which the UN-SPIDER programme facilitates the participation of disaster managers and space-based information service providers in the activities of UN-SPIDER or its affiliates. As a result, within the framework of the outreach activities, the RSO was involved in the following outreach programmes:
Development of MOU with ECOWAS
The Economic Community for West African States (ECOWAS) plays a major role as a link to West African countries for disaster risk reduction and management. In recognition of the contribution of the RSO to disaster management within the ECOWAS sub-region, representatives of the ECOWAS commission, Abuja, visited the RSO on the 25th of February 2009. The visitors initiated the development of a Memorandum of Understanding (MOU) between NASRDA and ECOWAS to facilitate joint outreach activities in disaster management within the region. A draft of the MOU has been prepared by NASRDA, vetted by the legal department of NASRDA and sent to ECOWAS for inputs. The final version of the MOU will be signed by the Director General/Chief Executive of NASRDA and the President of the ECOWAS commission in Abuja.
Participation in UN-SPIDER workshops and meetings
For proper coordination of UN-SPIDER activities in the regional support offices, the UN-SPIDER staff in Vienna and Bonn organizes a series of meetings and workshops. The RSO participated in the “UN-SPIDER Stakeholders Meeting”, held in Vienna from 10th to 11th February 2009 (Figure 2).

Figure 2. (L-R). Mr. Tony Young Lyu (UN-SPIDER-Vienna), Dr. Godstime James, (Manager, RSO-Nigeria), and Mr. David Stevens (Coordinator, UN-SPIDER-Vienna) during the presentation of the 2009 RSO-Nigeria activities in Vienna.
Similarly, the RSO participated in the Third United Nations International UN-SPIDER Bonn Workshop titled "Disaster Management and Space Technology - Bridging the Gap", held in Bonn, Germany from 21st to 23rd of October 2009. During the workshop, the RSO representative presented a paper documenting the role of Telemedicine in Disaster Management in Nigeria.
Participation in the International Charter: Space and Major Disasters Authorised User Training
One of the sources of satellite data for disaster management and emergency response is the International Charter: Space and Major Disasters (Charter). The goal of the Charter is to provide a unified system of space data acquisition and delivery to those affected by natural or man-made disasters through Authorized Users. Consequently, the Charter Authorised User Training was organized by the Disaster Monitoring Constellation international imaging (DMCii), Limited in collaboration with the Nigerian National Emergency Management Agency (NEMA) in Abuja. The RSO (represented by Mr. Zubair Opeyemi) participated in the workshop from the 25th to 26th of March, 2009.
Support to National Activities
The National Focal Point (NFP) is the primary contact of the UN-SPIDER Programme. An NFP is a national institution, nominated by the Government of the respective country, representing the disaster management and space application communities (A/AC.105/929). The primary role of NFPs is to work with UN-SPIDER to strengthen national disaster management planning and policies and implement specific national activities that incorporate space-based technology solutions in support of disaster management and emergency response. One of the efforts by the RSO to promote the establishment of NFPs has been to reach out to the countries in the West African region and encourage them to consider identifying an NFP in their country. For example, the National Emergency Management Agency in Nigeria was encouraged to become an NFP for Nigeria. Similarly, Togo and Cameroon were encouraged to also nominate one.
Capacity Building
Capacity development is a major requirement for the optimum utilization of space-based information for disaster management and emergency response. Similarly, the acquisition, processing and transfer of knowledge in space applications for disaster management is essential for the success of UN-SPIDER. Hence, the RSO is currently compiling available resources for capacity development in space applications for disaster management. This is an ongoing process and a list of relevant training institutions are posted on the RSO website. Similarly, the RSO will soon commence with the development of e-learning modules for disaster management using space technology, for integration in the RSO portal.
Support to the establishment of national disaster management planning and policies
The implementation of space-based approach to disaster management is facilitated through the initiation of appropriate planning and policies. Therefore, one of the approaches adopted by UN-SPIDER is technical advisory support to countries that request such support. UN-SPIDER has conducted technical advisory missions to Burkina Faso, Ghana, Namibia and Togo. The RSO supported the Togo mission (Figure 3).
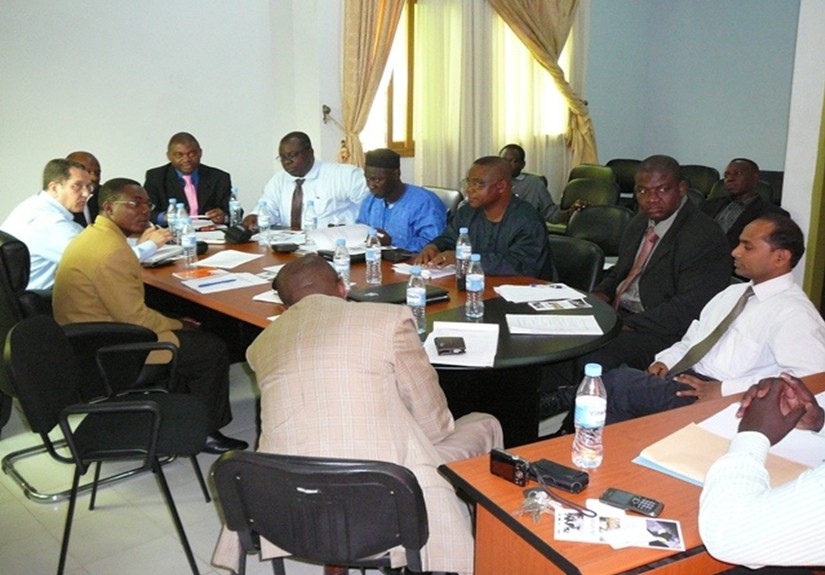
Figure 3. Consultative meeting between TAM team and Local Organizers in Lome, Togo.
Activities of the Regional Support Office in Nigeria in 2010
The activities of the RSO for 2010 are derived from the work plan approved by the United Nations General Assembly for the biennium 2010-2011 documented in A/AC.105/937. The activities implemented are awareness-raising, outreach activities, capacity development, cooperation, knowledge management and transfer, knowledge portal development, support at the national level.
Awareness-Raising
Two major activities were scheduled for 2010. The first was the updating of the RSO website (www.unspider-ng.net) with a Regional Knowledge Portal (RKP). The development of the knowledge portal is a continuous effort. The goal for developing the knowledge portal is to disseminate information on the management of the full disaster cycle using space technology. A segment of the knowledge portal will be dedicated to the exchange of ideas as well as reach-out to the community of practitioners in disaster management. The knowledge portal will consist of news feeds on disaster management, case studies showcasing how space technology was applied in addressing disaster management in Africa, information on access to free space-based data for disaster management (e.g. procedures for invoking the Charter), and links to e-learning tools.
Participation in conferences and space related events is also envisaged. The RSO plans a major awareness-raising event for the 8th Session of the African Association for Remote Sensing of the Environment in Addis Ababa slated for October 25th to 29th 2010.
Outreach Activities
Within the scope of outreach activities, the RSO participated in the following events organised by UN-SPIDER: UN-SPIDER meeting in Vienna from 9th to 12th of February 2010; and Regional Workshop "Building Upon Regional Space-based Solutions for Disaster Management and Emergency Response for Africa, Addis Ababa, Ethiopia, from 6th to 9th July 2010; Fourth United Nations International UN-SPIDER Bonn Workshop on Disaster Management and Space Technology: “The 4C – Challenge: Communication – Coordination – Cooperation – Capacity Development”, Bonn, Germany, from 12th to 14th October 2010.
Capacity Building
Capacity development is a critical component of the activities of the RSO for 2010. As a result, the RSO participated in the following capacity development activities: project Management Training Course for the Charter organised by NEMA and facilitated by DMCii and United States Geological Survey from the 9th to 11th of February 2010; mock activation exercise for Charter on 19th May 2010; course on SARTrix High and Medium Resolution TerraSAR-X Imagery Analysis from June 7th to 18th 2010 organized by NASRDA and facilitated by Terra SAR X Services and Infoterra (an EADS Astrium Company).
Platform for Ensuring Cooperation
A major cooperation for 2010 is between the RSO and NEMA during disaster response activities in Nigeria. In particular, the RSO visited the site of the extensive flooding in Northern Nigeria in September 2010. Following the flood disaster, NEMA activated the Charter. Consequently, the RSO collaborated with NEMA for the processing of the radar image provided during the Charter activation.
Support at the National Level
The RSO provided support to NEMA for the review of the draft Nigerian National Disaster Management Framework. In particular, the RSO recommended the inclusion of space-based approach to disaster management. In addition, the RSO participated in the review of methods for Flood Mapping in Nigeria. Finally, the RSO facilitated the enlisting of NEMA as the UN-SPIDER National Focal Point for Nigeria.
Conclusion
Space-based approach to disaster management is still at its infancy stage. However, application cases have shown that the approach is efficient and cost effective, most especially when a large area is concerned. UN-SPIDER is creating the much-needed awareness on what can be done from space when managing disasters. One of the frameworks for achieving this goal is the use of regional support offices. Although the regional support office in Nigeria was established in 2008, it had tremendous achievements. Some of the achievements include support for technical advisory missions, development of an operational office, participation in outreach activities, awareness-raising, and ensuring that relevant space-based information for disaster management and emergency response is easily accessible and disseminated to all interested end-users.
References
- A/AC.105/929. Report on activities carried out in 2008 in the framework of the United Nations Platform for Space-based Information for Disaster Management and Emergency Response. Committee on the Peaceful Uses of Outer Space, United Nations General Assembly, 14th January 2009.
- A/AC.105/937. United Nations Platform for Space-based Information for Disaster Management and Emergency Response: Workplan for the biennium 2010-2011. United Nations General Assembly, 27 April 2009.
- Briceño, Sálvano 2008. Linking Disaster Risk Reduction and Poverty Reduction. Good Practices and Lessons Learned. A Publication of the Global Network of NGOs for Disaster Risk Reduction. URL: http://www.unisdr.org/eng/about_isdr/isdr-publications/14_Linking_Disaster_Risk_Reduction_Poverty_Reduction/Linking_Disaster_Risk_Reduction_Poverty_Reduction.pdf
- Carr, L.J. 1932. Disasters and the Sequence-Pattern Concept of Social Change. American Journal of Sociology 38, Pp. 207-218.
- Drabek, T.E. 1991. The Evolution of Emergency Management. In Drabek, T.E. and Hoetmer, G.J. (Eds.), Emergency Management: Principles and Practice for Local Government, ICMA, Washington DC, Pp. 3-29.
- Drabek, T.E. and Quarantelli, E.L. 1967. Scapegoats, villains and disasters. Transaction 4. Pp. 12-17.
- Doughty, P. 1971. From disaster to development. Americas 23. Pp. 23-35.
- Eldenman, R. 1952. An approach to the study of disaster. (unpublished paper).
- Fritz, C. and Williams, H. 1957. The human being in disasters: a research perspective. Annals 309. Pp. 42-51.
- Hewitt, K. and Burton, I. 1971. The hazardousness of a place: a regional ecology of damaging events. Toronto: University of Toronto University Press.
- Jager, W. 1977. Katastrophe und Gesellschaft: Gundlegungen und Kritik von Modellen der Katastrophensoziologie. Darmstadt: Luchterhand.
- Jayaraman V., M. G. Chandrasekhar and U. R. Rao 1997. Managing the natural disasters from space technology inputs. Acta Astronautica, 40 (2-8), Pp. 291-325.
- Kreps, G. 1973. Decision making under conditions of uncertainty: Civil disturbance and organizational change in urban police and fire departments. Newark: Disaster Research Centre, University of Delaware.
- Moore, H. 1956. Towards a theory of disaster. American Sociological Review 21. Pp. 734-737.
- Niekerk, Dewald Van 2007. Disaster Risk Reduction, Disaster Risk Management and Disaster Management: Academic Rhetoric or Practical Reality? Journal of the Disaster Management Institute of Southern Africa, 4(1), Pp. 6-9.
- Quarantelli, E.L. 1954. The nature and conditions of panic. American Journal of Sociology 60. Pp. 267-275.
- Quarantelli, E.L. 1957. The behaviour of panic participants. Sociology and Social Research 41. Pp. 187-194.
- Quarantelli, E.L. (Ed.). 1998. What is a disaster? Perspectives on the question. London: Routledge.
- Sorokin, P. A. 1942. Man and Society in Calamity: The Effects of War, Revolution, Famine, Pestilence upon Human Mind. New York: Dutton.
- Torry, W. 1978. Natural disasters, Social structures ad changes in traditional societies. Journal of Asian and African Studies 13. Pp. 167-183.
- Turner, B. 1978. Man-made disasters. London: Wykeham.
- Westgate, K.N. and O'keefe, P. 1976. Some definitions of disaster. Bradford: Disaster Research Institute, University of Bradford.
Contact
Godstime James
Email: godstimej [at] gmail.com
Capacity-building in Earth Observation and Geo-information science – A bridge to knowledge for disaster management in Africa
Capacity-building in Earth Observation and Geo-information science – A bridge to knowledge for disaster management in Africa
Keita Mahamadou S., Deputy Executive Director, Regional Centre for Training in Aerospace Surveys (RECTAS), Ile-Ife, Nigeria
Abstract
Advances in space and information technologies have positively impacted on critical capacity globally through availability of geospatial information technology tools. To be fully utilised however, the space and information technologies must be understood by skilled manpower in Africa to tackle the major challenges in disaster management.
In Africa, the majority of the professionals and technicians in different organisations involved in geospatial information activities have not been making full use of data and tools to manage and alleviate the consequences of natural disasters due to low proficiency in the space technologies. Today there is increasing demands of well-trained staff at all levels, to face the main challenges of disaster management and emergency response. Therefore, it became necessary to provide training and capacity-building in the use of space- and information technologies for different levels of professionals involved in disaster management. This is for the benefit of communities affected by different kinds of hazards. It will involve exchanges and communication between experts and development partners on one hand, and experts and local communities who must also understand and value the use of space technologies to solve their problems, on the other hand.
This paper examines the constraints for manpower development in space- and geo-information technology to tackle numerous disasters occurring in Africa (flood, drought, windstorm, wild fire, famine, epidemic, etc...). The role of capacity-building by training institutions like the Regional Centre for Training in Aerospace Surveys (RECTAS), Ile-Ife, Nigeria in improving the situation and facing the main challenges is emphasized and case studies presented.
Introduction
The impact of natural disasters on the global environment has become increasingly severe over the last decades. The reported number of disasters has risen dramatically, as well as the number of people affected and the cost to global economy. About 95% of the deaths due to disasters occur in developing countries. (Kufoniyi, 2007). While natural disasters have drastically increased in magnitude and frequency, the possibilities of improving the technical capability to mitigate them have also dramatically increased.
Through the current initiatives in and outside Africa, it can be observed that the future orientation of space- and geo-information activities is that they must be available for people who need them for various applications and decision making. The advances in space technology (specifically earth observation satellite technology), with high spectral resolution data has increased the potential of these tools in all scientific and social areas. In disaster management, space-based technologies are used to monitor the environmental situation at certain intervals and to carry out risk analysis by combining the data with detailed local knowledge about the area in combination with geographic information. Therefore, there is a need for pro-active capacity development in all aspects of earth observation and geo-information production, management and use in Africa in order to address the huge capacity gaps. It will require the development of a critical mass of skilled human resources, organisational reforms, technological capacity and institutional strengthening.
The paper presents some important aspects of capacity-building in earth observation and geo-information science that are essential to overcome the challenges of disaster mitigation and emergency response. Recent developments and initiatives are presented. The role and contributions of RECTAS, a regional training-- and research institution in West-Africa, are also highlighted. Recommendations are then advanced to face the challenges of man-power development for disaster management in Africa.
Capacity-building in Earth Observation (EO) and geo-information science
Capacity-building encompasses improvement in the country’s human, scientific, technological, organizational, institutional and resource capabilities. A fundamental goal of capacity-building is to enhance the ability to evaluate and address the crucial questions related to policy choices and modes of implementation among development options, based on an understanding of environment potentials and limits and of needs perceived by the people of the country concerned. (Ayeni, 2008).
The components of capacity-building
The main components of capacity-building are the following:
- Human resource development, the process of equipping individuals with the understanding, skills and access to information, knowledge and training that enable them to perform effectively;
- Organizational development, the elaboration of management structures, processes and procedures, not only within organizations but also the management of relationships between the different organizations and sectors (public, private and community);
- Institutional and legal framework development, making legal and regulatory changes to enable organizations, institutions and agencies at all levels and in all sectors to enhance their capacities.
Capacity-building for the production, management, dissemination and use of geo-information is therefore of immense importance, which requires focused and concerted efforts towards strengthening of national and regional capacity-building institutions including harmonization of methods and concepts.
In the context of human capacity-building, three major groups have been identified as having critical needs of geo-information capabilities:
- Experts in the field of spatial information handling (or specialists in certain aspects of this field);
- Users of space-based technology and geo-information and
- Professionals and policy makers (to enable them to know the importance of geo-information for policy formulation).
Role of capacity-building in disaster management
Training and capacity-building in Earth Observation and Geo-information Science for disaster management / disaster risk reduction will help the experts and stakeholders in the following areas:
- Understand the hazard (where and when and why it is likely to occur);
- Know which areas and communities are most vulnerable to hazards, and what capacities and capabilities are available to cope with disasters;
- Develop knowledge and information resources to enable the risks to be better identified and potential impacts to be adequately assessed;
- Ensure political commitment to disaster risk reduction at various levels, through policy development, legislation, organizational development and promoting community action',
- Increase education and raise awareness of the risks and motivate for changes in collective behavior to reduce risks;
- Understand and take action to mitigate or relieve the socio-economic conditions that create or increase the vulnerability of a community;
- Implement environmental management, physical and technical measures to reduce risks to communities;
- Increase the coping capacity of communities through better communication, improved resources, etc;
- Have a disaster preparedness plan in place. This plan should cover both emergency management and recovery from a disaster;
- Develop hazard monitoring systems and early warning indicators.
Current developments in space- and geo-information capacity requirements
Different issues and events have brought up the need for capacity development efforts in Africa. These include increasing interest of African countries in Space Science and Technology development, National Geospatial Data Infrastructures and National Disaster Management.
- In Space Science and Technology Development, African countries have been involved in the launch of their own earth observation satellites: AlSat-1 (2002) by Algeria and NigeriaSat-1 (2003) by Nigeria. In addition, there has been a significant increase in the awareness of decision makers and civil society in the applications of earth observation satellite data and Geographic Information Systems (GIS). It is essential to match these developments with the manpower development in the applications in disaster reduction and emergency responses (UNECA, 2010).
- In the area of Geospatial Data Infrastructure (GDI), the need for provision of skilled manpower, organisational capacity and institutional reforms has been recognised and is being pursued vigorously now. A good number of countries have already adopted their fundamental datasets and developed their National Spatial Data Infrastructures and Spatially Enabled Government Services with the support of the United Nations Economic Commission for Africa (UNECA) and other partners. To further underpin the importance of capacity-building, the National Geo-information Policies made provision for a training component for all projects, research on new innovations in geoinformatics and its various applications, training in Spatial Data Infrastructure (SDI) concepts, among others.
- In the area of Disaster Management, the strategies developed require to close the gaps for manpower capacity-building. An important role is being played by the United Nations Office for Outer Space Affairs (UNOOSA), through its UN-SPIDER Programme (United Nations Platform for Space-based Information for Disaster Management and Emergency Response) in building capacity and increasing the awareness in the use of space technology for disaster management and emergency response.
- African Geodetic Reference Frame (AFREF), the UNECA continues to work with partners to implement the AFREF programme. The activities include group meetings, workshops and capacity-building to adopt the correct methodologies for the future of AFREF.
RECTAS’ contributions
The Centre and its activities
The Regional Centre for Training in Aerospace Surveys (RECTAS) was established in 1972 under the auspices of the United Nations Economic Commission for Africa (UNECA) to undertake training and research in Geoinformation Science for the manpower needs of African nations. It is situated in the campus of the Obafemi Awolowo University (OAU), Ile-Ife, Nigeria. Currently, the participating member countries are Benin, Burkina Faso, Cameroon, Ghana, Mali, Niger, Nigeria and Senegal.
The main mission of the Centre is to contribute to rapid sustainable development of member states in particular and Africa in general, through the development of critical capacity for timely delivery and responsible use of appropriate geospatial information.
The objectives of the Centre are:
- To provide theoretical and practical training in the field of Geoinformatics, including in particular, photogrammetry, remote sensing, cartography, Geographic Information Systems (GIS) and their applications in geospatial surveys, environmental studies, mapping, natural resources management, etc.
- To conduct seminars, workshops and short courses with a view to providing an opportunity for dissemination of information in the field of Geoinformatics
- To carry out studies and research in the field of Geoinformatics and
- To provide advisory and consultancy services in Geoinformatics and other related areas
From inception in 1972 to date, the Centre has trained 1522 students from 28 African countries (Ikhuoria, 2010). RECTAS has conducted many studies and research, capacity-building and projects execution in different areas of specialisation including disaster management in the participating countries as well as in other countries in Africa. In collaboration with different institutions and partners, the following activities were undertaken:
- Refresher courses in Disaster Management, organised jointly by RECTAS/Nigeria and ITC/Netherlands;
- Short Term Training course in the use of Remote Sensing and GIS in Disaster Management for staff members of the National Emergency Management Agency (NEMA), Nigeria;
- Customised training in Remote Sensing and GIS for staff members of Nigerian Geological Survey Agency (NGSA);
- Customised training in Remote Sensing for staff members of National Space and Research and Development Agency (NASRDA);
- Customised training in GIS and Digital Cartography for Staff members of the National Population Commission (NPopC), Nigeria;
- Participation in UN-SPIDER technical assessment missions and workshops (Abuja, Vienna, Lome, Dakar, etc...);
- Contribution to the activities of the Marine Pollution Monitoring Project in Nigeria;
- Participation in ECOWAS Early Warning workshops in Accra (Ghana) and Dakar (Senegal);
- Organisation of AFREF Experts’ group meeting at RECTAS, Ile-Ife, Nigeria.
Case-studies on disaster management by RECTAS
The following show some case studies by students and staff of the RECTAS:
- Exploration of Remote Sensing and GIS Technology for early Warning in Bush Fire in Benin Republic;
- Use of GIS in Conflict and Crisis Management;
- Monitoring of Desertification in West Africa Using Remote Sensing and GIS techniques
- A GIS approach for prevention and management of flood in Cotonou / Benin Republic
- Identification of flooded areas in Sokoto state in Nigeria using recent Radarsat-2 data (September 2010) – This was undertaken following the flood that occurred in Sokoto state this year. A Radasat-2 scene was downloaded at RECTAS. The result shows the situation of the area viewed by Landsat ETM+ and overlay of flood areas identified with the interpretation of the Radarsat-2 image.
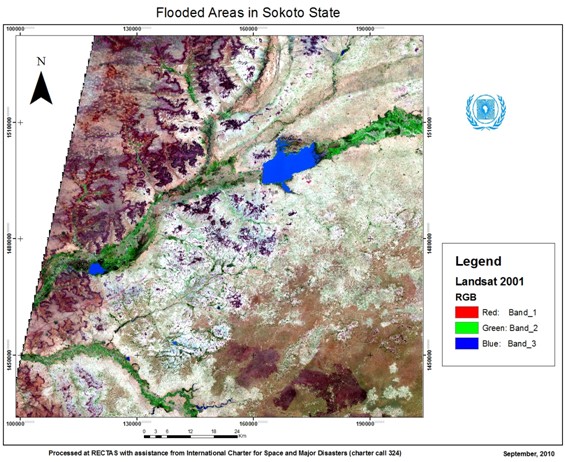
Figure 1: Landsat view of the area under investigation
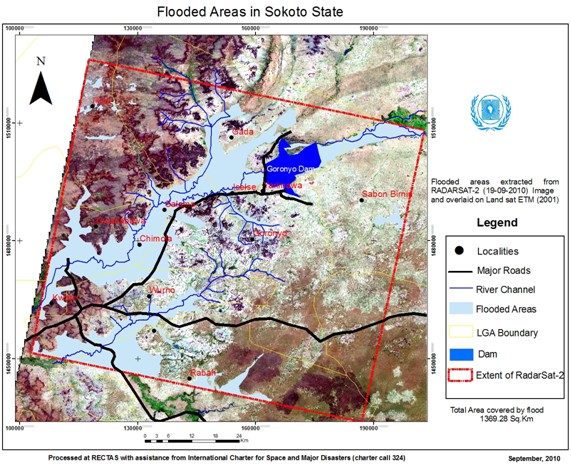
Figure 2: Flooded areas detected by Radarsat-2 (September 2010)
Conclusion and recommendations
This paper particularly emphasizes the use of remotely-sensed data and the access to space-based technology for assessing and monitoring natural hazards. Enhancing the skills in interpreting multi-temporal, multi-date and multi-sources input data has been considered as a priority for developing countries. The relevant data should be made available to communities for early warning and emergency response, mostly to those affected by the major and frequent disasters in Africa. African experts as well as the communities affected by the catastrophes are facing a lot of challenges, including the access to space-based information, human capacity-building, development of appropriate institutions, monitoring of parameters, etc.
However, the following recommendations are made in order to improve the situation and save the lives of people when possible:
- The importance of earth observation and geo-information in disaster management should be amplified.
- Synergies should be developed between technical/financial partners, experts and local communities to improve exchanges and communication.
- Disaster Risk Reduction Networks should be developed.
- Appropriate curriculum on the use of space technologies for disaster management should be developed for training institutions.
- Free or low-cost data can be used (such as ASTER, MODIS, Landsat ETM+, SRTM-DEM, AVHRR, etc.) in order to increase and ease the access to disaster-related data.
- Legal frames should be created to develop standards, monitor parameters and harmonise concepts.
Finally, it should be noted that the continuous capacity-building of experts and communities on a more careful planning for the location, type and durability of developments in and near hazard-prone areas, can definitely reduce losses and enhance the speed of recovery.
References
- Ikhuoria, Isi A., RECTAS: Strategies and Synergy of Accomplishing Objectives, Vision and Collaborative Research (2010).
- UNECA, Report on ECA’s Activities Since the 43rd Meeting of RECTAS Governing Council (2010).
- Bola Ayeni, Building the Capacity of Developing Countries in Disaster Risk Reduction and Management (2008).
- Olajide Kufoniyi, Improving Capacity Building in Earth Observation and Geo-Information Science in Africa through Educational Networking (2007).
Contact
Keita Mahamadou S.
keita [at] rectas.org, ded [at] rectas.org
Examining the effects of the Global Economic Crisis on poverty through natural disasters impacts - An overview of the UNOOSA RIVAF Project
Examining the effects of the Global Economic Crisis on poverty through natural disasters impacts - An overview of the UNOOSA RIVAF Project
Brian Tomaszewski, Ph.D., Assistant Professor, Department of Information Sciences & Technologies, Rochester Institute of Technology
Introduction
This paper presents an overview of the research project “A Visual Analytics Approach to Understanding Poverty Assessment through Disaster Impacts in Africa” that is supported by the Global Pulse Rapid Impact and Vulnerability Analysis Fund (RIVAF) and at the time of this writing, is being implemented by UNOOSA and its partners.
The structure of the paper is as follows. First, I provide the broader context for the project by describing the UN Global Pulse initiative and the Rapid Impact and Vulnerability Analysis Fund (RIVAF) that has the broad goal of investigating the effects of the Global Economic Crisis on the poor and vulnerable. Next, I describe the specific aspects of the UNOOSA RIVAF project such as (a) partnerships (b) goals, and (c) case-study areas. This section is then followed by a brief discussion on the Vulnerability and Visual Analytics theoretical framework that is motivating the research. Instantiation of the Visual Analytics aspects of the theoretical framework is made in the next section through discussion on the Visual Analytic Globe, a prototype Visual Analytic environment being developed to support analytical aspects of the project. The paper concludes with a brief description of the next steps that will be taken in the project, relative to current project progress.
Global Pulse
Global Pulse (GP) (www.unglobalpulse.org/) started in April 2009 as an initiative of U.N. Secretary-General Ban-Ki Moon to “establish a monitoring system to better track the impact of compound crises on vulnerable populations ”. Since its inception, GP has undertaken several initiatives that focused on harnessing technological innovation to monitor and analyze vulnerable populations around the world . One particular global crisis that has been the attention of GP efforts to monitor vulnerable populations is the Global Economic Crisis.
The Global Economic Crisis (GEC) and the Rapid Impact and Vulnerability Analysis Fund (RIVAF)
The Global Economic Crisis is considered to be the worst financial crisis since the Great Depression. The GEC has contributed to a decline in world-wide economic activity, large-scale unemployment, and major financial recovery efforts and commitments by governments. The complex and extensive nature of the GEC lead to the creation in December 2009 of the Rapid Impact and Vulnerability Analysis Fund (RIVAF) within the overall Global Pulse initiative. Specifically, RIVAF was established as a “grant-making mechanism (to) support innovative, real-time data collection and analysis to help develop a better understanding of how vulnerable populations cope with the impacts of global crises” . Fifteen applications were submitted to RIVAF, of which nine, included an application from UNOOSA, were selected. The following section provides an overview of the UNOOSA RIVAF project.
The UNOOSA RIVAF Project
Objectives
The broad objectives of the UNOOSA RIVAF project are to understand the particular effects that the Global Economic Crisis (GEC) has had on the well known relationships between livelihood, poverty, and vulnerability to natural disasters, and to understand how the impacts of natural disasters are potential indicators of GEC impacts on the poor and vulnerable. We hypothesize that the GEC has created a set of unique, previously unexamined circumstances that have negatively affected livelihoods, creating increased poverty conditions and subsequent increased vulnerability to natural disasters.
In particular, the UNOOSA RIVAF project seeks answer to questions such as:
- How specifically have livelihoods been affected by the Global Economic Crisis?
For example, how have livelihoods been affected by global decreased prices for export crops such as cotton in Africa? - How have impacts on livelihood exacerbated vulnerability to natural hazards?
The well known linkages between livelihood and vulnerability are complex. Displacement is one phenomenon that emerges from these linkages. According to the 2010 Consolidated Appeals Process Appeal for West Africa , the current global economic crisis has worsened the phenomenon of displacement in (West Africa). - How do impacts from natural disasters reveal vulnerabilities present before an event and forecast vulnerability after an event?
It is a well-established fact that disasters reveal structural and institutional vulnerabilities, the depth and extent of which are not otherwise overtly apparent until the disaster occurs. For this question, we will investigate relationships between disaster impacts such as loss of agricultural lands, the effects of disaster impacts on livelihoods, and the subsequent effect of livelihood on poverty. A particular focus is being made on using a variety of indicators such as household poverty figures, import/export figures of key African commodities (cotton, palm oil etc.), global remittances, changing land use/land cover patterns, and economic and social disaster impact data to understand GEC impacts on the poor and vulnerable.
Partners
The UNOOSA RIVAF project is implemented in partnership with the UN Economic Commission for Africa, (UNECA), the UN Environment Programme (UNEP), and the Rochester Institute of Technology (RIT). The project teams’ multi-disciplinary mix of cross-UN-agencies coupled with an academic partner was designed to maximize the diversity of scientific- and agency perspectives that can be brought to bear upon the complex nature of the questions being investigated.
Study areas
Two countries are considered in this project. The first is Burkina Faso (BF). BF is a very relevant choice as a focus area due to its economy being impacted by decreased cotton exports, high levels of internal and out-migration, and the widespread state of poverty. The second is Guatemala, another highly relevant focus area due to decreased coffee export prices and environmental degradation (i.e. deforestation) that has affected its economy. Both countries experience natural disasters regularly and thus can offer insights into the effects of the GEC on the relationships between livelihoods, poverty, and vulnerability as reflected in disaster impacts.
Theoretical Framework
In the following sections we outline the theoretical framework underlying our efforts.
The relationships between livelihoods, poverty and vulnerability
We draw upon the Department for International Development’s (DFID) Sustainable Livelihoods Framework for examining the relationships between livelihoods, poverty and vulnerability (Chambers and Conway, 1992, Ashley and Carney, 1999).
In particular, according to the DFID framework, resources required to establish and sustain livelihoods are based on the concept of assets or capitals. A non-exhaustive list of capital examples include human capital, or knowledge, health and skills needed for working, natural capital, or natural resources related to livelihoods such as water, land and bio-diversity, financial capital such as cash and other financial resources, and social capital or social relationships and group memberships which people may draw upon for finding livelihoods (Frankenberger et al., 2002).
From the perspective of capitals, in theory, impoverished people are in an impoverished state because they cannot access or accumulate such capitals. We thus situate the notion of capitals within the context of the research questions of the UNOOSA RIVAF project using the following conceptual framework:
- The Global Economic Crisis impacts access to and accumulation of the aforementioned and other types of capitals.
- Capitals, and thereby livelihoods, are vulnerable to shocks and stresses such as the GEC. For example, the GEC effects global markets that in turn, affects financial capitals of individuals.
- By affecting capitals, the GEC, in turn, increases vulnerability and ultimately makes disasters impacts worse.
In order to support sense making of the three issues within our conceptual framework, we utilize Visual Analytics.
Visual Analytics
The complex and abstract nature of relationships between livelihood, poverty, and vulnerability to natural disasters requires discrete visual representations and computational processing that can support analytical reasoning and decision making to inform policy response, a scientific perspective know as Visual Analytics.
Visual Analytics is the science of analytical reasoning facilitated by interactive visual interfaces, computational methods, and knowledge construction, representation, and management strategies (Thomas and Cook, 2005, Pike et al., 2009). Visual Analytics makes a particular focus on assembling evidence, generating inferences and explanations from evidence, and comparing assessing those inferences and explanations (Pirolli and Card, 2005). The ultimate end goals of visual analytics investigations are the dissemination of results to decision makers and succinct communication of the interpretations made by an analyst or group of analysts (Gershon and Page, 2001)
Technology – The Visual Analytic Globe
The following section provides an overview of the Visual Analytic Globe, a prototype visual analytic environment being developed to provide support analysis of the impacts of the crisis on the poor and/or vulnerable through our research team’s emphasis on developing visually-oriented analytical products such as combined geographic map, timeline and data graph artifacts. Our emphasis on developing visually-oriented artifacts to present research results is theoretically motivated by calls within the United Nations community for the increased use of visualization for decision making (Office for the Coordination of Humanitarian Affairs (OCHA), 2008, Backhaus et al., 2010).
Qualitative analysis using open source media
The visual analytic globe currently supports queries to the Google News and Google News Archives. Google News is used for obtaining current documents about a subject of interest. Google News Archive information is used for potentially understanding how a situation evolved over time, like the GEC (Figure 1).
Figure 1: In this example, an analyst is querying Google News archives to find stories about food and migration in Burkina Faso between 2007 and 2008. The analyst can obtain details about any document by clicking on a document title and seeing the named entities that were identified in the raw text (as seen in the bottom left of Figure 1). The term “named entities” refers to people, places, and organizations found in the document, a color coding scheme is applied to support quick scans of the named entities. The color coding scheme used is as follows - people are highlighted in purple, organizations in orange, and places in green.
Queries done to both Google News and Google archives are presented in the search result view seen in the left of Figure 1. The primary purpose of the search result view is to provide quick overviews of the contents of documents foraged by web queries and documents are ranked by their relevance to a given query.
As the visual analytic globe processes each document, place names are extracted, geocoded, and mapped. The integrated map view enables an analyst to explore this derived spatial context through display of the geographic information derived from each document on the map (Figure 2).
Figure 2: Mapping locations found in news stories.
Integrated Geospatial- and Space-based Technologies
Another goal of the Visual Analytic Globe is to provide the analyst with multiple geospatial views, particularly space-based technology views. These multiple views come in the form of linked Geospatial and Space-based Technologies representations. The visual analytic globe accomplishes this by linking the virtual globe views of Google Earth with 2D Web Map Services (WMS) map images contained within ESRI-based map software (Figure 3).
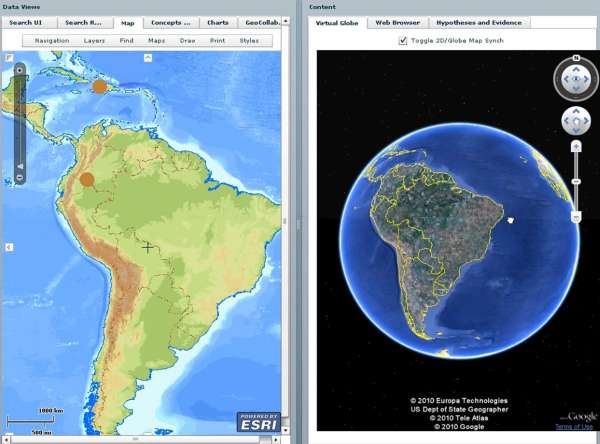
Figure 3: Linked 2D and Virtual Globe views.
For more information on this aspect of the Visual Analytic Globe, see Tomaszewski (2008).
Quantitative Data Analysis
The visual analytic globe also integrated quantitative data views in the form of charts and other graphical data displays (Figure 4).
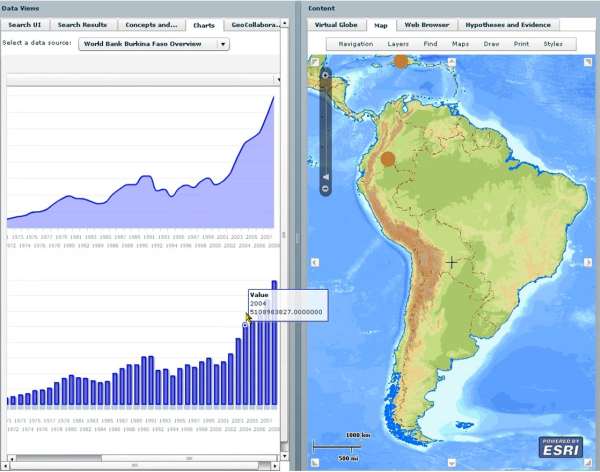
Figure 4: Quantitative data view in the Virtual Globe.
As seen on the left in Figure 4, an analyst has selected the Burkina Faso World Bank data set and examining different variables of interest.
For a full overview of the Visual Analytic Globe and all of its functionalities, see: http://www.youtube.com/watch?v=mo3fLuWHQnM&
Next Steps
The next steps for the UNOOSA RIVAF project are three-fold. First, a major task will be data collection from a wide variety of sources (public, private, NGO, and U.N. agencies) and in varying formats such as (a) geospatial datasets thematically relevant to the project, such as land-use land-cover, (b) satellite- and aerial imagery, (c) open source media analysis, (d) economic and employment statistics, and (d) any other data sets relevant to the project. The second step will be to conduct an extensive data analysis as motivated and informed by the conceptual framework discussed in section 3.1 and technologically supported by the Visual Analytic Globe discussed in section 4. Finally, our project team will develop final reports for submission to the RIVAF committee. In particular, the reports will present our final analysis of the questions discussed in section 2.1. We also hope to present a description of the methodology used on this project that is repeatable in countries other than our study areas. Ultimately, our intent is that our methodology can be re-purposed for future Global Pulse and other efforts aimed at understanding how disaster impacts can potentially reveal vulnerability, and in turn, alleviate human suffering. For future updates on this project, see: http://un-spider.org/rivaf/.
References
- Ashley, C. & Carney, D. 1999. Sustainable livelihoods: Lessons from early experience, Department for International Development.
- Backhaus, R., Czaran, L., Epler, N., Leitgab, M., Lyu, Y. S., Ravan, S., Stevens, D., Stumpf, P., Szarzynski, J. & Leon, J.-C. V. D. 2010. Support from Space: The United Nations Platform for Space-based Information for Disaster Management and Emergency Response (UN-SPIDER). In: ALTAN, O., BACKHAUS, R., BOCCARDO, P. & ZLATANOVA, S. (eds.) Geoinformation for Disaster and Risk Management: Examples and Best Practices. Copenhagen, Denmark: Joint Board of Geospatial Information Societies.
- Chambers, R. & Conway, G. 1992. Sustainable rural livelihoods: practical concepts for the 21st century, Institute of Development Studies, University of Sussex, Brighton, UK
- Frankenberger, T., Luther, K., Becht, J. & Mccaston, M. 2002. Household Livelihood Security Assessments: A Toolkit for Practitioners. Atlanta, GA: CARE USA, PHLS Unit.
- Gershon, N. & Page, W. 2001. What Storytelling Can Do for Information Visualization. Communications Of The ACM, 44, 31-37.
- Office for the Coordination of Humanitarian Affairs (UNOCHA) 2008. Global Symposium +5 on Information for Humanitarian Action: Final Report. In: RELIEFWEB (ed.). Geneva, Switzerland: OCHA Reports.
- Pike, W., Stasko, J. & Chang, R. 2009. The science of interaction. Information Visualization, 8, 263-274.
- Pirolli, P. & Card, S. Year. The Sensemaking Process and Leverage Points for Analyst Technology as Identified Through Cognitive Task Analysis. In: International Conference on Intelligence Analysis, 2005 McLean, VA. 1-6.
- Thomas, J. J. & Cook, K. A. 2005. Illuminating the Path: The Research and Development Agenda for Visual Analytics, Los Alametos, CA, IEEE.
- Tomaszewski, B. 2008. Producing geo-historical context from implicit sources: a geovisual analytics approach. The Cartographic Journal, 45, 165-181.
Contact
Brian Tomaszewski, Ph.D., Assistant Professor
Department of Information Sciences & Technologies
Rochester Institute of Technology
31 Lomb Memorial Drive
Rochester, NY 14623, USA
phone: +1 585-259-9678
http://people.rit.edu/bmtski/
bmtski [at] rit.edu
From policies to action: Institutionalizing the use of space-based information in disaster-risk management and emergency response in Latin America
From policies to action: Institutionalizing the use of space-based information in disaster-risk management and emergency response in Latin America
Juan Carlos Villagran de Leon, Programme Officer, United Nations Office for Outer Space Affairs, United Nations Platform for Space-based Information for Disaster Management and Emergency Response (UNOOSA/UN-SPIDER)
Introduction
One of the tasks of UN-SPIDER, as stated in its mandate given by the General Assembly, is to enhance the capacities of countries to access and to use all types of space-based information for disaster management. In order to identify how to strengthen the capacity of disaster-risk management and emergency response agencies of using space-based information, UN-SPIDER has been conducting Technical Advisory Missions to countries in different regions of the world, including Latin America and the Caribbean. Such missions include a review of policies and strategies concerning access and use of information, particularly space-based information, and serve as the basis for UN-SPIDER to provide technical advisory support to government agencies. Within Latin America and the Caribbean, UN-SPIDER has conducted these types of missions to Ecuador, Dominican Republic, Jamaica, and Guatemala during 2009 and 2010.
As stated in UN-SPIDER’s Capacity Building Strategy (1), the sustained use of space-based information in tasks related to disaster-risk management and emergency response is supported through institutional policies and strategies. Such policies and strategies manifest the institutional recognition of the value of using this type of information, as well as any other type of information to make decisions; and allow directors of such institutions to channel resources towards the generation and use of information.
This article focuses on the review of existing policies and strategies for the use of space-based information in the above-mentioned Latin American countries, and stems from the research conducted by experts who have participated in the Technical Advisory Missions conducted to these countries. The comparative review aims to manifest advances on the use of such information in these countries, as well as additional efforts that would allow such countries to take even more advantage of existing opportunities concerning space-based information.
The generation, dissemination, and use of information within the context of national policies targeting disaster risk management and emergency response
While the use of any type of information for a variety of purposes usually starts with ad-hoc efforts, the institutionalization process begins to take shape when policies are enacted, as such policies facilitate the permanent allocation of the required resources to conduct the various tasks that are involved in the use of information. Furthermore, approaches to using space-based information in the context of disaster-risk management and emergency response vary from country to country. In some countries such as Ecuador, Jamaica, the Dominican Republic, and Guatemala, the use of space-based information has progressed initially via efforts focusing on environmental management including the proper or sustainable use of natural resources, and is gradually finding its way into emergency response, and to a lesser degree into disaster-risk management. In Ecuador the use of space-based information, particularly via remote-sensing approaches, began through a particular circumstance whereby the Center for the Integrated Acquisition of Information on Natural Resources (CLIRSEN) (2) was established in 1977 to elaborate the inventory of natural resources at the national level, and in 1982 it received the mandate from the Government of Ecuador to take over the satellite receiving station which was installed by the National Air and Space Administration of the United States (NASA) in 1957 in the foothills of the Cotopaxi volcano in Ecuador. In recent decades, CLIRSEN has been promoting the application of space-based information for a variety of purposes and has contributed through the provision of data to institutions such as the Geophysical Institute of the National Polytechnic School (EPN) which tracks volcanic activity and the Institute of Geology, which is in charge of tracking landslides throughout the country. A similar situation is found to this day in the Dominican Republic, in Jamaica, and in Guatemala, where satellite imagery is used to a larger extent by Ministries of Environment to track forests and natural resources.
Taking into consideration the fact that space-based information can be used for a variety of purposes, its use in the context of disaster-risk management and emergency response is reviewed in this article through those policies and strategies that have been explicitly enacted and implemented to target both these phases of the disaster management cycle. But as it is to be expected, it is essential to begin the review analyzing how information, whether it is space-based, or ground-based, is being recognized at this policy level. In this more general context, it could be stated that Ecuador again has taken considerable steps regarding the use of information at the highest policy level. In the new Constitution enacted in 2008, the Government introduced specific legislation focusing on disaster-risk management through Articles 389 and 390 (3). The policy recognizes the need to establish the National De-Centralized Disaster-Risk Management System, highlighting the need to identify risks and to generate and disseminate information on a timely basis for risk-management purposes. However, the legislation does not mention space-based information in an explicit fashion.
In other countries, the use of information for disaster-risk management has not been incorporated at the high level of the constitution, but it has been introduced through specific legislation enacted by the respective Congresses. In the case of the Dominican Republic, the national law No. 147-02 was enacted in 2002 to establish the National System for Prevention, Mitigation, and Disaster Response (4). Article 15 of this legislation delegates the establishment of the National Integrated Information System to the National Emergency Commission (CNE), which should target the generation of information concerning hazards, vulnerabilities, and risks throughout the country. In Jamaica, the Disaster Management Act No. 15 of 1993 established the Office for Disaster Preparedness and Emergency Response (ODPEM) and included a specific function that targeted the generation of information on hazards, with the aim of identifying and analyzing such hazards or emergency situations and conducting operational research into their effects. Finally, in Guatemala, the National Decree 109-96 (5), which established the National Coordinating Agency for Disaster Reduction (CONRED), also recognized the need to conduct research targeting hazards, vulnerability, and risk.
As it can be seen, the need to generate information on hazards, vulnerabilities, and risk is recognized as essential at the highest policy level, and should serve as the basis to institutionalize the generation and subsequent dissemination of the corresponding information. However, as stated earlier, none of these legislations enforces the use of this information explicitly. Nevertheless, it is important to recognize that meteorological agencies in these and other countries around the world have institutionalized the use of space-based data and information gathered from meteorological satellites through specific institutional policies.
While access to space-based data and imagery follows similar patterns in these four countries, the use of such data and imagery targeting disaster-risk management and emergency response varies from country to country. All of these countries are aware of the service provided by the International Charter Space and Major Disasters (Charter) and have benefited from its products on various occasions.
Spatial Data Infrastructures
In addition and recognizing the value of space-based data for a variety of purposes, all these countries are embarking on the establishment of National Spatial Database Infrastructures (NSDIs) as a means for institutions to share and exchange information. In most cases, such NSDIs have been established by the National Planning Agencies, given their strategic role in coordinating activities conducted by all government agencies. In Guatemala, the General Secretariat for Planning and Programming of the Presidency (SEGEPLAN) has not only aims at establishing the NSDI, but plays a critical role in making use of space-based information to track the impacts of recent disasters as tropical storm Stan in 2005, and most recently the tropical storm Agatha in 2010; and to develop the National Territorial Planning System (6).
In the case of Ecuador, the National Secretariat for Development Planning (SENPLADES) is establishing the NSDI and has also established the National Geo-Informatics Council (CONAGE) as an inter-institutional mechanism to ensure that the proposed aims of the NSDI are reached (7). As it is stated in the Executive Decree No. 2250 of 2004 (8), the State of Ecuador recognizes “the need to promote the integration of producers and users of geographic information as a pillar to support social and economic activities, and to promote sustainable and integral development of the country”. In addition, SENPLADES is also in charge of the National Territorial Information System. In the context of satellite imagery, SENPLADES sees the utility of the NSDI as a strategy to elaborate the national inventory of satellite imagery, which aims to avoid duplication in the purchase of imagery by different government agencies.
In Jamaica, the Spatial Data Management Division (SDMD) in recent years has been working towards the establishment of the NSDI, and also contributes with ODPEM in case of disasters. The Division was originally established by the Land Information Council of Jamaica, but recently it was moved to the Office of the Prime Minister given its strategic relevance concerning planning efforts. A parallel effort is being conducted by the Planning Institute of Jamaica (PIOJ) through the elaboration of the National Spatial Plan, which targets the development of an inventory of existing geo-spatial data to determine how it has been used and to detect existing gaps.
In the Dominican Republic, efforts to establish such a NSDI are still in an embryonic stage at the time this article is being written. Nevertheless, many agencies share the view concerning the benefits that an NSDI would bring in terms of facilitating the exchange and sharing of information.
Strategies and policies targeting the training of staff
Two key issues to consider when it comes to using space-based information in disaster-risk management and emergency response activities are the knowledge and the skills of staff who are responsible for the generation of information using ground- and space-based data. Taking into consideration the fast pace of advances regarding information technologies, UN-SPIDER recognizes the relevance of institutional policies and strategies targeting the continuous training of staff, so that institutions can continue to take advantage of emerging opportunities.
A review of the respective legislation in these four countries allows UN-SPIDER to conclude that several countries do recognize the need for training. In the National Law 147-02, the State of the Dominican Republic recognized that “despite the fact that for several years disaster response organizations have promoted training initiatives to improve emergency response capacities, today it is necessary to conduct a permanent training programme on integral risk management through instruments previously elaborated with the support of diverse agencies targeting the municipal, provincial, and national levels”. To this end, this national law instructs the National System for Prevention, Mitigation, and Disaster Response to develop a training system on risk management targeting staff of the government and communities; and to strengthen institutional capacities on this topic at the provincial and municipal levels.
In the case of Jamaica, the Act of 1993 recognized the need for ODPEM to provide training programmes in all aspects of disaster preparedness, mitigation, loss reduction, and disaster management. Furthermore, the National Land Policy enacted in 1996 also recognized the need for ongoing training in geographic information systems to be maintained and institutionalized in the curriculum at the Management Institute for National Development, the University of the West Indies, and the University of Technology. In a similar fashion, the Jamaica Water Sector Policy recognized the need for capacity strengthening for effective, efficient, and equitable solutions to the challenges of water resource management and development.
However, when it comes to the implementation level, it is Ecuador, which has the lead through CLIRSEN that has now established its second training center in Guayaquil to fill the demand there. Taking into consideration its Mandate, its Mission, and its Vision (9), CLIRSEN has established 3 strategies:
- To facilitate access to satellite images as an intermediary between space agencies, which produce such images and the end user who needs them.
- To conduct research and to provide technical assistance to institutions on the use of this type of information.
- To train staff in all aspects related to this type of information (access, processing, and use).
CLIRSEN is cooperating with the National Secretariat on Risk Management and with other agencies in the use of space-based information to generate information on hazards and risks in case of floods, earthquakes, volcanic eruptions, and landslides.
Detecting the institutionalization process in a developing country
While the evolution regarding the use of information has been somewhat different in every country, Guatemala presents an interesting case from which many conclusions can be drawn that are representative of trends in other developing countries. Guatemala, like other countries, is exposed to a variety of hazards such as earthquakes, floods, and landslides. Between 1969 and 1996 the national policy on the issue of disasters was focused on response, and so the National Emergency Committee (CONE) was established in 1969. By the late 1980s, computers began to be used for managerial processes in CONE, but there was no institutional policy on the use of geo-spatial information for such purposes. Between 1990 and 1995, there was one staff member who was assigned to provide maintenance to PCs. Between 1995 and 1998, an Army Officer assigned to CONE took interest on GIS, but the use of such systems was not institutionalized yet.
Between 1992 and 2003, various regional and international initiatives conducted by the Central American Coordination Center for Natural Disaster Prevention (CEPREDENAC), ITC in the Netherlands in conjunction with UNESCO, and the United States Geological Survey (USGS) focused on enhancing the skills of staff on the use of GIS. An initial project was conducted by CEPREDENAC between 1992 and 1994, focusing on the training of one staff per country on the use of GIS. Soon after hurricane Mitch at the end of 1998, both ITC/UNESCO and USGS launched regional projects again targeting the training of staff on the use of GIS in government institutions devoted to risk management and emergency response.
In December of 1996, the Congress of Guatemala enacted the National Decree-Law No. 109-96, transforming CONE into CONRED. The institutional transition from CONE to CONRED took slightly over two years to be completed and was accompanied by a change in the leadership within the institution, and by 2001 the new Executive Director of CONRED officially established an information management unit, which included one staff member dedicated to GIS tasks. By 2008, a GIS sub-unit was established within the National Emergency Operations Center (EOC), and is staffed on a 24/7 basis by staff with skills on the use of GIS to generate maps visualizing the impacts of disasters and any other pertinent information. The process of institutionalization is shown in figure 1.
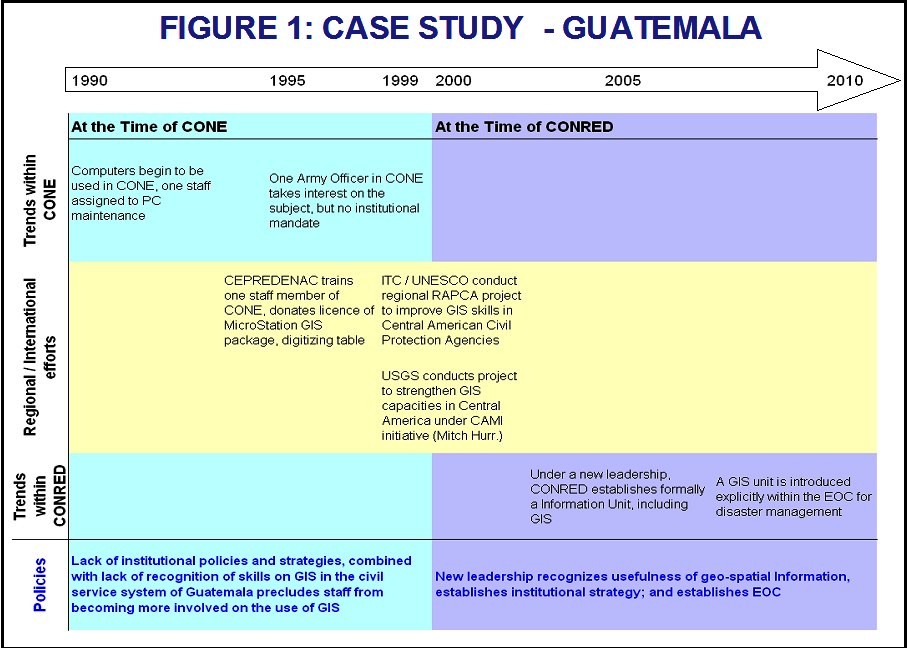
It should be stated that in Jamaica, Ecuador, and Dominican Republic, disaster-risk or civil protection agencies are also using GIS on an institutional basis, and in the corresponding EOCs as well. And with the support of UN-SPIDER, these and other countries are gradually incorporating the use of space-based information in a complementary fashion.
The Role of UN-SPIDER in promoting the use of space-based information
As it has been stated in the introduction, UN-SPIDER has been established to promote the use of all types of space-based information to support the full disaster management cycle. To achieve this goal, UN-SPIDER is promoting the institutionalization of the use of such information in these countries. The first step along these lines is the conduction of a Technical Advisory Mission that aims to identify strengths and weaknesses. Such missions have already been conducted in these four countries and allow UN-SPIDER to identify whether policy-relevant advice is needed, or whether the need is already more in terms of strategies or activities targeting training or institutional support.
In the coming years, UN-SPIDER will provide technical advisory support to these and other countries around the world, which have already officially requested such support. Efforts in Africa are now focusing on Western and Central African countries; and there is a similar approach in Small Island Developing States in the Pacific and the Indian Ocean. In all cases, the conduction of the Technical Advisory Missions allows UN-SPIDER to tailor its capacity building efforts so that these countries can begin to take advantage of emerging opportunities concerning space-based information.
Conclusions
The use of space-based information is still evolving in many developing countries. However, policies embedded in the new legislation in many of these countries are promoting both the generation and dissemination of information. And while the use of space-based information is not mentioned explicitly, it is important to recognize that there are no restrictions for its use in such policies either.
A review of policies on the generation and use of information in the Dominican Republic, Ecuador, Guatemala, and Jamaica; and the recent establishment of geographic information units in agencies responsible for disaster-risk management and emergency response in these countries leads to the conclusion that the use of this type of information is being recognized by decision makers, and is paving the way for its corresponding institutionalization.
So far, all of these countries have made use of space-based information in the case of disasters through support delivered by the Charter. But it must be stressed that Ecuador has been able to take advantage of space-based information through CLIRSEN. Being a local institution, CLIRSEN facilitates access to space-base information, the training of staff, and can support in the generation of useful information based on satellite imagery. In addition, it is also important to highlight the fact that the use of space-based information began in these and other countries more in the area of environmental protection, particularly in the context of protected areas and natural resources.
It is expected that through the efforts conducted by UN-SPIDER and other regional and international organizations, countries like Guatemala, Dominican Republic, and Jamaica can follow on the footsteps of Ecuador and take advantage of the opportunities that are available regarding space-based information.
References
- Ref.: A/AC.105/937; pages 3-6
- See: http://www.clirsen.com
- Ref.: Asamblea Constituyente de la República del Ecuador. Constitución 2008. Available in: http://www.asambleanacional.gov.ec/documentos/constitucion_de_bolsillo.pdf
- Ref: Congreso Nacional Presidencia de la Republica Dominicana. Ley Nacional 147-02. Available in: http://www.coe.gov.do/index.php?option=com_content&view=article&id=18&Itemid=48.
- Congreso de la República de Guatemala, Decreto Legislativo 109-96. Available in: http://www.undp.org.gt/data/bases/596_Nota_Aclaratoria_1-adjunto.pdf.
- Available in: http://sinit.segeplan.gob.gt/
- Decreto Ejecutivo No. 2250 published in Registro Oficial Nº 466 on 22 November 2004 , available in: http://territorial.sni.gov.ec/images/stories/actas/CONAGE/decreto_conage.pdf.
- Available in: http://territorial.sni.gov.ec/images/stories/actas/CONAGE/decreto_conage.pdf.
- See: http://www.clirsen.com/clirsen/index.php?option=com_content&task=view&id=12&Itemid=32
Geo-information infrastructure for disaster management in Ukrainian UN-SPIDER Regional Support Office
Geo-information infrastructure for disaster management in Ukrainian UN-SPIDER Regional Support Office
Nataliia Kussul, Andrii Shelestov, Sergii Skakun
Space Research Institute NASU-NSAU, Ukraine
Introduction
Presently, global climate change on the Earth made a rational land use, environmental monitoring, prediction of natural and technological disasters tasks of great importance. The basis of the solution for these crucial problems lies in the integrated use of data of different nature: modeling data, in-situ measurements and observations, and indirect observations such as airborne and space borne remote sensing data [1].
In particular, models can be used to fill in the gaps in data by extrapolating and estimating necessary parameters to the site of interest and to better understand and predict different processes occurring in the atmosphere, land, ocean and sea, etc; they can also help to interpret measurements and to design new observing systems. In-situ measurements are often used for assimilation into models, calibration and validation of both modeling and remote sensing data. Satellite observations have an advantage of acquiring data for large and hard-to-reach areas, as well as providing continuous and human-independent measurements. Many important applications such as monitoring and predictions of natural disasters, environmental monitoring, etc. heavily rely on the use of Earth Observation (EO) data from space. For example, satellite-derived flood extent is very important for calibration and validation of hydraulic models to reconstruct what happened during the flood and determine what caused the water to go where it did [2]. Information on flood extent provided in the near real-time (NRT) can also be used for damage assessment and risk management, and can also benefit rescuers during flooding. Both space-borne microwave and optical data can provide means to detect drought conditions, estimate drought extent and assess the damage caused by the drought events [3, 4]. To assess vegetation health/stress, which is extremely important for agriculture applications, optical remote sensing data can be used to derive biophysical and biochemical variables such as pigment concentration, leaf structure, water content at leaf level and leaf area index (LAI), fraction of photosynthetically active radiation absorbed by vegetation (FPAR) at canopy level etc. [5].
The EO domain is characterized by the large volumes of data that should be processed, catalogued, and archived [6, 7, 8]. The processing of satellite data is carried out not by a single application with a monolithic code, but by distributed applications. This process can be viewed as a complex workflow [9] that is composed of many tasks: geometric and radiometric calibration, filtering, reprojection, composites construction, classification, products development, post-processing, visualization, etc. For example, calibration and mosaic composition of 80 images generated by the ASAR instrument onboard the Envisat satellite takes three days on ten workstations of an Earth Science GRID on Demand that is being developed at ESA and ESRIN [6]. Dealing with EO data, we have to also consider the security issues regarding satellite data policy, the need for processing in NRT for fast response within international programs and initiatives, in particular the International Charter "Space and Major Disasters".
It should be also noted that the same EO data sets and derived products can be used for a number of applications. For example, information on land use/change, soil properties, meteorological conditions etc. is both important for floods- and droughts-related applications as well as for vegetation state assessment. That is, once we develop interfaces to discover and access the required data and products, they can be used in a uniform way for different purposes and applications. This represents one of the important tasks that are being solved within the development of the Global Earth Observation System of Systems [1] and the European initiative Global Monitoring for Environment and Security [10]. Services and models that are common for different EO applications (e.g. flood monitoring and crop yield prediction) are shown in Figure 1.
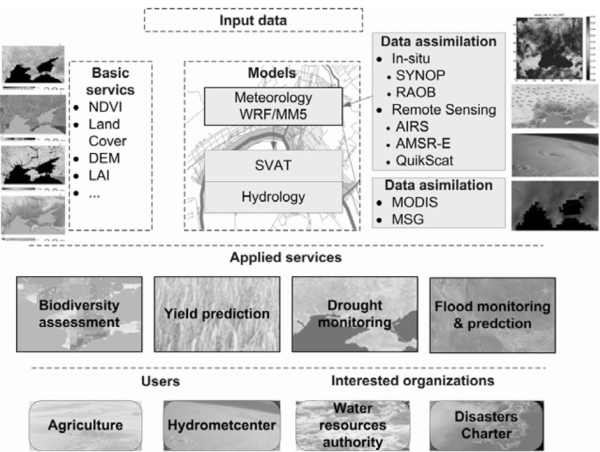
Figure 1. Common services and models for a variety of applications
A considerable need therefore exists for an appropriate geospatial infrastructure that will enable the integrated and operational use of multi-source data for different applications domains. In this paper, we focus on the description of service-oriented infrastructure that is being developed in the Space Research Institute NASU-NSAU (SRI NASU-NSAU). We will describe several real-world applications that are addressed using the infrastructure, namely flood- and fire monitoring. The geospatial services developed within the infrastructure are delivered to end-users through the UN-SPIDER Regional Support Office in Ukraine that was established in February 2010.
Service-oriented infrastructure for satellite data processing
One of the most important problems associated with satellite data processing for disaster management is the timely delivery of information to end-users. To enable such capabilities, an appropriate infrastructure is required to allow for rapid and efficient access to, processing and delivery of geospatial information that is further used for damage assessment and risk management. In this section, we will describe the overall architecture of such a system and show how it is being used for automated acquisition, processing and visualization of satellite Synthetic-Aperture Radar (SAR) and optical data for rapid flood mapping and fire monitoring. The developed services are used within the UN-SPIDER Regional Support Office in Ukraine, that was established in February of 2010.
Overall Architecture
Within a system we developed a set of services (Fig. 2). We followed an approach that is used in the Earth System Grid [11]. The four major components of the system are as follows:
- Client applications. Web portal is a main entry point, and provides interfaces to communicate with system services.
- High-level services. This level includes a security subsystem, catalogue services, metadata services (description and access), automatic workflow generation services, and data aggregation, sub-setting & visualization services. All these services are connected to Grid services at the lower level.
- Grid services. These services provide access to the shared resources of the Grid system, access to credentials, file transfer, job submission and management.
- Database and application services. This level provides physical data and computational resources of the system.
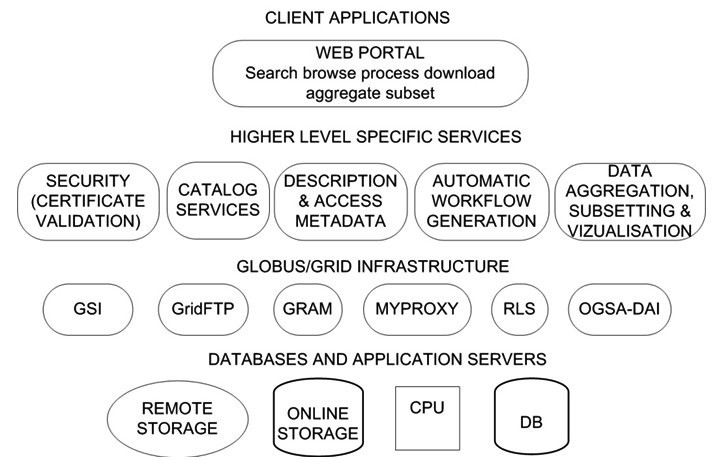
Figure 2. System architecture
Workflow of flood extent extraction from satellite (SAR) imagery
Within the infrastructure we developed an automated workflow of satellite SAR data acquisition, processing and visualization, and corresponding geospatial services for flood mapping from SAR imagery. The data are automatically downloaded from ESA rolling archives where satellite images are available within 2-4 hours after their acquisition. We implemented both programming and graphical interfaces to enable search, discovery and acquisition of data (Fig. 3). Through the portal the user can select a geographical region of interest and a time range, and find the data that matches the search request. After the user selects a file to be processed, it is transferred to the resources of the Grid system at the Space Research Institute NASU-NSAU. Following that, a workflow is automatically generated and executed on the resources of the Grid infrastructure.
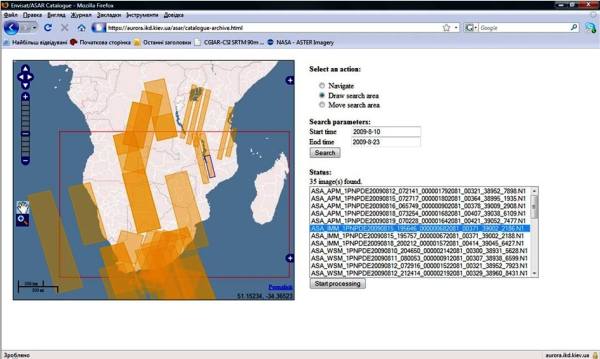
Figure 3. Portal for flood mapping from satellite SAR data
We developed a neural network approach to SAR image segmentation and classification [8]. The workflow of data processing is as follows (Fig. 4):
- Data calibration. Transformation of pixel values (in digital numbers) to backscatter coefficient (in dB).
- Orthorectification and geocoding. This step is intended to remove geometrical and radiometric errors associated with SAR imaging technology, and apply corrections to provide precise georeferencing of the data.
- Image processing. Segmentation and classification of the image using neural network.
- Topographic effects removal. Using a digital elevation model (DEM), such effects as shadows are removed from the image. The output of this step is a binary image classified into two classes: “Water” and “No water”.
- Transformation to geographic projection. The image is transformed to a projection for further visualisation via Internet using OGC-compliant standards (KML or WMS) or desktop Geographic Information Systems (GIS) using shape file.
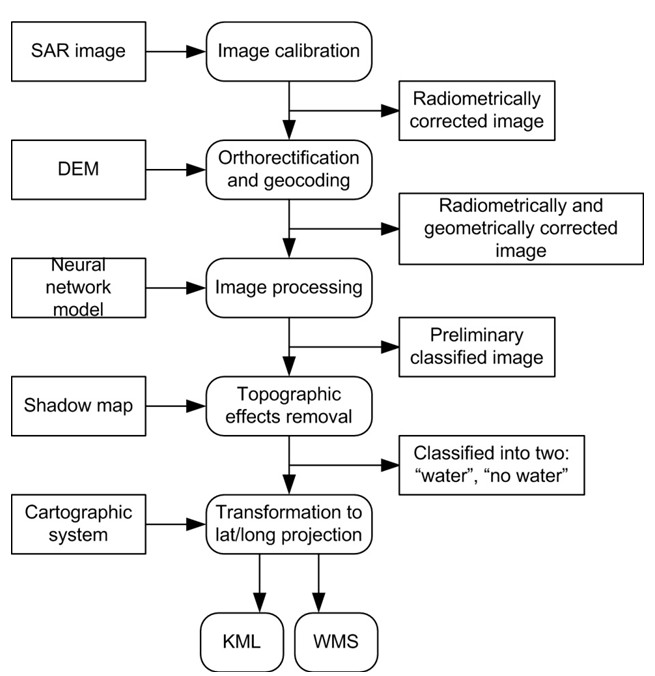
Figure 4. Workflow of flood extent extraction from SAR satellite imagery
After processing the user request from the portal, such a workflow is automatically generated and is executed on the resources of the Grid system. Through the portal the user can monitor the status of each step of the workflow. After the workflow is completed, a flood map is delivered to the user via OGC-compliant standards.
Application services
Flood monitoring
The above-described infrastructure is used within the Ukrainian UN-SPIDER RSO to produce flood maps all over the World. For this purpose, we use both optical and SAR satellite data, in particular Envisat/ASAR, Radarsat-1/2, EO-1 and Landsat-5.
Flood Monitoring in Ukraine 2010
The severe 2010 winter in Ukraine that was characterized by large amounts of snow and ice on rivers posed a high threat of floods during the melting period. A lot of efforts have been made by the Ukrainian Government to prevent and reduce consequences of potential disasters. The UN-SPIDER Regional Support Office (RSO) in Ukraine that was established at the Space Research Institute (SRI) NASU-NSAU in the beginning of 2010 played an active role in these efforts.
In order to provide flood risk assessment both synthetic-aperture radar (SAR) and optical satellite imagery were used. In particular, we acquired more than 30 Envisat/ASAR scenes during the 2010 winter-spring period, and more than 50 archived scenes during autumn 2009 to monitor the snow cover. Using the Sensor Web system we acquired 3 scenes from NASA’s EO-1/ALI instrument. Timeline of delivery of satellite images and products in case of a disaster in this particular case Ishould be emphasized (Fig. 5). For example, for the EO-1 April image we received a notification on EO-1 tasking for the target area on Monday Apr 12, 2010 @10:33 PM local time. The image was taken on Tuesday Apr 13, 2010 @11:33 AM and was made available on ftp the same day @04:30 PM. A pan-sharpened image was available as KML on the web Tue Apr 13, 2010 @11:30 PM after only 12 hrs from time the image was taken. Figure 6 shows changes in snow cover and ice formation on the Dnieper River near the Kyiv city area.
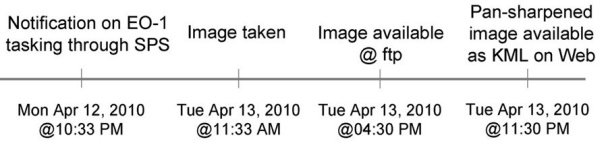
Figure 5. Timeline of EO-1 / Advanced Land Imaging for the 13 April image
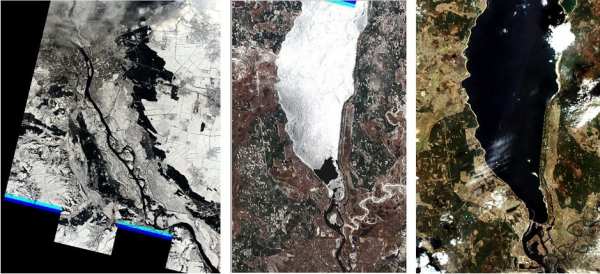
Figure 6. EO-1 images of Kyiv area for 10 March (left), 23 March (middle) and 13 April, 2010 (right). Left image shows strong presence of snow cover in early March. From the image taken on 23 March it can be seen that snow has already melted while there is still an ice cover on the river (on top). This ice posed a high threat to the houses and constructions along the river. Right image shows no snow or ice on the land and the river. Data courtesy of the NASA Earth Observing One (EO-1) Mission operated by the NASA Goddard Space Flight Center.
The produced geospatial products were delivered to the Ukrainian Ministry of Emergency Situations, the Council of National Security and Defense, and the Ukrainian Hydrometeorological Center. Information on river extent that was derived from EO-1 images was also used to calibrate and validate hydrological models to produce various scenarios of water extent for flood risk assessment.
Flood Monitoring in Namibia 2010
The UN-SPIDER RSO in Ukraine is also actively involved in the Namibia SensorWeb Pilot Project – a joint effort of UNOOSA/UN-SPIDER, NASA, NOAA, DLR and SRI NASU-NSAU. SRI’s main role lies in rapid flood mapping from SAR satellite imagery. More than 20 scenes from the Envisat/ASAR instrument have already been acquired for Namibia during 2010, and corresponding flood maps were produced. Figure 7 shows an example of one of these products. This information along with information and products provided by the project partners will be used for the integrated analysis of floods in Namibia.
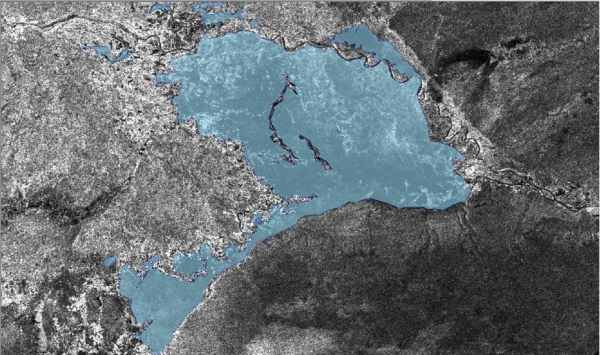
Figure 7. Flood extent shown in light-blue derived from Envisat/ASAR Wide Swath Mode imagery on 30 May, 2010. Image covers Caprivi region of Namibia. (Image copyright ESA 2010)
Integration of ground and satellite data to validate flood products
In order to provide validation of flood mapping products, ground data were collected during a U.N. Technical Advisory visit in Namibia (25-27 January 2010). These data were collected with a camera and GPS. Corresponding satellite imagery was acquired to support the field campaign (Fig. 8), in particular:
- Envisat/ASAR, 30 January 2010,
- Landsat-5/TM, 26 January 2010.
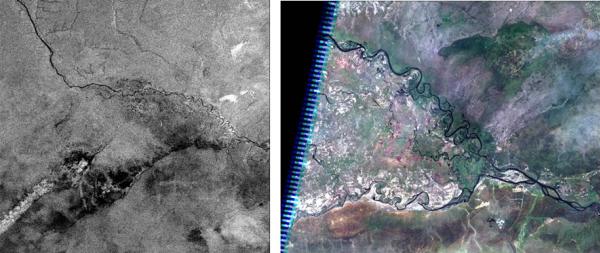
Figure 8. Envisat/ASAR acquired on 30 January 2010 (left) and Landsat-5/TM acquired on 26 January 2010 (right) covering Caprivi region of Namibia
The satellite images and photos that were geo-tagged were integrated in the Google Earth application.
Figure 9. Integration of Envisat/ASAR imagery and ground photos with Google Earth. Note that open flat water appears black (with low backscatter coefficient) on radar imagery while water with vegetation appears bright.
Fire monitoring
The 2010 summer in Ukraine was characterized by extremely high temperatures that posed a high risk of fires. In particular, the temperature exceeded +35-39ºC in Eastern regions of Ukraine, and +40-42ºC in Southern regions. According to the Ministry of Emergency Situations of Ukraine approximately 3000 fires were detected from 5 to 20 August (that constitutes approx. 200 fires per day), 2200 of them were forest fires with an area of 6500 ha being affected. In order to enable monitoring and detection of fires the following satellite data sets were used:
- EO-1/ALI, acquired on 14.08.2010 08:15 UTC
- Landat-5 TM, acquired on 02.08.2010 08:15 UTC
- Fire services provided by Center for Satellite Based Crisis Information (ZKI) of DLR
Figures 10 and 11 show fire detection products from Landsat-5 TM imagery and MODIS, respectively.
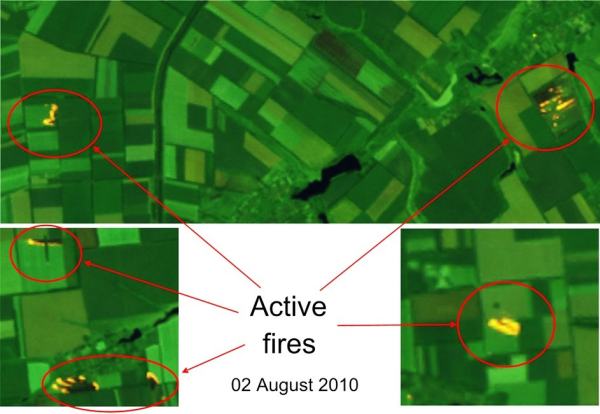
Figure 10. Active fires detected by Landsat-5/TM
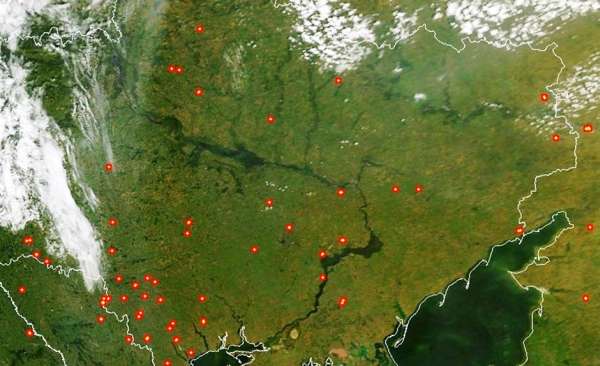
Figure 11. Hotspots detected by MODIS
Conclusions
In this paper we describe service-oriented infrastructure for disaster management based on satellite data. The infrastructure exploits a number of generic services to enable access to, processing and delivery of geospatial information. In particular, within the system we developed an automated workflow of satellite SAR data acquisition, processing and visualization, and corresponding geospatial services for flood mapping from SAR imagery. This allows us to produce flood maps within 24 hours after data acquisition. Using ground data that were collected during a U.N. Technical Advisory Mission in Namibia we provided validation of flood maps generated from SAR imagery. While the open water can be detected easily from SAR imagery, detection of water with strong vegetation cover represents an issue. Another application that is covered in the paper is fire monitoring. The use of satellite data with different spatial resolutions and coverage allowed us to provide both national and regional detection of fires.
References
- The Global Earth Observation System of Systems (GEOSS) http://www.earthobservations.org.
- M.S. Horritt, A methodology for the validation of uncertain flood inundation models. J. of Hydrology, 326, 153-165 (2006).
- F. Kogan, R. Stark, A. Gitelson, E. Adar, L. Jargalsaikhan, C. Dugrajav, and S. Tsooj, Derivation of Pasture Biomass in Mongolia from AVHRR-based Vegetation Health Indices. Int. J. Remote Sens, 25(14), 2889-2896 (2004).
- W. Wagner, C. Pathe, D. Sabel, A Bartsch., C. Kuenzer and K. Scipal, Experimental 1 km soil moisture products from ENVISAT ASAR for Southern Africa, ENVISAT and ERS Symposium, Montreux, Switzerland, 23-27.04.2007.
- S. Liang, Quantitative Remote Sensing of Land Surfaces, Wiley, Inc., 534 p (2004).
- L. Fusco, R. Cossu and C. Retscher Open Grid Services for Envisat and Earth Observation Applications. In: Plaza AJ, Chang C-I (ed) High performance computing in remote sensing, 1st edn. Taylor & Francis Group, New York, 237-280 (2007).
- A. Shelestov, N. Kussul and S. Skakun Grid Technologies in Monitoring Systems Based on Satellite Data. J. of Automation and Inf. Sci., 38(3), 69-80 (2006).
- N. Kussul, A. Shelestov andS. Skakun, Grid System for Flood Extent Extraction from Satellite Images. Earth Science Informatics, 1(3-4), 105-117 (2008).
- Project: Dissemination and Exploitation of Grids in Earth Science, https://www.eu-degree.eu.
- The European Earth Observation Programme (GMES). http://www.gmes.info.
- D.N. Williams et al, Data management and analysis for the Earth System Grid. J. Phys.: Conf. Ser. 125 012072. (2008) doi: 10.1088/1742-6596/125/1/012072
Supporting projects addressing climate change issues and associated disaster risk reduction: The Planet Action Initiative
Supporting projects addressing climate change issues and associated disaster risk reduction: The Planet Action Initiative
Algis B. Kucinskas, Planet Action, Spot Image* Individual Partner, Paris, France
This paper gives an overview of the Planet Action (PA) non-profit collaborative initiative with particular focus on its project support activities. PA was launched in 2007 to encourage the Earth observation and geographic information professional communities to help NGOs, local institutions and universities tackle climate change in a new cooperative approach.
General background / international communities’ needs
Following the conclusions of the Fourth Assessment Report of the Intergovernmental Panel on Climate Change (1, 2, 3) (IPCC, AR4, 2007) as well as updates from the 2009 Copenhagen Diagnosis (4) , it is now generally agreed that the Earth is currently experiencing large-scale climate change of both natural and anthropogenic (human-induced) causes with imminent and future adverse impacts on human society and the environment.
Indeed, as an evidence of observed climate change, there is now a very strong body of observational evidence showing that there has been an unusual increase in the global average (mean) temperature of the Earth’s lower atmosphere over the past century, with a particularly rapid increase since the mid-20th century. This upward trend in measured global mean temperatures and its projected continuation is often referred to as “global warming”. It is illustrated in Figure 1a and b, taken from the Copenhagen Diagnosis (4) (with data from NASA Goddard Institute for Space Studies/GISS and the Hadley Centre for Climate Prediction and Research).
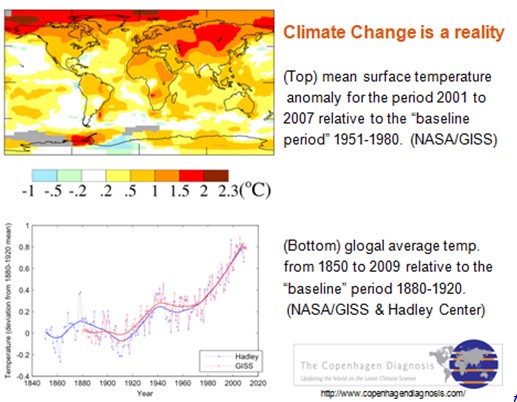
Figure 1 : (top) Mean surface temperature anomaly/change (°C) for the period 2001 to 2007 relative to the “baseline period” 1951 to 1980; map estimates are based on NASA Goddard Institute for Space Studies (GISS) data and (bottom) global average temperature from 1850 to 2009 relative to the “baseline period” 1880 to 1920 estimated from NASA/GISS and Hadley Centre for Climate Prediction and Research data. Figure taken from The Copenhagen Diagnosis, 2009 (4).
As many basic elements of human society and the environment are sensitive to climate variability and change it is to be expected that climate change/global warming will have significant socioeconomic and environmental effects/impacts (e.g., water resources, land use/agriculture, vulnerability to extreme events, coastal areas, ecosystems, human health,…). However, the extent of climate change effects/impacts will vary by region, over time and according to the vulnerability and adaptability of different societal and environmental systems.
Socioeconomic and environmental effects/impacts of climate change can be divided into current changes/impacts and probable projected changes/impacts for the future. These are discussed by (3) with more recent updates given in (4). The currently observed effects are expected to continue and amplify further, as most of the processes induced by global warming have a tendency to accentuate it.
Natural hazards-related disasters worldwide, but most notably in the developing world, have claimed many lives, injured many more, led to massive population displacement, caused severe damage to the natural and built environment, and seriously undermine efforts for achieving sustainable economic and social development. According to data and analysis by Munich Re (5), over the past decades there has been an upward trend in the number of natural disasters and related losses as a result of such factors as population growth, concentration of population in and industrialization of exposed, hazard/disaster prone areas, environmental degradation and, possibly, climate change.
Indeed, the potential future effects of global climate change include more frequent wildfires, more intense heat-waves, longer periods of drought in some regions and a projected increase in the frequency, duration and intensity of severe climatic/weather hazard events such as tropical storms and thus a likely increase in the number and scale of related disasters. In fact, the intensity and frequency of weather related hazard events has increased in many regions and there is mounting evidence that climate change is a factor (6, 7, 8).
Various sources (e.g., UNISPACE III (9), IGOs and NGOs,..) have noted that information derived from space-based technologies can be combined with other relevant geospatial data/information in a Geographic Information System (GIS) to provide insight and significant solutions to problems in such strongly linked areas of work as: addressing climate change, hazard/disaster risk reduction/management, human security, natural resources management, monitoring and protecting the environment, poverty reduction, public health, education, capacity building, and international development.
Remote sensing satellites, used to monitor land surface, oceans and the atmosphere, offer numerous advantages such as global coverage, repetitiveness, speed of data acquisition and consistency of collected data. Earth satellite imagery plays an important role in understanding what is currently happening and at what pace. GIS offer an integrated approach to storing, retrieving, manipulating, analyzing, integrating, displaying, comparing and interpreting spatially related sets of digital data from a variety of sources.
As an example of application, the use of RS EOS imagery and GIS technologies allows environmental scientists and local communities to assess and understand environmental changes/impacts linked to climate change as well as show the extent of human impact on the environment and to better prepare and evaluate adaptation strategies. In illustration of this, Figure 2 shows two Landsat Images of Mount Kilimanjaro in Tanzania, taken at the same season in 1976 and 2000, showing the shrinking snow cap. Kilimanjaro’s eternal snows have lost 82% of their surface since 1900. Satellites measure the snow cover at the summit of this 5895m high volcano at regular intervals.
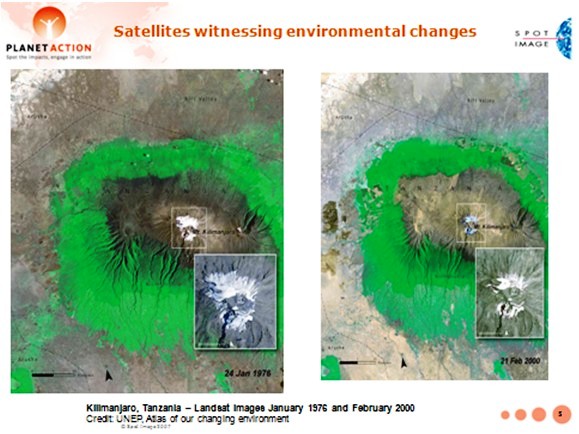
Figure 2 : Two Landsat images of Mount Kilimanjaro, Tanzania, taken in 1976 and 2000, showing the shrinking snow cap. Credit: UNEP.
Faced with the climate change crisis, and the human and environmental impact, there is an urgent need to take action to improve our understanding of climate change causes, better address current climate change impact assessment, contribute to reducing uncertainties in model projections as well as assess vulnerabilities to hazard-related disaster risks, and develop and implement comprehensive climate change mitigation and adaptation measures as well as comprehensive multihazard-related disaster risk reduction strategies.
Within the linked sectors of activity listed earlier there is an increasing need for readily accessible space technology data and information, along with the knowledge and tools required for analysis. Especially needed are value-added visual data analysis (“visualizations”) of different areas at different scales worldwide and GIS products addressing the needs of areas under consideration for more informed climate change mitigation and adaptation as well as disaster risk management-related planning, policy and decision-making.
It has also been noted that keys to the effective use of space, geo-information/GIS and other relevant technology applications for addressing socioeconomic and environmental impact issues include awareness raising, transfer of knowledge, and capacity building. Especially needed are educational and training initiatives, both traditional classroom and web-based e-learning with inclusion of case studies, for the use of such technologies (e.g., 10, 11, 12).
As noted by several sources (e.g., 3, 6, 7, 8, 13, 14, 15, 16) there is an increased awareness/recognition that the climate change mitigation and adaptation (CCMA) and disaster risk reduction/management (DRRM) communities are closely linked. Indeed, climate change increases disaster risk through processes like temperature and sea-level rise, changing precipitation patterns, rapidly expanding coastal cities and likely/projected increase in the frequency and/or severity of weather and climate hazard events with simultaneous increase in societal vulnerability to natural hazards.
The Planet Action (PA) Initiative: Earth Observation and GIS communities tackling the climate crisis
In response to international communities needs and the preoccupying climate change situation, Planet Action (hereafter PA) was launched in June 2007 by Spot Image as a non-for-profit collaborative “corporate citizenship initiative” to encourage the Earth observation and GIS professional communities to help NGOs, large organizations, local institutions and universities/research centers deal with issues in relation with climate change and encourage action in a new cooperative approach.
The PA vision or broad objective consists in tackling climate change at a local scale for a global benefit, using Earth observation and GIS technologies. This vision was largely motivated by the belief that, faced with the climate change emergency and its negative impacts, the Earth observation and geo-information/GIS industries have a strong potential to help (scientifically and practically) and should take action thanks to: 1) extensive earth observation means/technologies and services; 2) vast archives of data/images in various resolutions and from various sources(optical and radar satellites, airborne images, …) accumulated over 20 years (with more than 20 million images) for SPOT and 25 years for Landsat, time-series data,…; 3) extensive experience in analyzing and understanding Earth imagery; 4) GIS software and dynamic users’ networks; 5) a worldwide network of partner operators and receiving stations, as well as a large network of scientists, scholars and educators.
One can list three PA core objectives: 1) build capacity to understand and act upon climate change related issues and to support any local project, big or small, whether from scientific or civil societies, engaged in research and action addressing climate change causes, vulnerability, mitigation, impacts, adaptive solutions/measures and related hazard/disaster risk reduction/management for a global benefit; 2) to support cooperation within and between project teams, local communities, global organizations and to use Earth imagery and GIS as a link between these communities; 3) to raise the awareness of/educate any individual or community about climate change, the benefits of Earth observation imagery, derived geospatial information and GIS technologies, and the role of local NGOs, scientists and educators as they handle these issues.
Current actions of PA related to these core objectives include: 1) Active and ongoing support to local projects that meet the PA criteria (see below) by providing expertise and donating remote sensing data/images from different EOS (SPOT constellation, Formosat-2, Quickbird,...) to relevant organizations. PA partners (co-founder ESRI, ITT, Trimble) donate GIS and image processing tools; 2) acting as a climate change information and knowledge exchange platform, fostering cooperation between implicated communities, through the PA website (www.planet-action.org) a common depository of knowledge generated around the projects (case studies) and the expected feedback; 3) awareness raising through global education and outreach programmes supported by the PA projects and website. Projects supported by PA represent non-profit organizations worldwide and are a formidable source of rich content (each project “tells a story”); this content can be adapted to any background/level/age and told in schools (including to schoolchildren), associations or institutions.
Since its inception, PA has been joined by many contributing, project and outreach partners (PA also has an Ambassador, explorer Stéphane Lévin). Founding contributing partner Spot Image (a company created in 1982 by the French Space Agency CNES, currently owned by Astrium Services, an EADS company, and other European partners) is a world leader in the distribution of space-sourced geographic information products, services and solutions and is the commercial operator for the SPOT Earth observation satellites (see Figure 3). Co-founder ESRI is a leading GIS technologies provider. Other contributing partners include ITT, Trimble, NSPO, Digital Globe, CRISP, ITU, ESA and UNESCO.
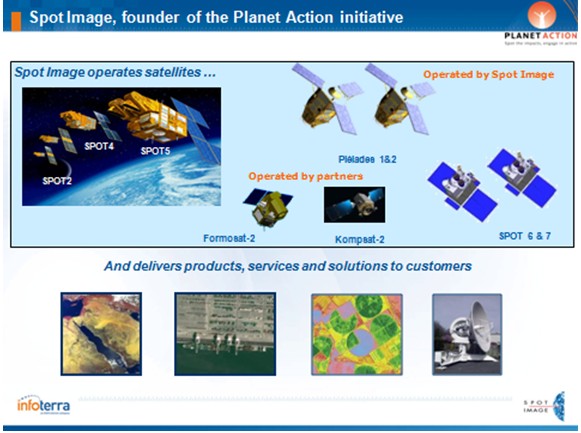
Figure 3 : Spot Image activities.
PA is currently supporting almost 400 projects worldwide (as illustrated in Figure 4). Projects investigate and assess climate change related issues in one or more of the following PA domains (fields of activity): Awareness, Biodiversity and Conservation, Drought and Desertification, Forest and Deforestation, Ice and Snow, Human Issues, Oceans and Coastlines, Water Resources.
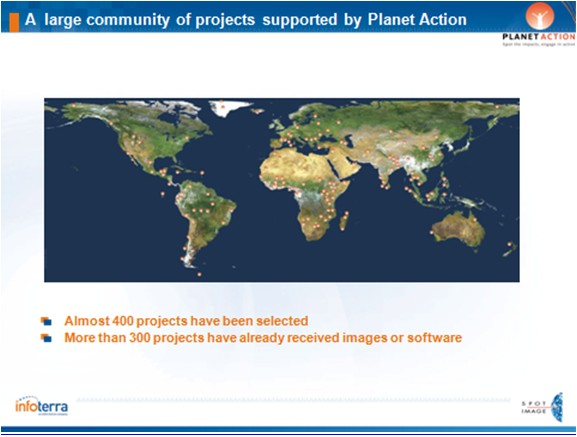
Figure 4 : Projects supported by Planet action are located on all continents and address a wide variety of topics.
NGOs, institutions and research laboratories engaged in action addressing climate change issues can submit their projects through the PA website using the on-line form. Projects should comply to the following eligibility criteria: - assess climate change related issues and propose a course of actions; - deal with at least one of the PA focus areas (currently eight); - have a member who resides in the country where the project takes place (at least for the project duration); - be proposed by a non-profit organization such as a NGO, a public laboratory or a university (business organizations do not qualify for direct support); - confirm that the project has no commercial objective; - confirm that the project has no religious or ideological content or objective. Additional criteria may be considered such as: - the importance and usefulness of the project for local populations; - a focus on building awareness, information, training or outreach activities that will result from the project; - specific methodologies supported by staff members or associated teams with an appropriate background for the work proposed.
PA then reviews and validates each proposal. Proposals which are accepted (validated) can then receive imagery and software. A typical PA project may require 5 to 10 satellite images per year-which may be provided either at once, or at different periods of time, as requested. Imagery may also have been acquired by different satellites, thus offering different characteristics (resolution, …). Once a project is validated, the Project Leader is commited to provide regular and formal feedback (posted on the PA website) for sharing of information/knowledge. For the interested reader, complete information on project submission is available at the PA website (www.planet-action.org).
Examples of supported projects / case studies
In a transfer of knowledge effort and as case studies examples for those readers who may be interested in submitting one or more proposals to PA, four selected projects having received support from PA are briefly presented below. The reader interested in obtaining more details on these and other projects is invited to visit the PA website.
Pan-Tropical mapping of forest cover project in Uganda (WHRC, UN-REDD Programme). PA domain: Forest & Deforestation.
This project is illustrated and summarized in Figure 5.
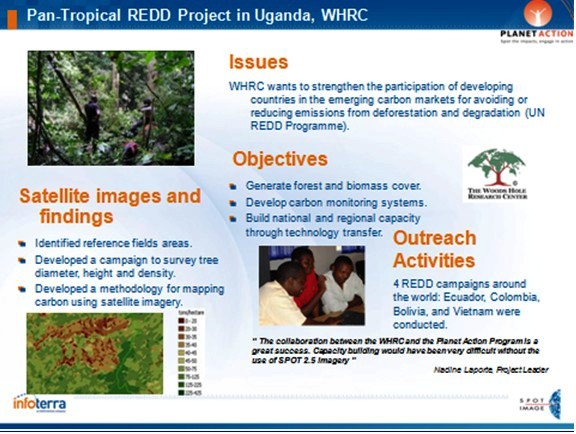
Figure 5 : Pan-Tropical mapping of forest cover project in Uganda (WHRC, UN-REDD Programme). PA domain: Forest & Deforestation.
The UN Programme for Reducing Emissions from Deforestation and forest Degradation (REDD) is a key issue as deforestation,particularly in tropical regions, is responsible for about 20% of global CO2 emissions.
The Woods Hole Research Center (WHRC) is a leading expert in forestry and has developed a method using satellite images to assess the biomass of forests (production of biomass/carbon maps) for improved forest management (including REDD). The outreach activities they ensure consist in explaining this method to populations (build national and regional capacity through technology transfer).Complete information on the REDD Programme is available at http://www.un-redd.org/
Reducing flood risks in the Philippines (GTZ). PA domain: Human issues.
The project is summarized in Figure 6.
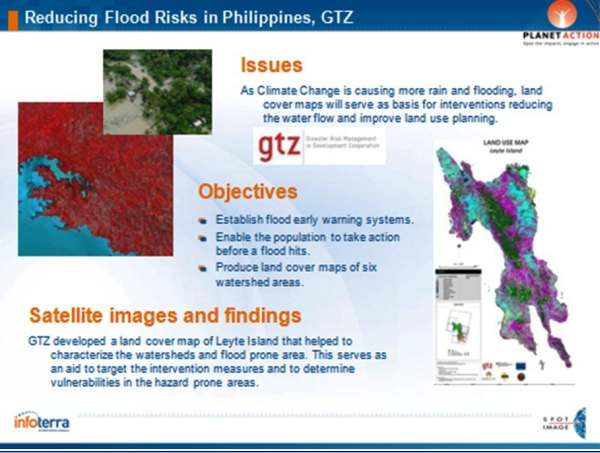
Figure 6 : Reducing flood risks in the Philippines (GTZ). PA domain: Human issues.
This project, which was discussed in a plenary presentation during the Fourth United Nations International UN-SPIDER Bonn Workshop (these Proceedings) (17), is highly technical and humanitarian at the same time. It involved the development of an early warning system that is currently under review with local government agencies and could save thousands of lives.
GTZ uses land cover maps of watershed areas in the Eastern Visayas, produced/updated by utilizing SPOT satellite images, to reduce the risk of flooding disasters.
Coral reef bleaching, Guadeloupe. PA domain: Oceans & Coast Lines and Biodiversity & Conservation.
The project is summarized in Figure 7.
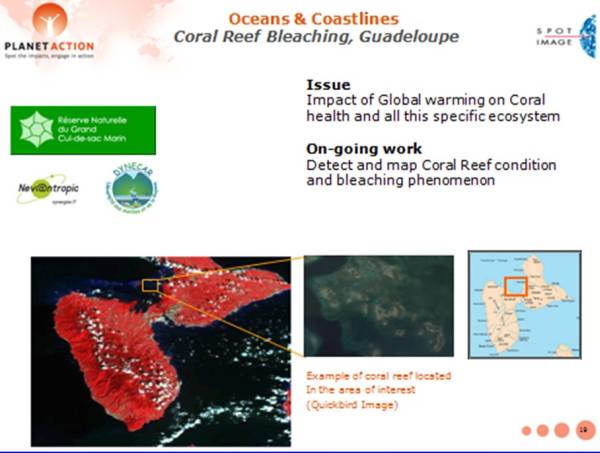
Figure 7 : Coral reef bleaching, Guadeloupe. PA domain: Oceans & Coast Lines and Biodiversity & Conservation.
Coral reefs provide direct benefits to human populations in tropical and subtropical coastal zones (e.g., sustain fisheries, provide protection from storm surges).Rising ocean temperature is a key factor behind increasingly frequent coral bleaching episodes. Also, rising CO2 levels affect ocean chemistry limit coral growth and its ability to recover from stresses like coral bleaching, which may lead to their death.
This may contribute to increasing the vulnerability of island nations.
Objectives of this project include the detection and mapping of coral reef condition and bleaching, as well as taking action to reduce human impacts on coral reef.
Glacial lake outburst flood (GLOF) risk assessment, Nepal (ICIMOD). PA domain: Human Issues.
The project is summarized in Figure 8.
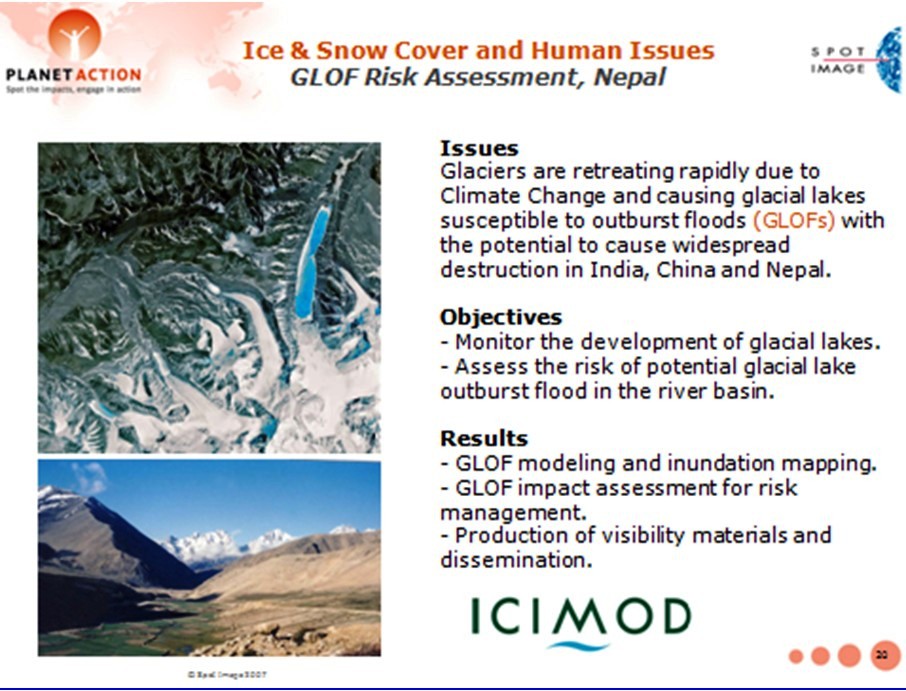
Figure 8 : Glacial lake outburst flood (GLOF) risk assessment, Nepal (ICIMOD). PA domain: Human Issues.
The globally observed retreat of glaciers is an example where climate change may lead to new threat levels, with the accumulation of water in natural moraine dams as a result of glacial melt potentially leading to glacial lake outburst floods (so-called GLOFs). With destructive down-stream effects, GLOF events can have serious impacts on the infrastructure, lives and livelihoods of mountain communities, with far-reaching socio-economic consequences.Many lakes in the Himalayas are categorized as potentially dangerous.
Objectives of this project were to monitor the growth of glacial lakes using high resolution SPOT imagery and manage GLOF risks to which populations are exposed. The project included an awareness-raising and training campain.
Examples of education- and outreach activities
In this section two representative PA educational and outreach activities are presented.
PA exhibit at the Cité de l’Espace, space science park in Toulouse.
As shown in Figure 9, PA has partnered with the Cité de l’Espace in Toulouse, a first rate science museum, to exhibit 20 projects which illustrate the use of satellite imagery and GIS technology in combating the climate change crisis.
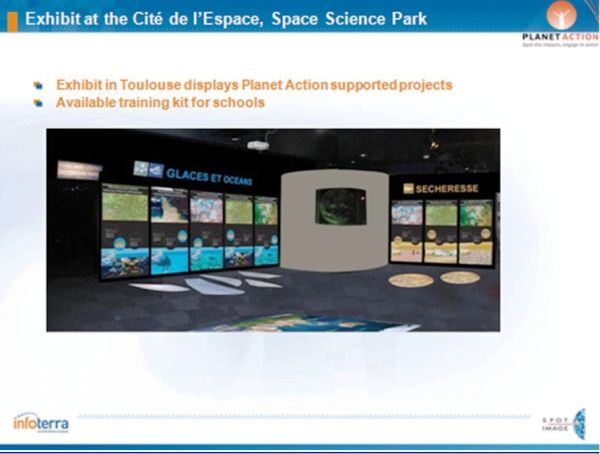
Figure 9 : PA exhibit at the Cité de l’Espace, space science park in Toulouse.
Developing awareness on the Green Belt Movement in Kenya.
PA and explorer Stéphane Lévin met with the Geen Belt Movement (GBM) for awareness action on climate change adaptation in Kenya (Figure 10). Indeed, the GBM, led by Wangari Maathai, the Nobel Prize for Peace in 2004, is pursuing a reforestation plan and has planted 40 million trees in Kenya since its foundation, demonstrating the bebefits of this type of action to local populations. The GBM turned to PA to help it better protect and monitor Kenya’s forests, and to plan reforestation strategies.
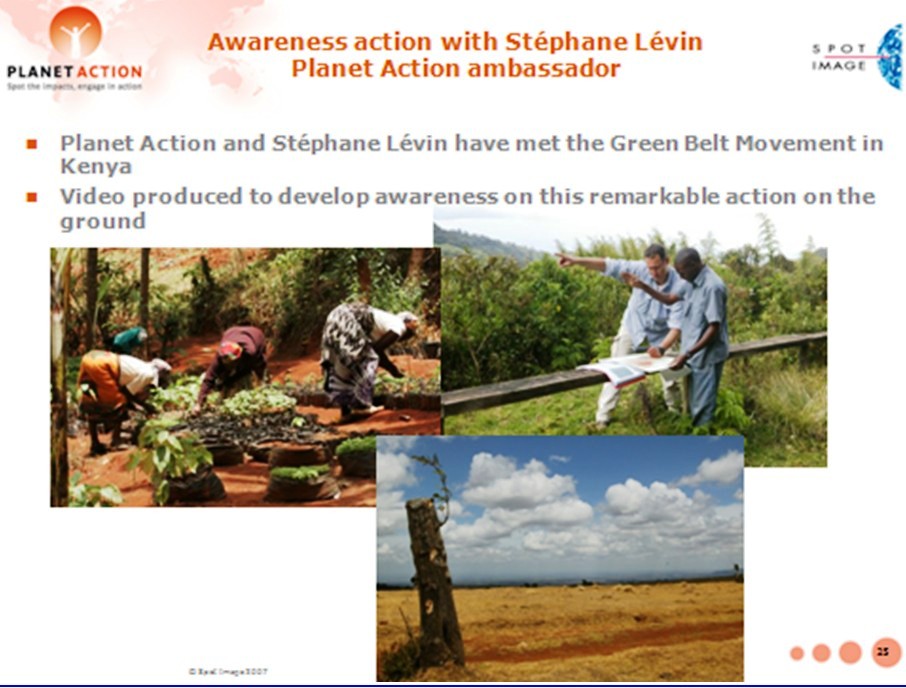
Figure 10 : Developing awareness on the Green Belt Movement in Kenya.
Conclusions
The PA Programme brings useful support (RS EOS imagery, GIS, expertise) to local projects, big & small, dealing with climate change issues (causes, mitigation, vulnerability, impact assessment, adaptation) and associated multihazard-related disaster risk reduction & management (DRRM).
In the context of the global climate change emergency and projected increases in the number and scale of hydro-meteorological hazard events and related disasters, PA offers a means of addressing several of the urgent needs related to the CCMA and DRRM sectors of activity (and also to poverty reduction and development) as discussed in Section 1 of this work.
PA has been joined numerous partners and has already provided support to a large number of projects worldwide, with substantial socioeconomic and environmental benefits.
Indeed, evaluation of PA project-related activities has demonstrated that the Programme works and creates value for all the partners involved. Especially appreciated by concerned communities and users is project/case study feedback with posting of results on the PA website.
PA will be supporting additional projets this year and will be following up on current projects. Education/outreach activities may be expanded (consider e-learning?) with new partners always welcome. PA will also continue to support communication, coordination and cooperation within and between project teams, local communities and global organizations using satellite imagery and GIS as well as the sharing of information/knowledge and experiences as a link. In particular, an important goal would be to contribute to the development of coordinated efforts between the closely linked CCMA and DRRM communities. Finally, PA may consider sharing a number of its projects/case studies with UN-SPIDER, for potential inclusion within the UN-SPIDER Communication and Information Platform (Web based Knowledge Portal).
Acknowledgments
The author wishes to thank the Planet Action team in Toulouse, in particular Patricia Dankha and Isabel Ortega, for their help and suggestions which were very useful in the completion of this work. The author is also grateful to Robert Backhaus, Natalie Epler and Ashley Lin of the UN-SPIDER Office in Bonn for their kind advice and support.
References
- IPCC, 2007: Climate Change 2007: The Synthesis Report: Summary for Policymakers. Contribution of Working Group I (WGI) to the Fourth Assessment Report of the Intergovernmental Panel on Climate Change (2007).
- IPCC, 2007: Climate Change 2007: The Physical Science Basis. Contribution of Working Group I (WGI) to the Fourth Assessment Report of the Intergovernmental Panel on Climate Change (2007).
- IPCC, 2007: Climate Change 2007: Impacts, Adaptation, and Vulnerability. Contribution of Working Group II (WGII) to the Fourth Assessment Report of the Intergovernmental Panel on Climate Change [M. Parry, O. Canziani, J.P. Palutikof, P. van der Linden, and C. Hanson (eds.)]. Cambridge University Press, Cambridge, United Kingdom, 1000 pp. (2007).
- I. Allison et al., The Copenhagen Diagnosis, 2009: Updating the World on the Latest Climate Science, The University of New South Wales Climate Change Research Centre (CCRC), Sydney, Australia, 60pp. (2009).
- Münchener Rückversicherung-Gesellschaft (Munich Re), GeoRisks Research Dept., Nat Cat Service, (2010).
- F. Sperling and F. Szekely, “Disaster Risk Management in a Changing Climate”, discussion paper prepared for the World Conference on Disaster Reduction on behalf of the Vulnerability and Adaptation Resource Group (VARG), Report with addendum on conference outcomes, Washington, DC (2005).
- International Strategy for Disaster Reduction (ISDR), Global Assessment Report on Disaster Risk Reduction: Risk and Poverty in a Changing Climate, 207 pp. United Nations, Geneva, Switzerland (2009).
- International Strategy for Disaster Reduction (ISDR), Disaster Risk and Climate Change, 2pp. , Geneva, Switzerland, (2008).
- Report of the Third United Nations Conference on the Exploration and Peaceful Uses of Outer Space, UNISPACE III, Vienna, Austria, (1999).
- A. Kucinskas and D. Seber, Geo-Information and Space Technologies-Based Geohazards-Related Disaster Management Support System, EGU General Assembly, Published on CD-ROM, Vienna, Austria, (2007).
- A. Kucinskas and D. Seber, An Interactive, Integrated Education and Training Information System for Natural Multihazard-Related Disaster Management, EGU General Assembly, Published on CD-ROM, Vienna, Austria, (2008).
- A. Kucinskas and B. Tomaszewski, Towards an Interactive Educational Environment for Disaster Management Support (IEEDM Project), Plenary Presentation, Third United Nations International UN-SPIDER Bonn Workshop, Bonn, Germany, (2009).
- International Strategy for Disaster Reduction (ISDR), Briefing Note 01: “Climate Change and Disaster Risk Reduction”, Geneva, Switzerland. (2008).
- K. O’Brien et al., Disaster Risk Reduction, Climate Change Adaptation and Human Security, Report Prepared for the Royal Norwegian Ministry of Foreign Affairs by the Global Environmental Change and Human Security (GECHS) Project, GECHS Report 2008:3, (2008).
- United Nations Framework Convention on Climate Change (UNFCCC), Climate Change: Impacts, Vulnerabilities and Adaptation in Developing Countries, 68pp. Bonn, Germany, (2007).
- L. Biukoto (SOPAC) Big Ocean, Small Islands: Building Resilience of Pacific Island Communities, Plenary Presentation, United Nations International UN-SPIDER Workshop: “Building Capacities to Reduce Disasters”, SIDS, Climate Change and Risk Reduction in the Pacific Region, Vienna, Austria, 2-4 June 2009. (2009).
- O. Neussner, (GTZ), Deriving Risk Maps from Satellite-Based Land Use Maps in the Philippines, Plenary Presentation, Fourth United Nations International UN-SPIDER Bonn Workshop, Bonn, Germany, These Proceedings, (2010).
* At the time of writing Spot Image, now Astrium GEO-information Services.