Use of satellite-based information and Geographic Information System for geo-referencing of thematic maps: Applications for risk-sensitive land use planning and emergency escape route planning in Kathmandu Metropolitan City, Nepal
Use of satellite-based information and Geographic Information System for geo-referencing of thematic maps: Applications for risk-sensitive land use planning and emergency escape route planning in Kathmandu Metropolitan City, Nepal
Tabassam Raza, Associate Dean, Graduate School of Business, Philippine School of Business Administration, Quezon City and Post Graduate Student, School of Urban and Regional Planning, University of the Philippines, Diliman, Quezon City
Leigh G. Lingad, Graduate Student, Department of Geography, University of the Philippines, Diliman, Quezon City
Abstract
This paper provides a step-by-step procedure in identifying and modifying a projection/coordinate system of shapefiles with little or no metadata using satellite information. It also aims to apply a developed procedure to achieve further modification to the system’s parameters for higher projection and coordinate system accuracy using ArcMap’s Affine Transformation tool. To demonstrate the applicability of the proposed procedure, examples on how to integrate satellite and GIS-based information in Risk-Sensitive Land Use (RSLU) planning and Emergency Escape Route (EER) planning, are presented.
Introduction
Background
In developing risk-sensitive land use plans, the locational precision of thematic maps for planning plays a vital role. It is imperative to have accurate information about real conditions on the ground at the time of planning. Lack of such may lead to the development of an inappropriate land use plan – especially when people and property are vulnerable to disasters. It is therefore essential to have accurate geo-referencing of thematic maps and supporting satellite information.
During the development of Kathmandu Metropolitan City’s (KMC) RSLU Planning, shapefiles from various sources such as the Japan International Cooperation Agency (JICA), Kathmandu Valley Town Development Committee (KVTDC) and KMC offices were used. However, the shapefiles were found to be based on an unknown coordinate system. This necessitated adjustment to achieve more suitable coordinate system for the shapefiles.
Previous studies show that the most frequently encountered problems are related to missing information on projection modification and the absence of metadata information. For example, in a study on vehicular carbon-monoxide pollution in Kathmandu Valley, Google Earth was used to transform the shapefiles to a correct projection (1).
Furthermore, earth observation techniques through Remote Sensing (RS) are proven to be more cost-effective than ground-based techniques over a large area. There has been an emergence of high-resolution satellite data in recent years, with greater degree of spatial and temporal variation (2).
The main objective of this study is to come up with a procedure to identify and modify a projection/coordinate system of shapefiles. This study also aims to apply the procedure to check its workability to KMC’s land use and other thematic maps and to provide examples on integrating satellite- and GIS-based in the preparation of RSLU and EER plans.
The developed procedure is considered to be cost-effective because satellite imagery is freely available at Google Earth. One can import GIS data into Google Earth for visualizations. The procedure is thus imperative and can be adapted to similar cases or/and when paper maps need to be digitized, customized and corrected. Extra modification to the system’s parameters can still be made to improve accuracy using additional GIS tools (Spatial Adjustment) and other satellite information.
Conceptual Framework
The Conceptual Framework (Figure1) shows that collected secondary data will go through preliminary GIS analysis and organization, as a prerequisite for the development and application of the methodology. Then, the methodology will be developed and implemented to come up with adjusted thematic maps. With satellite- and GIS-based information, the modified maps will then be used as inputs for the RSLU and EER planning processes.
Methodology
Davis et al. (1991) collated and outlined three benefits from combining GIS and remote sensing in various studies, namely, (a) satellite imagery: improving positional accuracy of thematic maps vis-à-vis satellite imagery; (b) remotely sensed image classification using GIS data; and(c) calibration of remotely sensed data and overlay on thematic maps for spatial process modeling. They summarized the synergistic involvement of cartography, remote sensing, and GIS as follows:
- Remote sensing measures and monitors surface electromagnetic variation.
- GIS organizes and analyses the measurements.
- Cartography improves the modeling of surface processes using spectral data (3).
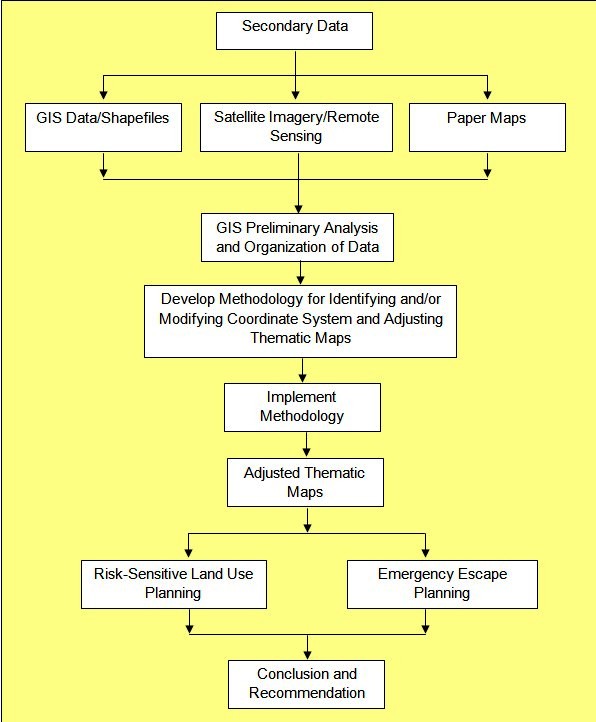
Figure 1: Conceptual framework
The overlaying of thematic maps for spatial modeling is similar to the process involved in delineating suitable areas in land use planning and in formulating emergency escape routes. Recent advances in satellite imagery and Internet (i.e. Google Earth) allow for more than just surface electromagnetic variations such that high-resolution photographic images of the ground are readily available. In addition to abstract modeling of surface processes, these can now be used in risk-sensitive land use planning and emergency escape route planning processes along with the proper use of networking analyses methods and application of land use planning theories.
Identification and modification of a Coordinate System
The following procedure demonstrates how the positional accuracy of thematic maps with incorrect or no metadata can be improved using geo-referenced satellite imagery. Figure2 illustrates the flow of the activities involved in the procedure.
Step 1. Collect secondary data available from various sources.
Step 2. Select a shapefile and check the metadata for the coordinate system information. If the metadata is available proceed to Step 3. If not (Figure3), proceed to Step 5.
Step 3. Validate the information by plotting the selected shapefile on a reference shapefile (Figure4) acquired from credible sources.
Step 4. If the shapefile fits with reference shapefile, it is ready for geodatabase (Figure2); if not, proceed to next step.
Step 5. Identify appropriate coordinate systems from available coordinate system list in ArcGIS (Figure5a) based on the proximity of the area.
Step 6. Select the system that fits closest to the reference shapefile by trial and error method (Figure5b). In this study, the coordinate systems in the Indian subcontinent group were chosen because of their proximity to Nepal.
Step 7. If the selected coordinate system enables the shapefile to fit with the reference shapefile, it is ready for geo-database (Figure2). If not, proceed to next step.
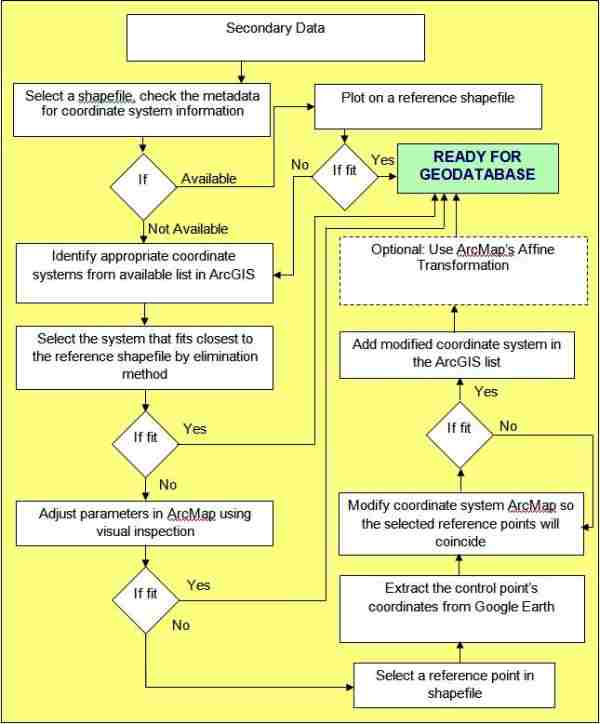
Figure 2: Procedure Activity Flow Paradigm
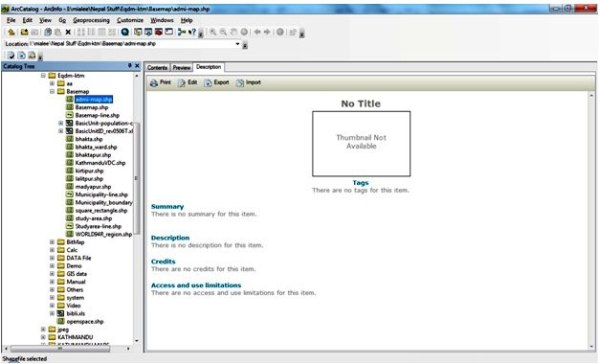
Figure 3: No metadata in ArcCatalog
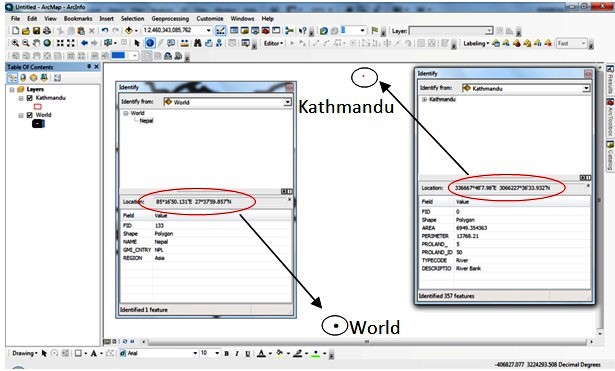
Figure 4: Dislocation of Kathmandu shapefile from reference world shapefile
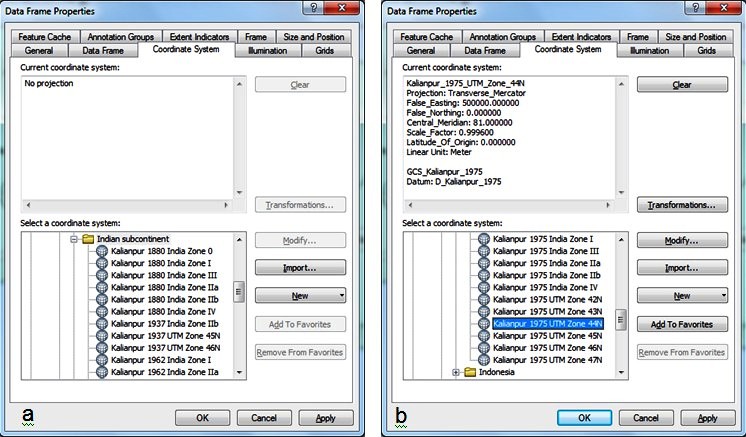
Figure 5: appropriate coordinate systems and selected coordinate system in the data frame properties
Step 8. In the Data Frame Properties, modify the datum parameters of the selected coordinate system so that the shapefile will coincide with the reference shapefile (Figure6). If the selected coordinate system enables the shapefile to fit with the reference shapefile, it is ready for geo-database (Figure2). If not, proceed to next step.
Step 9. Select the reference point in the shapefile, one that is easily discernible, such as road intersections or familiar places.
Step 10. Locate the same point in Google Earth. Extract the coordinates and then plot that point in ArcMap. This becomes the control point. Return to the Modification window and adjust the parameters accordingly so the two reference points will coincide. Once the two points coincide, stop modification.
Step 11. Convert the shapefile into Google Earth format. Check for accuracy by matching the shapefile’s features in the satellite imagery. If the features fit to an acceptable degree based on the purpose the map, save the modification and add to the list (Figure7). If not, proceed to the next step.
Step 12. For higher accuracy, use ArcMap’s Affine Transformation in the Spatial Adjustment tool (Figure8).
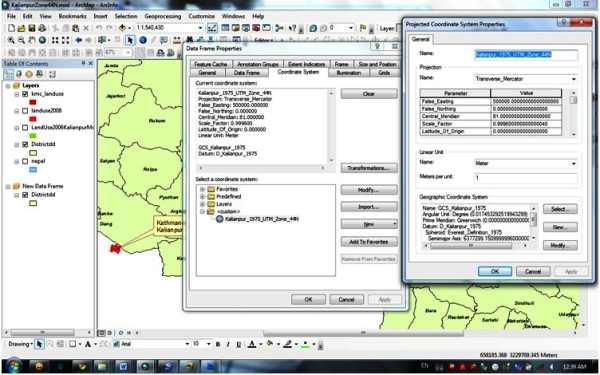
Figure 6: modification of Coordinate systems in Data Frame Properties
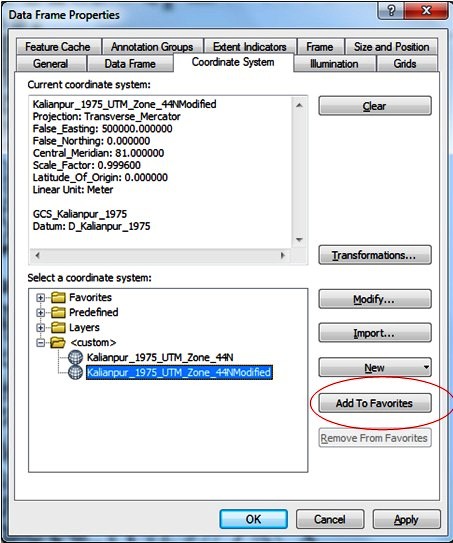
Figure 7: Adding to the list in data frame properties
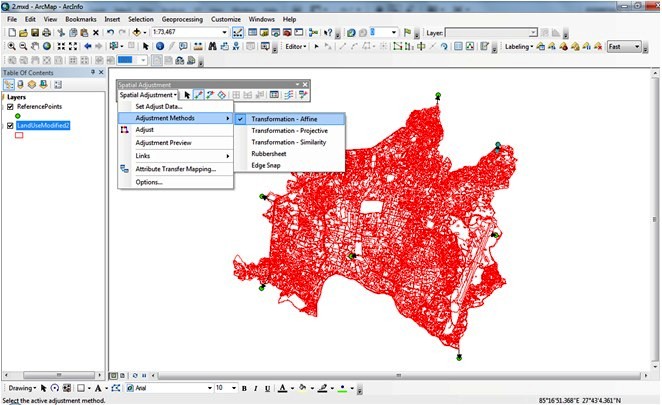
Figure 8: Spatial adjustment method of the shapefile with control points
Integrating Satellite and GIS Data
Once the shapefiles are adjusted, the satellite and GIS can be integrated towards Risk Sensitive Land Use (RSLU) and Emergency Escape Route (EER) planning.
Mechanism Towards RSLU Planning
Step 1. Plot the adjusted proposed development areas shapefile in ArcMap to select the priority area for a particular development e.g., residential.
Step 2. Export the adjusted shapefile to Google Earth to validate if the proposed areas are still suitable for proposed development.
Step 3. Update the shape file based on the new information extracted from the satellite imagery.
Mechanism Towards EER Planning
Step 1. Delineate an area of study.
Step 2. Upload the adjusted shapefile of critical facilities (e.g. hospitals) to Google Earth.
Step 3. Update the road shapefile by digitizing on Google Earth.
Step 4. Identify vacant areas as Emergency Crisis Centers during disasters.
Step 5. Export the roads and Emergency Crisis Centers back to ArcMap for network analysis.
Step 6. Export back to Google Earth for overlay on real-time satellite imagery.
Implementation and application of procedure
Planners need to rely on the mandated guidelines for more realistic plans especially for RSLU and the development of EER plans. A number of important aspects should be taken into consideration to ensure the proper planning and implementation of possible safety measures in the event of disasters.
Therefore, many countries provide a comprehensive, step-by-step process for the preparation of plans at all levels—from municipal to provincial to regional and national. A guideline at city/municipality level, “A Guide to Comprehensive Land Use Plan Preparation” brings to fore the importance of analyzing the current situation of a given planning area. Part of the analysis involves technical and participatory methods (4). For instance, sieve mapping allows for a systematic assessment of the landscape and condition. This is a prerequisite for setting the goals and objectives of the planning area, which directs the identification of development thrust and spatial strategies, and the preparation of corresponding land use plans.
It is therefore prudent to validate the geo-referencing and actual land uses of the planning area. Several techniques may be employed here. The methodology developed in this study emphasizes the use of satellite imagery and GIS technology to derive and analyze land use data. It intends to address incorrect geo-referencing and unidentified projection/coordinate systems, leading to inappropriate decision-making, potentially endangering the environment, infrastructure, and human lives.
Identification and Modification of Coordinate Systems
Following is the output of the procedure described above using the shapefile of proposed land use in 2001from KMC (5).
The Kathmandu City shapefile is selected to identify appropriate coordinate systems from available list in ArcGIS. The selection of the system that best fits the reference shapefile used elimination method. It was found out that the best fit among the known coordinate systems is the Kalianpur 1975 UTM Zone 44N. However, it locates KMC off by about 3° longitude to the west and 10” to the south (Figure9).
The chosen system’s parameters were then modified by visual inspection on reference shapefiles. This changed the false_easting to 210,000 and the latitude_of_origin to 0.2 (Figure10).
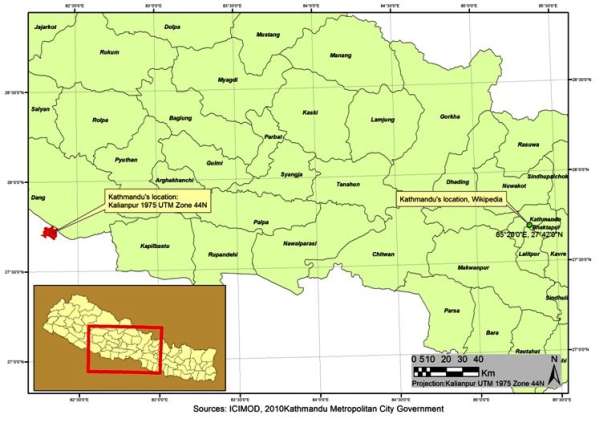
Figure 9: Kalianpur 1975 UTM Zone 44N relative to the reference shapefile
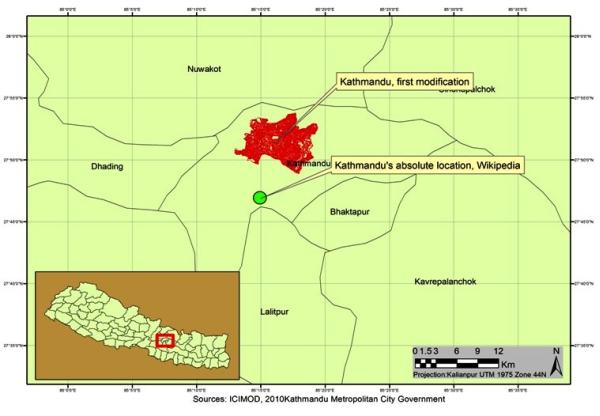
Figure 10: First modification output
Further modification was necessary to improve accuracy vis-à-vis geo-referenced points. One was extracted from Google Earth (Figure11).
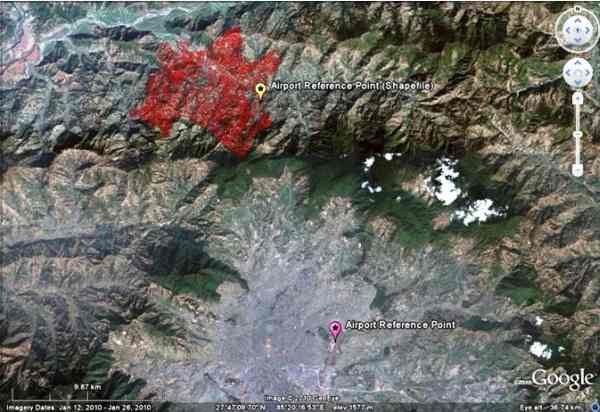
Figure 11: Reference point from Google Earth
Based on the reference point, parameters were adjusted. The false_easting and standard_parallel_1 were modified to -8491750.00 and 16.191700, respectively (Figure12).
This increased the accuracy, but it still has approximately 400m offset at different parts of the area. To achieve even higher accuracy the shapefile was transformed using ArcMap’s Affine Transformation in the Spatial Adjustment tool (Figure13).This further decreased the offset leaving approximately 150 meters discrepancy elsewhere.
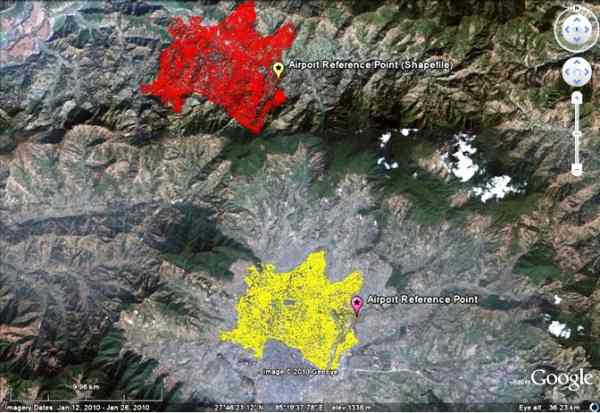
Figure 12: Two modifications of Kalianpur 1975 UTM Zone 44N. Red is the first modification and yellow is the second modification.
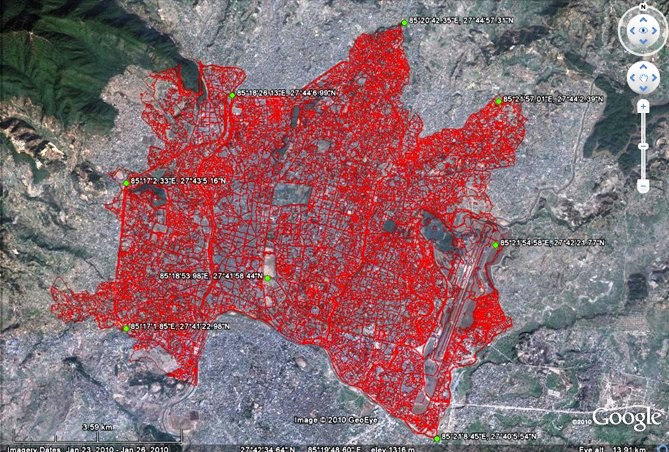
Figure 13: Final transformation using the Affine adjustment.
Application 1: GIS and Satellite Imagery for RSLU Planning
Following is the output of the step-by-step procedure described above, using the adjusted shapefile of proposed development areas by Earthquake Disaster Mitigation in the Kathmandu Valley, 2002 (6) (Figure14).
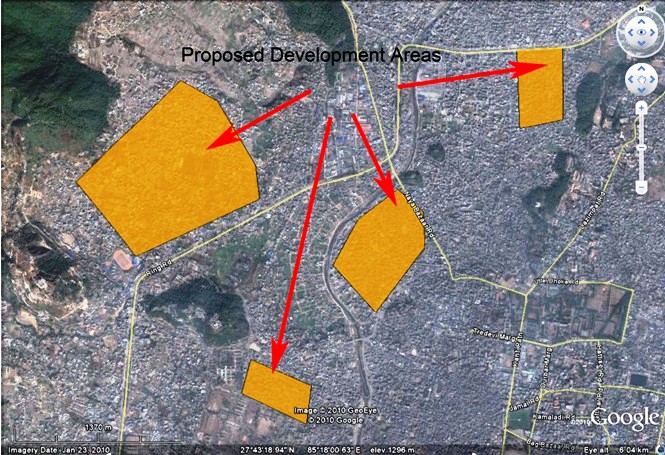
Figure 14: Zoom in of proposed development areas for updates
Application 2: GIS and Satellite Imagery for EER Planning
Following is the output of the procedure described above, using the adjusted shapefile of critical facilities and roads KMC 2002 (7) (Figure15).
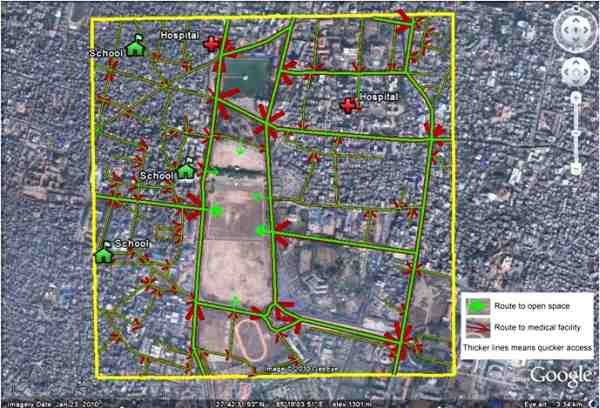
Figure 15: EER example
Conclusion and recommendations
The methods used in adjusting shapefiles are simple enough for those without sufficient training in geodesy but are capable of operating GIS software. This simplicity comes with the trade-off of accuracy. Davis, et. al. (1991) warn of various trade-offs including the imposition of thematic map errors and remote sensing measurements. In this study, the level of precision achieved may be sufficient for planning and analyses at larger levels, such as city/municipality, provincial, regional and national levels. For larger scale implementation, i.e. ward, village, or barangay level programs, projects and activities, there is a need to have detailed groundtruthing for higher levels of accuracy. Furthermore, the methods used are very cost effective, saving logistics expenses for field workers.
Further studies are recommended to gather more empirical data to refine and develop the methods used in this paper.
Acknowledgements
The authors are grateful to Earthquakes and Megacities Initiative, Inc, German Federal Foreign Affairs Office, and the Kathmandu Metropolitan City Office for the development of the Mainstreaming Disaster Risk Reduction in Megacities: A Pilot Application in Metro Manila and Kathmandu: Risk-Sensitive Land Use Plan, Kathmandu Metropolitan City, Nepal. This work gave the authors the opportunity to explore this study.
They are also grateful to the Philippine School of Business Administration for the logistics and resources.
Gratitude is also extended to Harold A.M.P. Lim and other individuals and organizations who contributed in one way or another in the development of this paper.
References
- S.Gurung, Modeling the dispersion of vehicular carbon-monoxide (CO) pollutionin Kathmandu valley, Nepal:A CALINE4 approach combined with GIS Techniques. University of Calgary. (2010).
- K.Poudel. The thread of Space, Time, and Event: An Implication in Media Studies, Bodhi, 3(1), 92-98. Kathmandu University. (2009).
- F.Davis, et.al. Environmental analysis using integrated GIS and remotely sensed data: some research needs and priorities. Photogrammetric engineering and remote sensing. No.6, vol 57.pp 689-697 (1991).
- Housing and Land Use regulatory Board, A Guide to Comprehensive Land Use Plan Preparation, New Edition, Volum I, pp. 38, 200. Philippines. (2006).
- Kathmandu Metropolitan City Office
- Japan International Cooperation Agency and the Ministry of Home Afairs of Nepal. The Study on Earthquake Disaster Mitigation in the Kathmandu Valley, Kingdom of Nepal, Volume III. (2002).
- T. Pradhan. Kathmandu Metropolitan City GIS Office. (2006).
- F.W. Davis et al. Ibid.