In Detail: Recommended Practice drought monitoring using the Vegetation Condition Index (VCI)

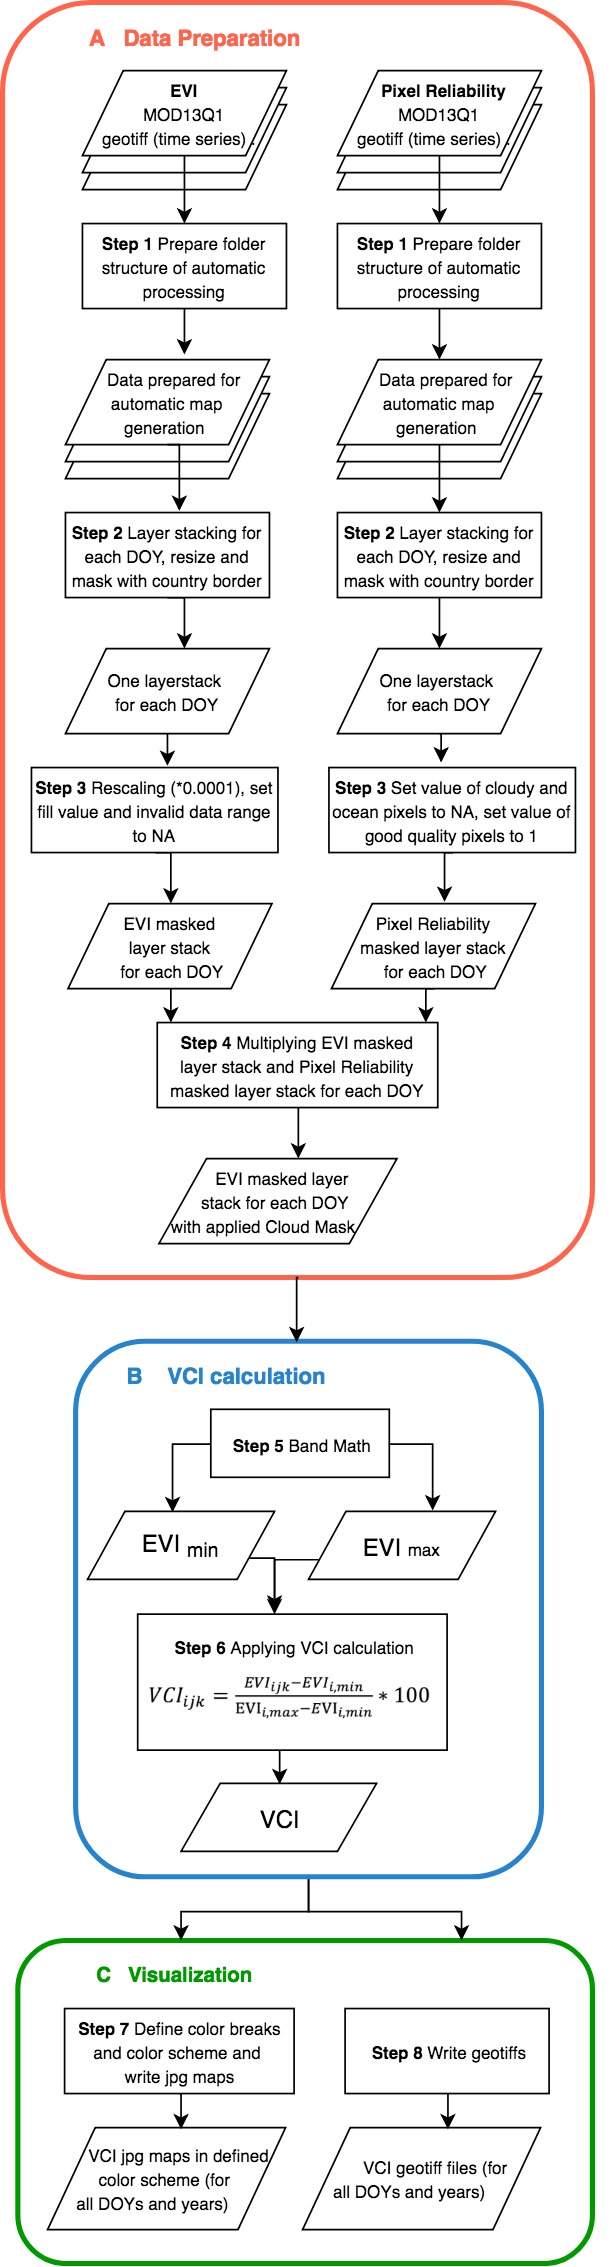
Spectral vegetation indices are among the most commonly used satellite data products for evaluation, monitoring, and measurement of vegetation cover, condition, biophysical processes, and changes. This recommended practice shows how to apply a multi-temporal analysis of MODIS-based Vegetation Condition Index (VCI) to support drought monitoring and early warning. The method has been developed by the Iranian Space Agency and was firstly applied in Iran using ENVI 4.8.

The recommended practice on drought monitoring and early warning was consecutively adapted and updated and can now be followed using ENVI, RStudio and Python. The versions most up to date now also include a cloud mask, which had not been considered before. Also, an additional R script is provided to be able to compute the VCI for large areas (>200.000 km2). The adapted versions were tested in Central America.

A related recommended practice applies the Standardized Vegetation Index (SVI) instead of the Vegetation Condition Index (VCI) for drought monitoring and can be found here

Background

Drought is a recurring phenomenon that can lead to significant losses to societies affecting different aspects of human life such as agriculture, food security, and the environment. Since 1967 droughts have affected 50% of the 2.8 billion people who suffered from all natural disasters [1].

Traditional methods of drought assessment and monitoring rely on rainfall data. However, this approach has two main disadvantages: rainfall data are limited to the region, and they are often inaccurate and difficult to obtain in near-real time. In contrast, satellite-sensor data is continuously available and can be used to detect the onset of a drought, its duration and magnitude [2]. The purpose of this recommended practice is to monitor impacts of meteorological droughts on natural vegetation (rain fed, range land & forest). Availability, simplicity, free of charge data, good research literature and citation, minimum requirements of inputs are main criteria, which have been considered to define the methodology.
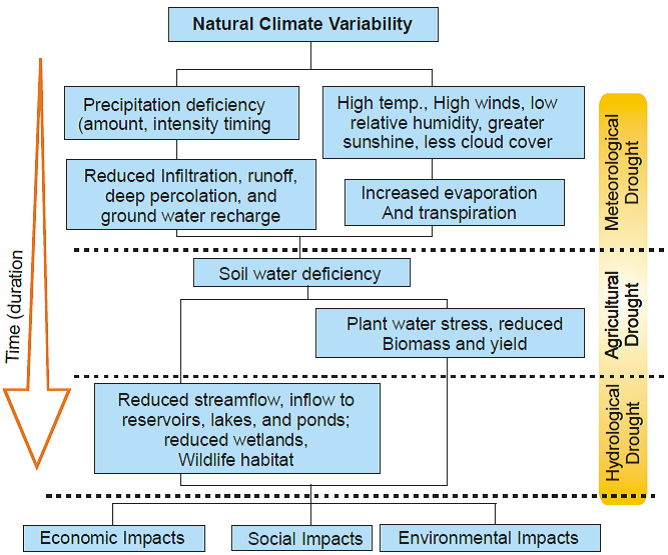
Drought definition

Meteorological drought is often defined by a period of substantially diminished precipitation duration and/or intensity. The commonly used definition of meteorological drought is an interval of time, generally on the order of months or years, during which the actual moisture supply at a given place falls below the climatically appropriate moisture supply.

Agricultural drought occurs when there is inadequate soil moisture to meet the needs of a particular crop at a particular time. Agricultural drought usually occurs after or during meteorological drought but before hydrological drought.

Hydrological drought refers to deficiencies in surface and subsurface water supplies. It is measured as stream flow, snowpack, and as lake and groundwater levels. There is usually a delay between lack of rain or snow and less measurable water in streams, lakes and reservoirs. Therefore, hydrological measurements tend to lag other drought indicators.

Socioeconomic drought occurs when physical water shortages start to affect the health, well-being, and quality of life of the people, or when the drought starts to affect the supply and demand of an economic product.

The figure below shows the relations between these types of drought:

Definition of the VCI

Kogan proposed a Vegetation Condition Index (VCI) based on the relative Normalized Difference Vegetation Index (NDVI) change with respect to minimum historical NDVI value. The VCI therefore compares the current Vegetation Index (VI) such as NDVI or Enhanced Vegetation Index (EVI) to the values observed in the same period in previous years within a specific pixel.

The VCI is calculated as shown below,

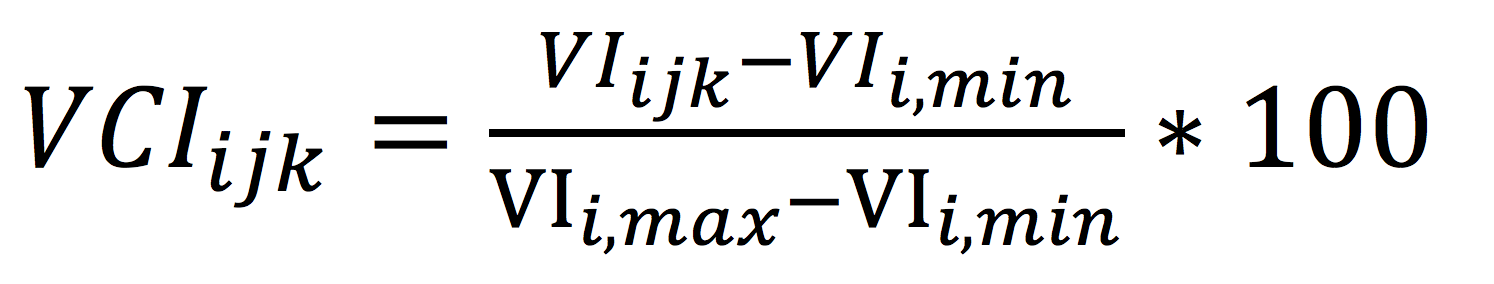
where VCIijk is the VCI value for the pixel i during week/month/DOY j for year k, VIijk is the weekly/monthly/DOYs VI value for pixel i in week/month/DOY j for year k whereby both the NDVI or EVI can utilized as VI, VIi, min and VIi,max are the multiyear minimum and maximum VI, respectively, for pixel i.

The resulting percentage of the observed value is situated between the extreme values (minimum and maximum) in the previous years. Lower and higher values therefore indicate bad and good vegetation state conditions, respectively.

While the first step-by-step instructions for calculating the VCI in ENVI 4.8 and 5.0 as well as the first update in R based the normalized index on the NDVI, the consecutive updates in R as well as the implementation in Python are based on the EVI which has some advantages compared to the NDVI such as

  • no distortions in the reflected light caused by the particles in the air,
  • no distortions in the reflected light caused by ground cover below the vegetation, and
  • the EVI data product does not become saturated as the NDVI when viewing rainforests and large amounts of chlorophyll.

Cloud mask

In order to mask out pixels that are impacted by atmospheric interferences such as clouds as well as snow and ice cover, the Pixel Reliability Quality Assurance (QA) layer of MOD13Q1 is being used. The layer classifies the quality of the vegetation index in the following categories:

"Good" and "marginal" data in the pixel reliability bands are accepted as sufficient quality and will be considered for the analysis. Therefore, other filter values than "0" and "1" are used to mask out the corresponding EVI pixels.

Find more information about the MODIS Land Products Quality Assurance here.


Input data:

MODIS is the primary sensor for monitoring the terrestrial ecosystem in the NASA Earth Observing System (EOS) program [2]. Time series of MODIS imagery provide near real-time and continuous data with a high temporal resolution. The MODIS sensor acquires data in 36 spectral bands, with variable spatial resolution of 250–1000 meters (depending on band), in narrow bandwidths recorded in 12-bit format. MODIS bands are a compromise for atmospheric, land and ocean studies. Seven bands are considered optimal for land applications [3]. MODIS data and products are all available since year 2000.

  • MODIS MOD13Q1 EVI or NDVI data: full time series (2000 until to date) for the specific days of the year that are of interest in the selected geographic region (available from AppEEARS)
  • MOD13Q1 Pixel Reliability data (available from AppEEARS)
  • Input data used for the step-by-step instructions in ENVI
    • Two weeks composites of NDVI (MVC) from MODIS Satellite Imagery: In the test site, highest vegetation growth is during May and June. Thus, two weeks maximum value composites (MVC) of NDVI from MODIS Imagery (year 2000 to 2013) of May and June were used. Note that in other areas of the world the choice of months will vary.
    • Land Cover Map: From MODIS multi-temporal 2-weeks NDVI composites of the year 2012 and topographic and ecological parameters, a Land Cover (LC) Map of the study area was generated in ENVI software. A knowledge-based classification method was used to classify the region to 18 LC classes (Dense forest, medium forest, irrigated lands, Orchard, rain-fed, dense range, medium range, poor range, sand dune, marne, salin land, bare land, outcrop, seasonal lake, island, wetland, water body, snow & ice). Since, the main objective of current study is to monitor meteorological drought impacts on natural vegetation (rain fed, range land & forest), these three classes were masked from the available Landcover map. All NDVI composites were masked based on rain fed and range land classes separately [see more details in "Step-by-Step"]. Note that the classification is not described in the step-by-step procedures; it is assumed that a land cover map is available to the user.

Software:

  • ENVI 4.8 or 5.0
  • R (free statistical software)
  • Python: To run the Python version via the provided Jupyter Notebook you need python installed on your computer. We recommend downloading and installing Anaconda 3 (https://www.anaconda.com/download/) with the python 3.6 version as it includes a lot of useful packages
  • (Modis Reprojection Tool (MRT))


The results of this study can be used for the development of a regional drought monitoring and risk assessment system. Considering the spread and frequency of droughts in the region on the one hand, and the lack of ground climate observations and technical capacity in the countries of the region to deal with droughts on the other, such a system could play an invaluable role for drought preparedness.

The results can be used as a drought-monitoring tool and as a tool for decision support in regional drought assessment and management. This recommended practice can be applied globally.


Strengths:

  • MODIS data is freely available and easy to access. The availability of MODIS data is guaranteed at least until 2018, with continuity missions planned with its successors NPP and NPOESS
  • Tests showed that NDVI curve findings and VCI trends are similar to Standard Precipitation Index (SPI) results
  • The MOD13Q1 product has already undergone important preprocessing steps like geometric and atmospheric correction. The vegetation indices NDVI and EVI are readily available, which makes the dataset easy to use
  • The Pixel Reliability QA layer, also included in MOD13Q1, is used to mask out pixel that are impacted by atmospheric interferences such as clouds which improves the information of the final SVI maps
  • The user interested in applying this recommended practice has a high flexibility in choosing the preferred software as well as computing the VCI based on either EVI or NDVI depending on the analysis interest

Limitations:

  • MODIS sensors are mounted on two satellite platforms: Terra (launched in December 1999) and Aqua (launched in May 2002). This means, the time series go back to 2000/2002, which is not very long from a climatologic viewpoint. Since the SVI is using the mean and standard deviation of the time series, it is desirable to use a representative time span. It is however possible to extent the time series with AVHRR data provided that a thorough inter-calibration between the two sensor systems is given
  • The limitations of NDVI mean curves are that the deviation from the mean does not take into account the standard deviation, and hence can be misinterpreted when the variability in vegetation conditions in a region is very high in a given year [4]
  • In order to get more objective information, it is recommended to combine remote sensing data and meteorological operational data [5]. However, simultaneous meteorological data are often lacking. Besides, primary processing for meteorological data is time-consuming.
  • Drought monitoring methodologies for low resolution data require historical NDVI records extending longer than MODIS and Spot VEGETATION operational times. (It was found that NDVI data for one sensor could be predicted from NDVI data collected by another sensor with considerable accuracy. Consequently, MODIS and Spot VEGETATION historical NDVI records could be extended based on past AVHRR data, and applications could benefit by interchanging sensors for provision of NDVI data in the event of a sensor failure)

  1. Jain, SK, Keshri , R, Goswami , A, Sarkar , A, Chaudhry , A (2009). Identification of drought vulnerable areas using NOAA AVHRR data, International Journal of Remote Sensing, 30(10).

  2. Thiruvengadachari,s; Gopalkrishna.H.R,(1993). An integrated PC environment for assessment of drought. International journal of RS 14:3201-3208.

  3. Justice et al, Remote Sensing of environment, (2002). The MODIS fire products.

  4. Thenkabail, P. S., Gamage, M. S. D. N. and Smakhtin, V. U, The Use of Remote Sensing Data for Drought Assessment and Monitoring in Southwest Asia International Water Management Institute.

  5. HONGRUI ZHAO et al. Agriculture Drought and Forest Fire Monitoring in Chonqing City with MODIS and Meteorological Observations.